Zentrading Trend Follower_v1.1For more information on how to use and how to subscribe please visit
www.zentrading.co
Our ZenTrend Follower is designed to get you into trends in a safe an risk averse manner. It does not only provide you with buy and sell signals forcing you to either react quickly or miss the trade. Rather, our algorithm detects when a trend setup is active and plots a breakout level where you can enter the trade. This also makes it easy for you to scan many assets quickly: All you need to do is see if the indicator has detected a setup, if not, move on!
To ensure that you capture the trend, the indicator indicator shows you where to place your stop loss as the trend progresses. We will also show you a few other simple ways to exit the trades at higher profit levels in the detailed manual you receive after purchasing the indicator.
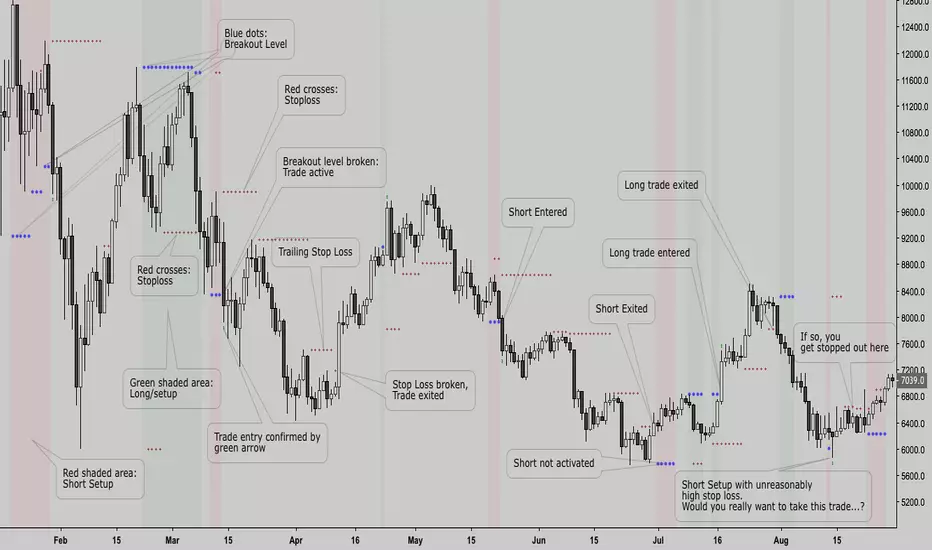
The shaded areas on the chart indicate that a trade setup has been detected by the algorithm: Green for bullish setups, red for bearish setups. The blue dots are the breakout level, if the price breaks this level the trade is entered. (as you can see on the chart, they can sometimes move towards the price!) Red crosses are plotted as your trailing stop loss, if price breaks the stop loss the trade is closed.
Strategy!
-- Ultimate Crypto Trading Strategy -- By @CryptoNTez -- Ultimate EMA Cross Strategy. Easy and profitable strategy optimized for Crypto.
This script will signal Long and Exit signals on different timeframes based on different indicators using HA candles
The script is optimized to catch trend movements as soon as possible and maximize profitability.
Check the Strategy tester results. 92% Profitable on BTC Daily scale...
If you want access send me a PM on Tradingview or a DM in twitter @CryptoNTez.
Best regards and happy trading.


Gunbot Deluxe Tuners BE [Alerts]Revision 18
Gunbot Deluxe Tuners BE Alerts is part of the official Gunthy version of Gunbot Deluxe Tuners.
It is the companion Alerts script for the Gunbot Deluxe Tuners BE (Black Edition) backtesting and optimizing script.
This Alerts script allows user to automatically send alerts directly to Gunbot through the Gunbot TradingView addon.
Available only to verified Gunbot owners. No exceptions. Anyone interested in obtaining this script must contact either their official Gunbot reseller or me privately.
No public requests or donations for access to this script will be granted. No exceptions.
NOTICE: By requesting access to this script you acknowledge that you have read and understood that this is for research purposes only and neither I or Gunthy are responsible for any financial losses you may incur by using this script!

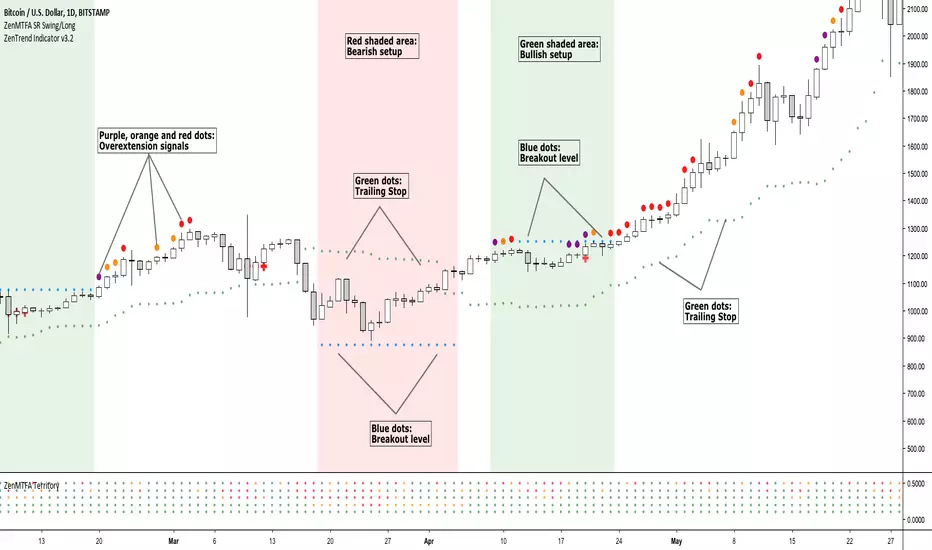
Zentrading Trend FollowerOur Trend following indicator is designed to get you in every trend safely, but perhaps most importantly, keeps you out of bad trades.
It performs well on all assets as it captures trending moves.
It does not only provide you with buy or sell signals you have to react on quickly, rather, it shows you when a trade setup is active. In this way you can anticipate the break of the breakout level to enter the trade. A trailing stop loss is used to exit.
It will work on all timeframes, but as lower timeframes add more noise to the market there will naturally be more losing trades than on higher timeframes. We recommend using it on anywhere from the weekly down to 1 or 2 HR -0.44% timeframes.
It is very simple to use:
The shaded areas on the chart indicate that a trade setup has been detected: Green for bullish setups, red for bearish setups.
The blue dots are plotted as the breakout level, if the price breaks this level the trade is entered. (as you can see on the chart, they can sometimes move towards the price!)
Red crosses are plotted as your trailing stop loss, if price breaks the stop loss the trade is closed.
This is a subscription indicator, please pm for information on how to access.
Happy trading!
Trend Hunter BETAThis is the Trend Hunter Alert Companion study. A trend following/breakout strategy with profit percentage targets.

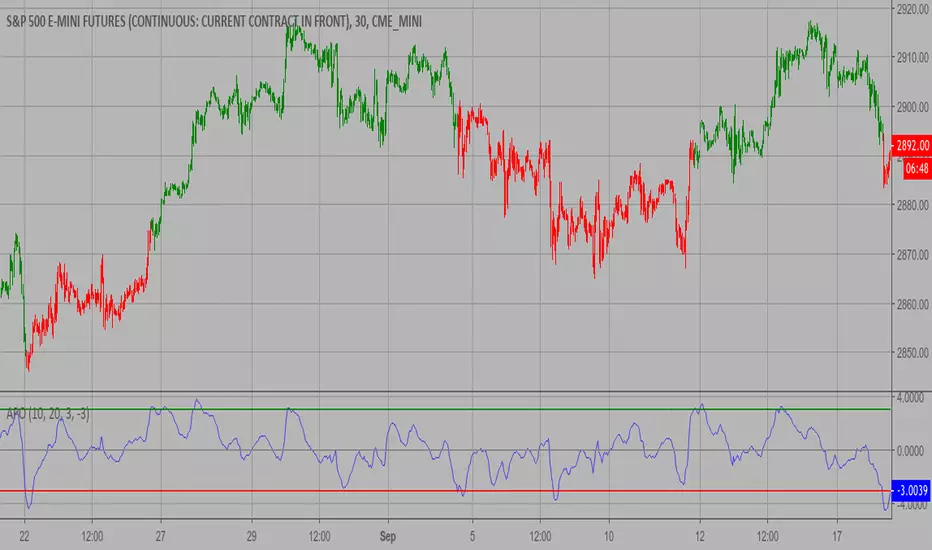
Absolute Price Oscillator (APO) Strategy 2.0 The Absolute Price Oscillator displays the difference between two exponential
moving averages of a security's price and is expressed as an absolute value.
How this indicator works
APO crossing above zero is considered bullish, while crossing below zero is bearish.
A positive indicator value indicates an upward movement, while negative readings
signal a downward trend.
Divergences form when a new high or low in price is not confirmed by the Absolute Price
Oscillator (APO). A bullish divergence forms when price make a lower low, but the APO
forms a higher low. This indicates less downward momentum that could foreshadow a bullish
reversal. A bearish divergence forms when price makes a higher high, but the APO forms a
lower high. This shows less upward momentum that could foreshadow a bearish reversal.
WARNING:
- This script to change bars colors.
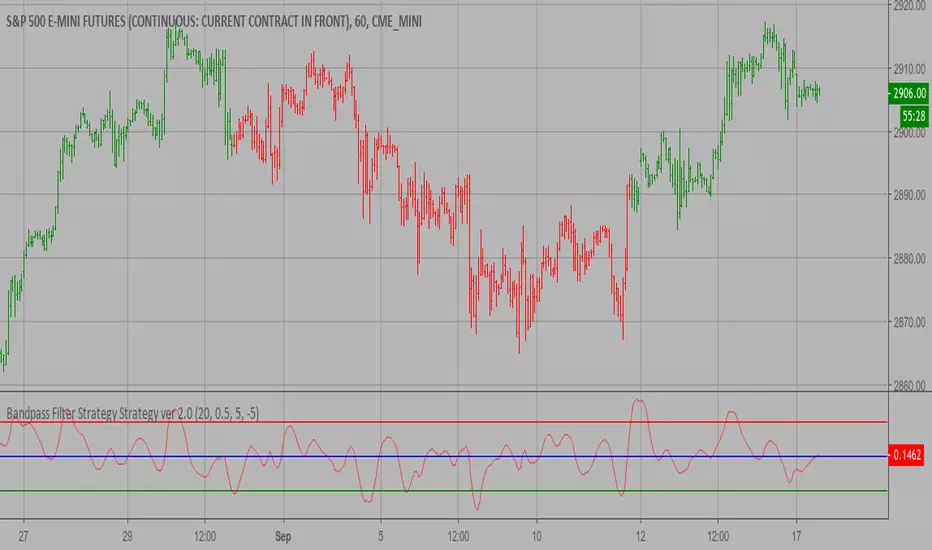
Bandpass Filter Strategy ver 2.0 The related article is copyrighted material from
Stocks & Commodities Mar 2010
You can use in the xPrice any series: Open, High, Low, Close, HL2, HLC3, OHLC4 and ect...
WARNING:
- This script to change bars colors.
BitcoinNinjas 'Ninja Signals' Buy/Sell Alert Trading Script v3.0Bitcoin Ninjas 'Ninja Signals' Buy/Sell Alerts & Backtesting TradingView Script v3.0
(for Cryptocurrencies, Forex, GunBot, ProfitTrailer, automatic trading software, and more)
This is version 3 of our popular Ninja Signals trading script, which is similar to version 2, but with a new hard-coded calibration (resolution) setting that automatically matches candle size (period) to ensure that no repainting occurs regardless of the number or type of indicators and filters traders apply when configuring the script.
'Ninja Signals' v3.0 (SCRIPT)
'Ninja Signals' v3.0 (STRATEGY)
'Ninja Signals' v2.0 (SCRIPT)
'Ninja Signals' v2.0 (STRATEGY)
'Ninja Signals' v1.0 (SCRIPT)
'Ninja Signals' v1.0 (STRATEGY)
-Allows users to easily set automated buy and sell alerts on TradingView for use with automatic and manual trading of cryptocurrencies, Forex securities, and more (alerts are compatible with automatic trading software such as GunBot, ProfitTrailer, and more).
-Synthesizes many powerful indicators [e.g. Relative Strength Index (RSI), stochastic RSI, Money Flow Index (MFI), Moving Average Convergence Divergence (MACD), etc.) into one super script to generate very precise buy and sell signals in almost any market condition.
-Buy arrows (blue) and sell arrows (red) can be changed or hidden for ease of viewing.
-No lag EMA trendline featuring trend-reversal color-coding (white uptrend, black downtrend).
-Adjustable ‘calibration’ setting allows users to customize the script to work for any currency or security available through TradingView, on any exchange, simply by adjusting a number.
-Complete with backtesting strategy version of script which allows users to test various buy and sell strategies based on the alerts the script generates (see info and screenshots below).
-Backtesting strategy incorporates a user-defined adjustable date range, so users can estimate the script’s performance over specific periods of time, such as the last day, week, or month.
-Backtesting strategy utilizes a minimum protective gain setting to help you never sell for a loss. Simply adjust your minimum profit (%) per trade, and the test results will update.
-Backtesting strategy allows for pyramid buying to test various average down / double up buying strategies. Simply adjust the number of pyramid buys and the quantity of each buy.
- Free 7-day trial available for TradingView users who join our free BitcoinNinjas community.
-Free 24/7 support via BitcoinNinjas Telegram GunBot support group with script purchase.
-Fully compatible with GunBot automatic trading software (TradingView plugin is required).
-Special discount available for traders who purchase GunBot automatic trading software and the GunBot TradingView plugin from BitcoinNinjas, allowing for fully automatic trading.
-Contact us via Email or Telegram for more information, to request additional / custom screenshots, or to start your free trial.
DISCLAIMER: By using our BitcoinNinjas ‘Ninja Signals’ planning script, you agree to the BitcoinNinjas 'Terms of Use', as presented on our website (www.BitcoinNinjas.org) and as stated here. No sharing, copying, reselling, modifying, or any other forms of use are authorized for our documents, script / strategy, and the information published with them. This informational planning script / strategy is strictly for individual use and educational purposes only. This is not financial or investment advice. Investments are always made at your own risk and are based on your personal judgement. Bitcoin Ninjas is not responsible for any losses you may incur. Please invest wisely.

Free Log-Normal Bollinger Bands for CryptoBollinger Bands don't work on crypto currency, this is because crypto is so volatile it makes exponential growth a more obvious factor. Bollinger bands assume price will form a normal distribution around the mean which is WRONG, as prices increase in an exponential way, and the price will never fall below $0.
This is a bollinger band based around a log-normal distribution. Which is how prices actually behave.
Use this one instead. It's free.

Coinopi_ma_stratgy[babelii]Best Oscillator for trade cryptocurrency
- color bar
- Very easy to use
- Highest profit
-------------------
eth/btc
zrx/btc
Coinopi_Trendstrategy_[babelii]Best Oscillator for trade cryptocurrency
- Very easy to use
- Highest profit
Coinopi_TmaStrategy_[babelii]Best Indicator for trade cryptocurrency
- Very easy to use
- Highest profit
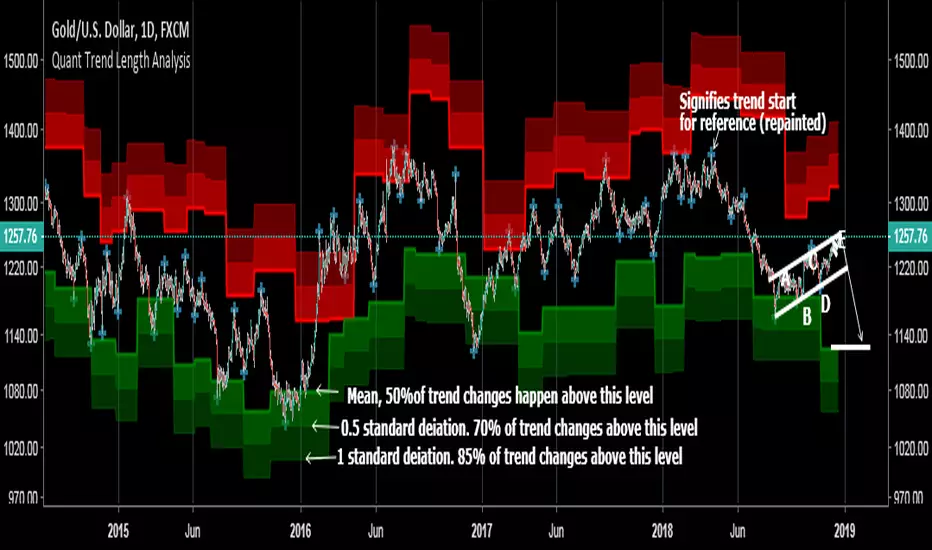
Statistical Trend Length Analysis (Quant indicator)This is the only Quantitative type indicator I can find on TradingView (which means it uses automated back testing to determine probability in a mathematical way), although there could be some I just haven't seen them.
This indicator back-tests ALL of the data, calculates the length of all past trends, and does a statistical analysis of trend changes at different levels. The more recent data is more accurate as it learns as the indicator goes along.
These levels can be used in regression to the mean trading, as it gives you an idea of the statistical likeliness of a trend change or pullback occurring in each zone. An average trend length is a very good point to enter when trading a pullback within a trend, although without a complex analysis like this it would be impossible to determine where that is.
PM me for access, and more details on strategies that can be implemented using this indicator.
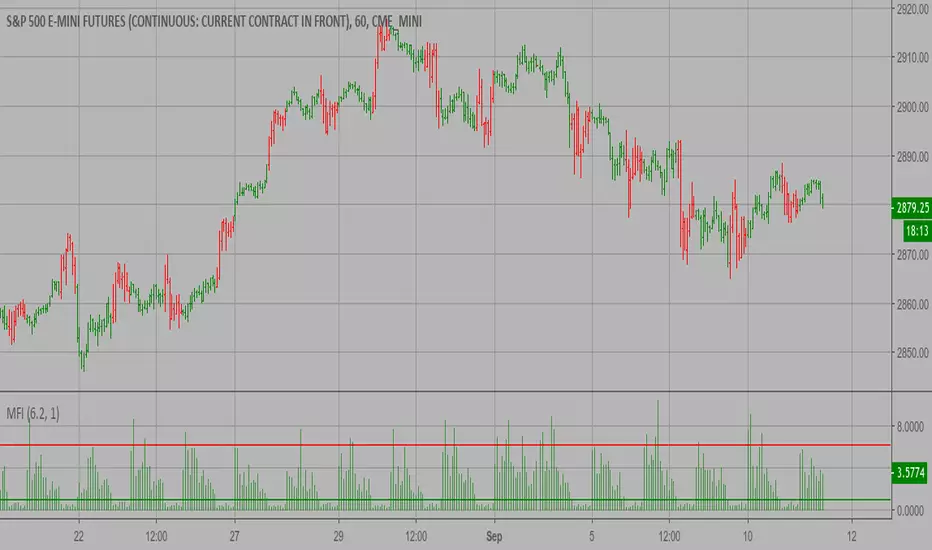
Market Facilitation Index (MFI) Strategy The Market Facilitation Index is an indicator that relates price range to
volume and measures the efficency of price movement. Use the indicator to
determine if the market is trending. If the Market Facilitation Index increased,
then the market is facilitating trade and is more efficient, implying that the
market is trending. If the Market Facilitation Index decreased, then the market
is becoming less efficient, which may indicate a trading range is developing that
may be a trend reversal.
WARNING:
- This script to change bars colors.
Keltner Channel Strategy The Keltner Channel, a classic indicator
of technical analysis developed by Chester Keltner in 1960.
The indicator is a bit like Bollinger Bands and Envelopes.
WARNING:
- This script to change bars colors.

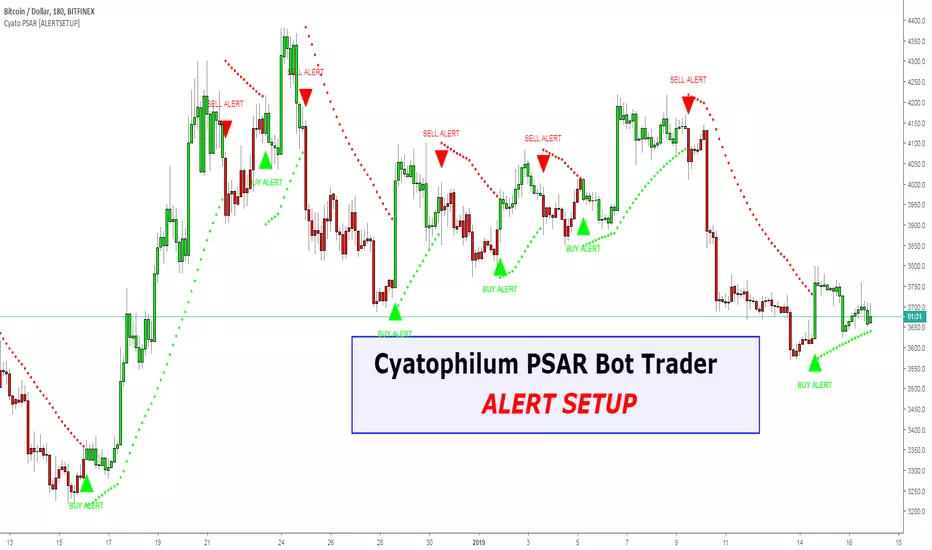
Cyatophilum Trend IndicatorHOW TO USE
Step 1 : Adjust the Trend Parameter to the most profitable number.
Step 2 : Create Automatic Alerts for Buy (L) and Sell (S) signals.
BONUS :
Trend horizontal Line: Use this line to avoid risky trades.
Get This Indicator Today!
Purchase at blockchainfiesta.com
SAMPLE USE CASES
BTCUSD 1 D
BTCUSD 4 h
ETHUSD 1 D
ETH/BTC 1 D
Get This Indicator Today!
Purchase at blockchainfiesta.com
View a video tutorial on how to use this indicator at the link above.
Have Fun !
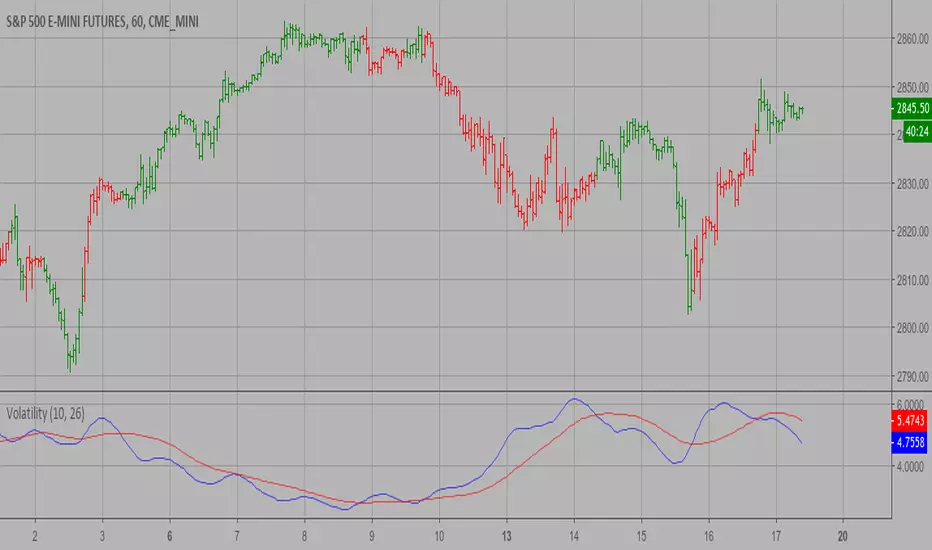
(JS) S&P 500 Volatility Oscillator For OptionsThe idea for this started here: www.tradingview.com with the user @dime
This should only be used on SPX or SPY (though you could use it on other things for correlation I suppose) given that the instrument used to create this calculation is derived from the S&P 500 (thank you VIX). There's a lot of moving parts here though, so allow me to explain...
First: The main signal is when Implied Volatility (from VIX) drops beneath Historical Volatility - which is what you want to see so you aren't purchasing a ton of premium on long options. Green and above 0 means that IV% has dropped lower than Historical Volatility. (this signal, for example, would suggest using a Long Call or Put depending on your sentiment)
Second: The green line running underneath zero is the bottom portion of the "Average True Range" derived from the values used to create the oscillator. the closer the bottom histogram is to the green line, the more "normal" IV% is. Obviously, if this gets far away from the line then it could be setting up nicely to short options and sell the IV premium to someone else. (this signal, for example, would suggest using something like a Bull Put Spread)
Third: The red background along with the white line that drops down below zero signals when (and how far) the IV% from 3 months out (from VIX3M) is less than the current IV%. This would signal the current environment has IV way too high, a signal to short options once again (and don't take any long option positions!).
Tried to make this simple, yet effective. If you trade options on SPX, SPY, even ES1! futures - this is a tool tailored specifically for you! As I said before, if you want you can use it for correlation on other securities. Any other ideas or suggestions surrounding this, please let me know! Enjoy!

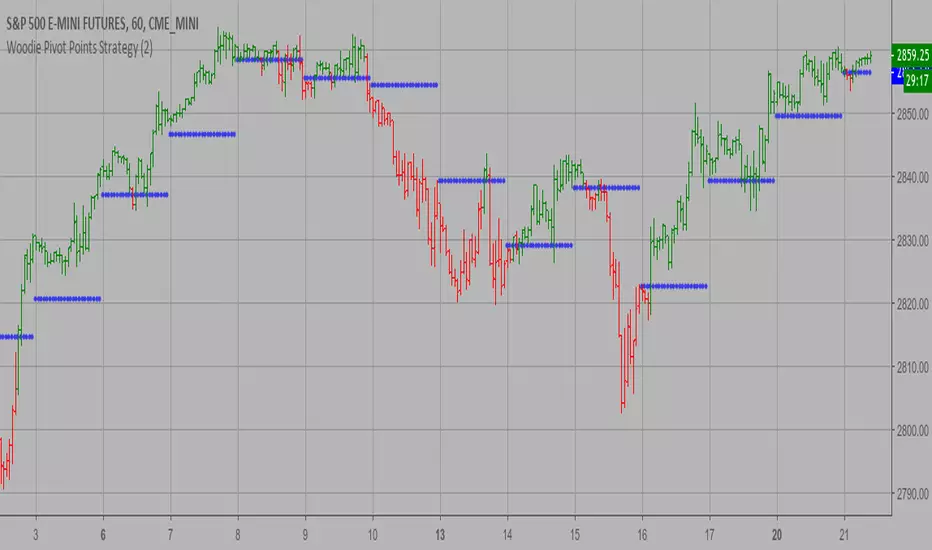
Woodie Pivot Points Strategy Simply input the vales of the high, low and closing price of the previous
period to calculate the Woodie pivot point and the associated resistance
and support levels for the present period.
WARNING:
- This script to change bars colors.
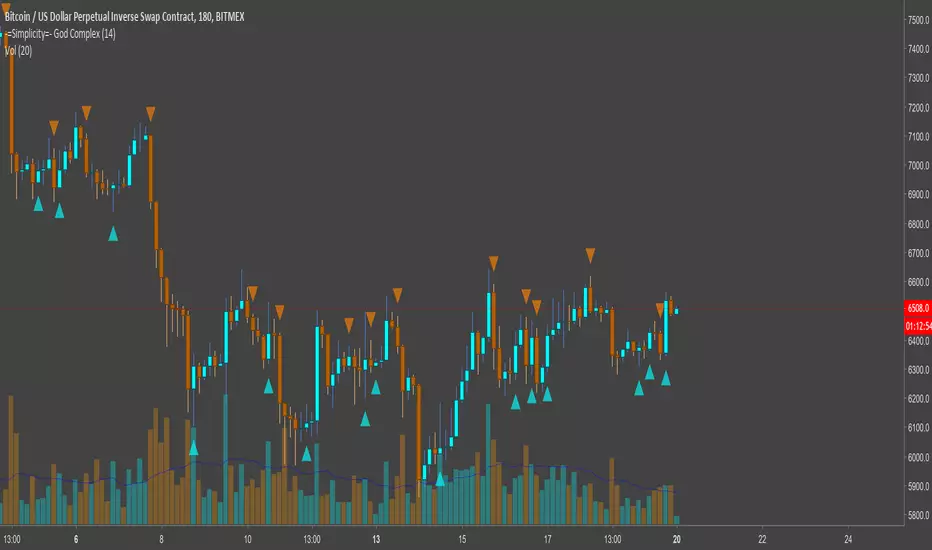
-=Simplicity=- God ComplexMaking money is simple when you wield untold power
-=Simplicity=- God Complex is a non-repaint, set-and-forget indicator for identifying optimum times to enter and exit the market, with both longs and shorts.
Applicable to any asset-type, market, candle type and timeframe, God Complex is a quintessential tool for both new and veteran traders.
With only one variable to change it will take a minimal amount of time to find a value that suits you. As a rule of thumb, the higher the value the less it will fire signals, but the safer those signals will be.
You can also opt to only enable 'Long' or 'Short' signals on the chart. This is meaningful when trading leverage or margin along trend that you are able to identify.
This can be used as a guide for manual trading, but is best utilized as a tool for automating trades so that you don't miss out on any market activity.
This is a link to a document elucidating a little more on the script: docs.google.com
---------------------
Here are a few charts showing how the script performs against them. Enjoy.
Below is a chart depicting XBTUSD (BitMEX) on a 30M timeframe. Both longs and shorts are enabled and the variable is set to a value of 144.
Below here we have a chart for BNBBTC (Binance) on a 1HR timeframe with variable set to a value of 14 on Heikin Ashi candles. Large orange arrows are shorts and smaller blue arrows are closing shorts. There's a clear downtrend, hence we're only shorting.
This is EOSBTC (Bitfinex) on a 2HR timeframe with a variable set to 7 on Renko charts. Small orange arrows are exiting a long position and large blue arrows are entering a long position. The uptrend is obvious to see, so that's why we're mainly displaying longs here.
Not that I reccommend anyone to trade such a small timeframe, but this is for all you scalpers out there. XBTUSD (BitMEX) on a 1M timeframe with a variable value of 233. Both longs and shorts are enabled for this chart. Normal bar candles apply.
Finally, this is ARKBTC (BitTrex) on a 2HR timeframe against a 500R chart with a variable of 377. Only shorts are enabled, as we're in a downtrend.
---------------------
Please contact @overttherainbow on Telegram if you'd like to discuss anything, alternatively reach out to me here (although Telegram is better for a quick response; I'll be around 9AM-11PM GMT)
Volatility Strategy The Volatility function measures the market volatility by plotting a
smoothed average of the True Range. It returns an average of the TrueRange
over a specific number of bars, giving higher weight to the TrueRange of
the most recent bar.
WARNING:
- This script to change bars colors.
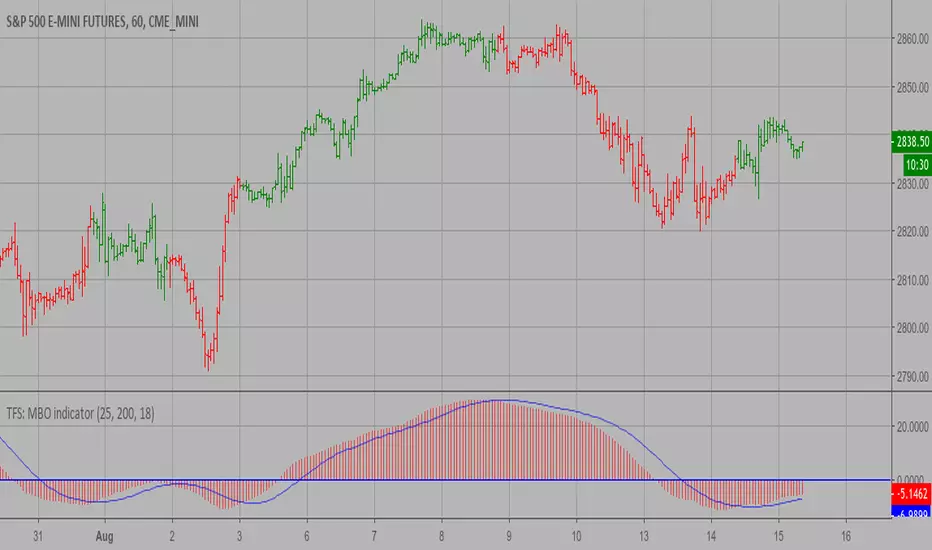
TFS: MBO Strategy MBO indicator is the third component of TFS trading system. This indicator
was developed by Bryan Strain and Mark Whitley.
The idea of MBO is similar to moving average convergence/divergence (MACD)
indicator. It is calculated by subtracting the 200-day moving average from
the 25-day moving average.
WARNING:
- This script to change bars colors.