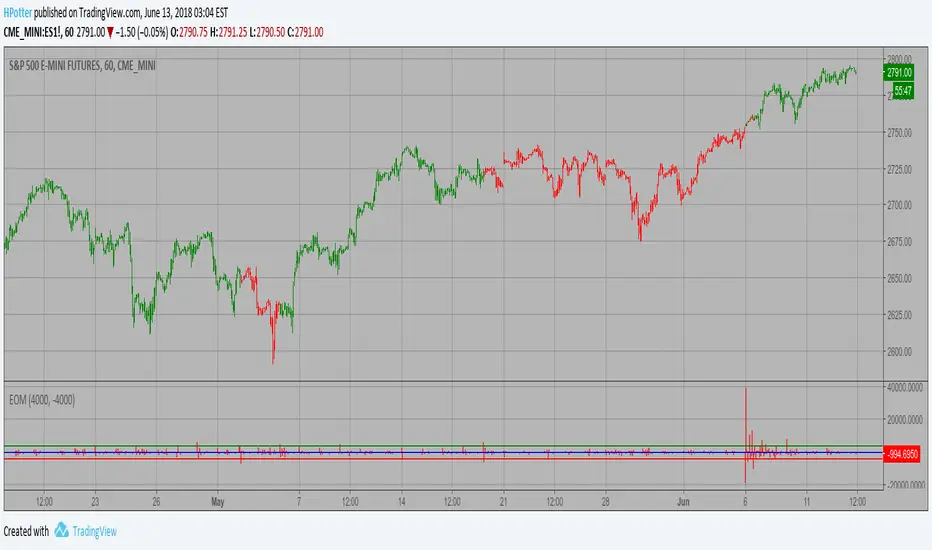
Ease of Movement (EOM) Strategy This indicator gauges the magnitude of price and volume movement.
The indicator returns both positive and negative values where a
positive value means the market has moved up from yesterday's value
and a negative value means the market has moved down. A large positive
or large negative value indicates a large move in price and/or lighter
volume. A small positive or small negative value indicates a small move
in price and/or heavier volume.
A positive or negative numeric value. A positive value means the market
has moved up from yesterday's value, whereas, a negative value means the
market has moved down.
WARNING:
- This script to change bars colors.
Strategy!
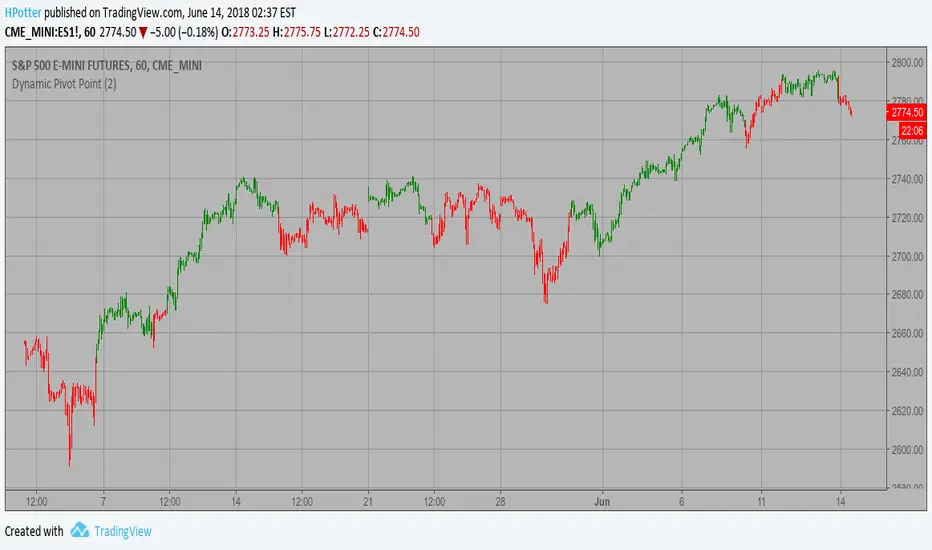
Dynamic Pivot Point Strategy This Pivot points is calculated on the current day.
Pivot points simply took the high, low, and closing price from the previous period and
divided by 3 to find the pivot. From this pivot, traders would then base their
calculations for three support, and three resistance levels. The calculation for the most
basic flavor of pivot points, known as ‘floor-trader pivots’, along with their support and
resistance levels.
WARNING:
- This script to change bars colors.
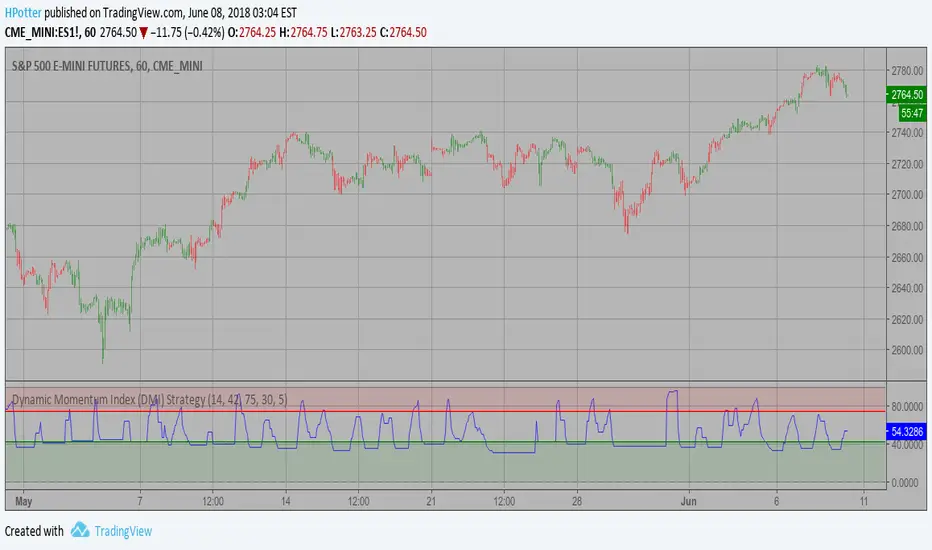
Dynamic Momentum Index (DMI) Strategy This indicator plots Dynamic Momentum Index indicator. The Dynamic Momentum
Index (DMI) was developed by Tushar Chande and Stanley Kroll. The indicator
is covered in detail in their book The New Technical Trader.
The DMI is identical to Welles Wilder`s Relative Strength Index except the
number of periods is variable rather than fixed. The variability of the time
periods used in the DMI is controlled by the recent volatility of prices.
The more volatile the prices, the more sensitive the DMI is to price changes.
In other words, the DMI will use more time periods during quiet markets, and
less during active markets. The maximum time periods the DMI can reach is 30
and the minimum is 3. This calculation method is similar to the Variable
Moving Average, also developed by Tushar Chande.
The advantage of using a variable length time period when calculating the RSI
is that it overcomes the negative effects of smoothing, which often obscure short-term moves.
The volatility index used in controlling the time periods in the DMI is based
on a calculation using a five period standard deviation and a ten period average
of the standard deviation.
WARNING:
- This script to change bars colors.
Multiple Ema 8/13/21/55 by melihgulerIn one graph, 4 different periods include EMA (8/13/21/55). It is not recommended for short-term investments. You can get efficient results using at least 4 hours chart.
It is not an investment recommendation. Your use is at your own risk.


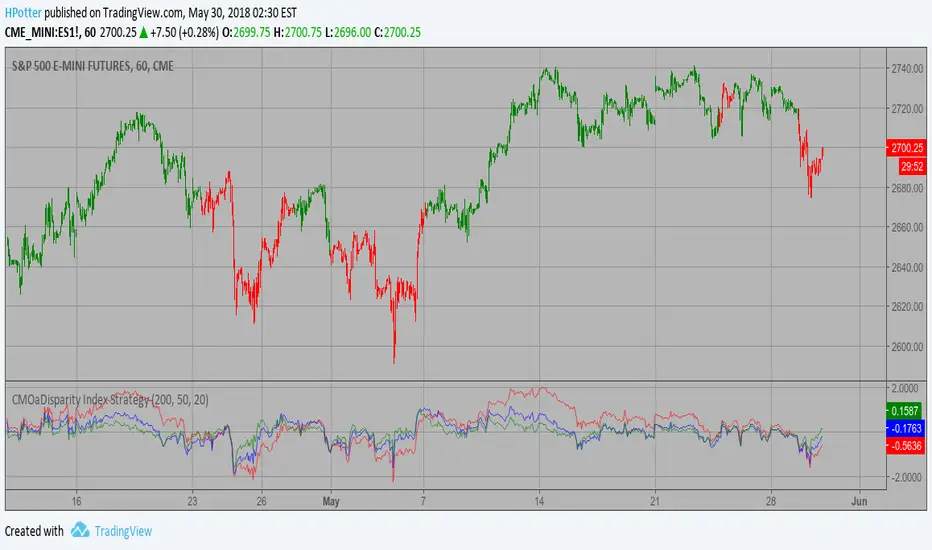
CMOaDisparity Index Strategy The related article is copyrighted material from Stocks & Commodities Dec 2009
My strategy modification.
WARNING:
- This script to change bars colors.
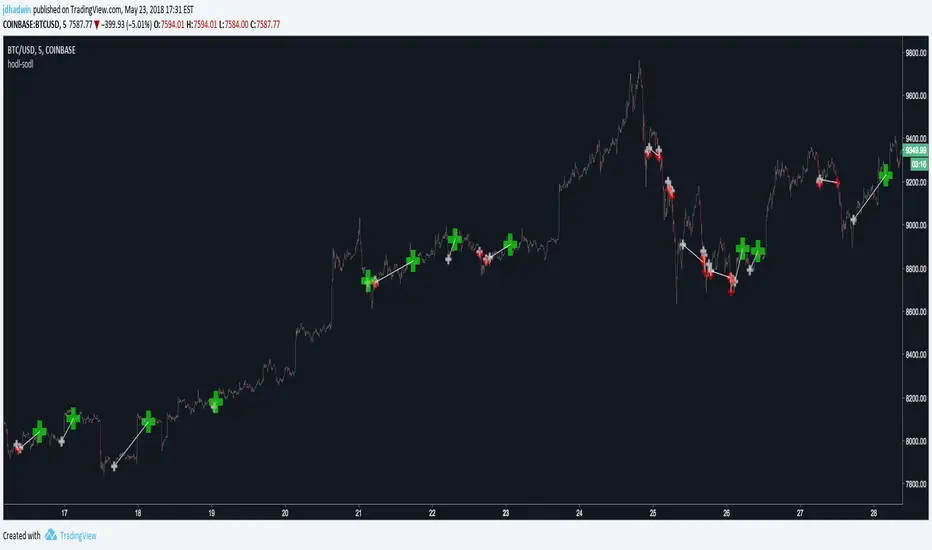
AutoView - Hodl to SodlWrite your own strategy and use Hodl to Sodl to send Alerts for when to buy & sell, and automatically plot your anticipated buys/sells to the chart. A must have for AutoView users. Requires Pine Script coding. Not compatible with "Strategy Tester" tab and "Paper Trading" tab in TradingView.
Hodl-Sodl itself is not a strategy. It is a framework for building AutoView strategies. For demonstration purposes, the image featured with this script shows an example of a very simple CCI strategy (and not a very good one), but you would presumably replace that with your own ideas. If you'd like a little help plugging in your own strategy, contact jdhadwin for custom coding.
CCI Colored Candles / Bars w/ HistogramColor of your candles matches your CCI with Histogram indicator and trend line. CCI EMA or SMA based option, traditional or modern formula calculation options ect. Can change Length, source, Trigger Lines, colors of candles and histogram and more
The CCI compares the current price to an average price over a period of time. The indicator fluctuates above or below zero, moving into positive or negative territory. While most values, approximately 75%, will fall between -100 and +100, about 25% of the values will fall outside this range, indicating a lot of weakness or strength in the price movement.
A basic CCI strategy is used to track the CCI for movement above +100, which generates buy signals, and movements below -100, which generates sell or short trade signals. Investors may only wish to take the buy signals, exit when the sell signals occur, and then re-invest when the buy signal occurs again.
The CCI compares the current price to an average price over a period of time. The indicator fluctuates above or below zero, moving into positive or negative territory. While most values, approximately 75%, will fall between -100 and +100, about 25% of the values will fall outside this range, indicating a lot of weakness or strength in the price movement.
When the CCI is above +100, this means the price is well above the average price as measured by the indicator. When the indicator is below -100, the price is well below the average price.
1 CCI strategy is used to track the CCI for movement above +100, which generates buy signals, and movements below -100, which generates sell or short trade signals. Investors may only wish to take the buy signals, exit when the sell signals occur, and then re-invest when the buy signal occurs again.
Long-term chart is used to establish the dominant trend, short-term chart establishing pullbacks and entry points into that trend. A multiple timeframe strategy is commonly used by more active traders and can even be used for day trading, as the "long term" and "short term" is relative to how long a trader wants their positions to last.
When the CCI moves above +100 on your longer-term chart, this indicates an upward trend, and you only watch for buy signals on the shorter-term chart. The trend is considered up until the longer-term CCI dips below -100.
When using a daily chart as the shorter timeframe, traders often buy when the CCI dips below -100 and then rallies back above -100. It would then be prudent to exit the trade once the CCI moves above +100 and then drops back below +100. Alternatively, if the trend on the longer-term CCI turns down, that indicates a sell signal to exit all long positions.
When the CCI is below -100 on the longer-term chart, only take short sale signals on the shorter-term chart. The downtrend is in effect until the longer-term CCI rallies above +100. The chart indicates that you should take a short trade when the CCI rallies above +100 and then drops back below +100 on the shorter-term chart. Traders would then exit the short trade once the CCI moves below -100 and then rallies back above -100. Alternatively, if the trend on the longer-term CCI turns up, exit all short positions.
Make the strategy more stringent by only taking long positions on the shorter time frame when the longer-term CCI is above +100. This will reduce the number of signals, but will ensure the overall trend is very strong.
Entry and exit rules on the shorter timeframe can also be adjusted. if the longer-term trend is up, you may allow the CCI on the shorter-term chart to dip below -100 and then rally back above zero (instead of -100) before buying. This will likely result in a paying a higher price, but offers more assurance that the short-term pullback is over and the longer-term trend is resuming.

SS EMA / SMA RibbonColor Change if above or below EMAs / Ribbon
StokedStocks EMA / SMA Ribbon 9 20 25 30 35 40 45 50 55 60 65 70 75 80 85 90 95 100 200
EMAs Color Change if above or below EMAs / Ribbon
Lime : Uptrending; Long Bias
Green : Dip Buy / ReEntry or downtrend reversal warning
Red : Downtrend. Short Bias
Maroon : Short Reentry (sell the peak) or uptrend reversal warning
1st strategy Long when Price crosses above all EMAs
2nd strategy if late is buy first or second pullback to 9 or 20 EMA which are the 1st and 2nd ribbon lines (in an uptrend)
3rd strategy is Short once price crosses UNDER all EMAs
Use Trailing stop % once long or short
Better when shorter time frames line up with Longer time Frames for less risk EXAMPLE Above all EMAs on 5min chart and on Daily Chart

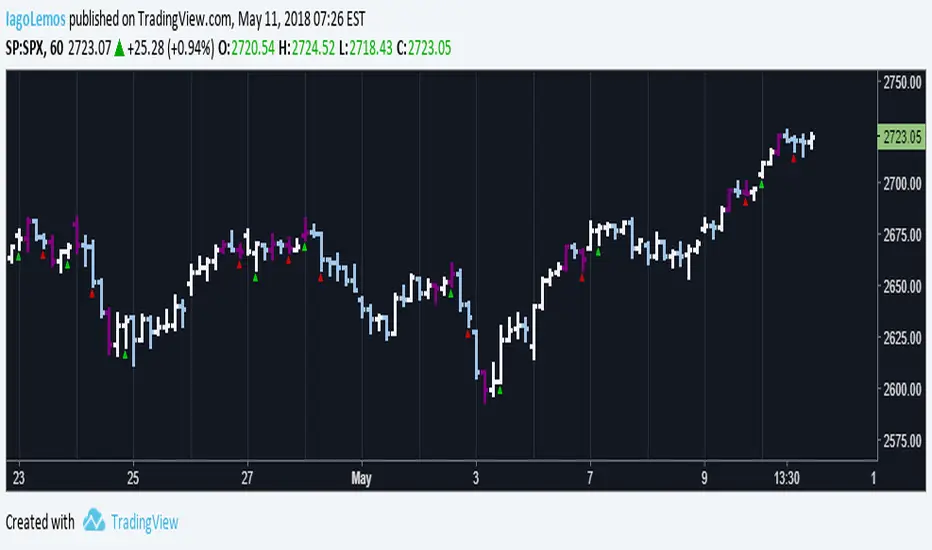
John Carter's Buy/Sell Scalper V2After a couple adjustments, double signals are now being ignore.
Here's how this script works:
Based entirely on a John Carter scalping setup, a candle will be painted purple if the next two closes are in a opposite direction of the past trend.
Green triangles indicates that the reversal is bullish, red triangles indicates that the reversal is bearish. Both are entry/exit points if you want to follow this set up.
Personally, I find this setup to work best in trending days, but it does a great job on choppy days if you use it as a confirmation.
TDI Complementary Overlay by YardleyRosetteMay 2018, Traders Dynamic Index Overlay Indicator ( Free Indicator )
The Full 'TDI' Complementary Overlay for all securities. FOREX, BITCOIN (CRYPTOCURRENCIES), STOCKS, etc.
This is the overlay of Traders Dynamic Index updated in my knowledge to optimal settings.
Added an "Xtreme" Phaser for noticing major moving average/trendline breakouts.
Added representation of Overbought/Sold level lines.
Moving Averages visually reordered.
Settings I found of moving averages to correlate the best with Traders Dynamic Index all in one overlay indicator.
Using KK_Traders Dynamic Index_Bar Highlighting which is the closest to Traders Dynamic Index Pro on MT4, I set the best alignment to Traders Dynamic Index with potential target price points as an overlay indicator representing Traders Dynamic Index components and a level as moving averages on price chart.
"Phaser", as in phase changing; shifting direction.
Especially for those who do not have TV PRO.
______________
El Índice Dinámico de Comerciantes encimadas a gráficas de precio.
En especial para quienes solo pueden usar 3 indicadores.
_____________

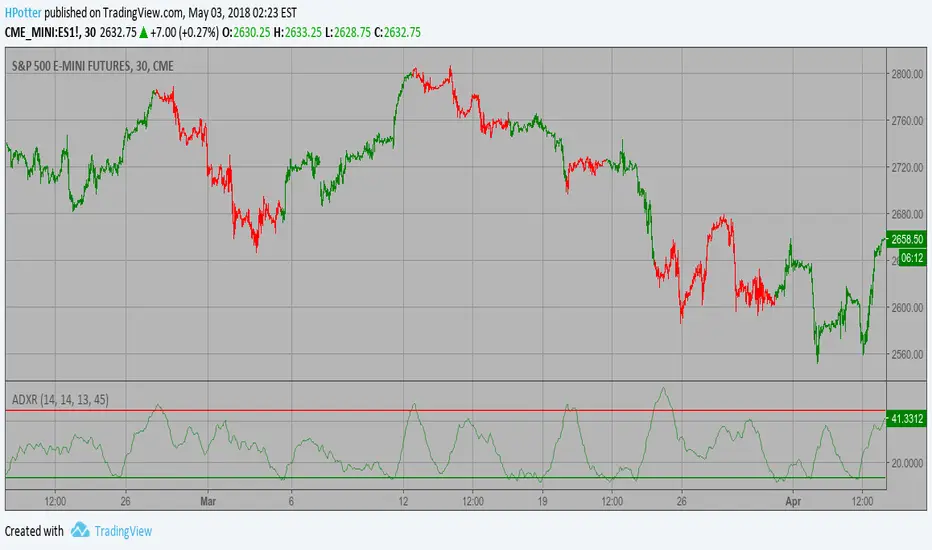
Average Directional Movement Index Rating Strategy The Average Directional Movement Index Rating (ADXR) measures the strength
of the Average Directional Movement Index (ADX). It's calculated by taking
the average of the current ADX and the ADX from one time period before
(time periods can vary, but the most typical period used is 14 days).
Like the ADX, the ADXR ranges from values of 0 to 100 and reflects strengthening
and weakening trends. However, because it represents an average of ADX, values
don't fluctuate as dramatically and some analysts believe the indicator helps
better display trends in volatile markets.
WARNING:
- This script to change bars colors.
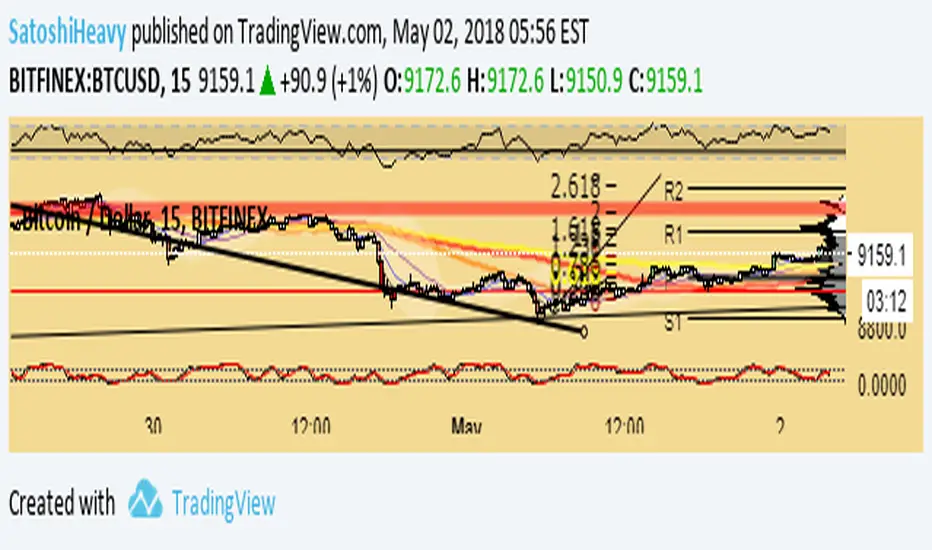
All In One Moving Average by SatoshiHeavy5EMA
13WMA
21SMA
55SMA
100SMA
200EMA
13WMA is the signal, look for 2-6H1 closes or 2-3H4 closes on or above to enter a trade Long
you want the opposite to the downside to short.
when used with other level analysis such as Fibonacci, Trend lines, and horizontal supports/resistances
Wave & Trend Autoview Advanced Indicator & AlertsWave & Trend Autoview Advanced Indicator & Alerts - Version 1.0
Overview
This Lazybear inspired indicator is a complex and deeply customisable wave based oscillator that allows for full customisation of parameters and 3 toggleable strategies to allow the user to shape their trading methods to their preferences. The indicator was built for use with Autoview using all functionality or in conjunction with Profit Trailer 2.0 to handle the buying side of logic at an even more advanced level. The creation of this was fuelled by the need to create a cheaper alternative to those that charge monthly for similar signals, which I am deeply against.
Features
Wave Based Buying - those familiar with buying based with RSI based approaches will feel very comfortable with this signal as it detects areas of deeply oversold / overbought and buys on the reversal
Fully customisation - All parameters are open for customising to allow the trader to build their own strategy and adapt from market to market
3 Built In Signal Strategies - Clearly labelled in the parameters as A/B/C are the built in strategies that all have completely unique buying / selling logic and are based on different risk / reward levels. Include all 3 or focus on one or two to build your perfect strategy
Downtrend Detection - This indicator has an in-built downtrend detection that is modifiable in the parameters meaning no more deep bags - the strategies will always try to buy on the uptrend.
Access
48H Trial Period By Request
Full Access is 0.15 ETH , one time fee for full unlimited access to the indicator and future updates but also my well received support and mentoring on my work afterwards to help you built a perfect strategy.
Previous owners of my work get 50% off the price for being one of my supporters.

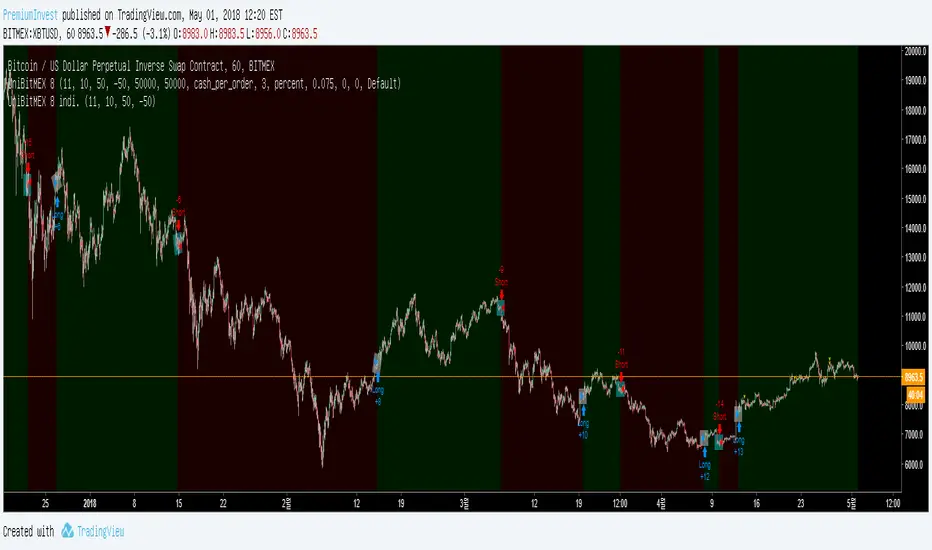
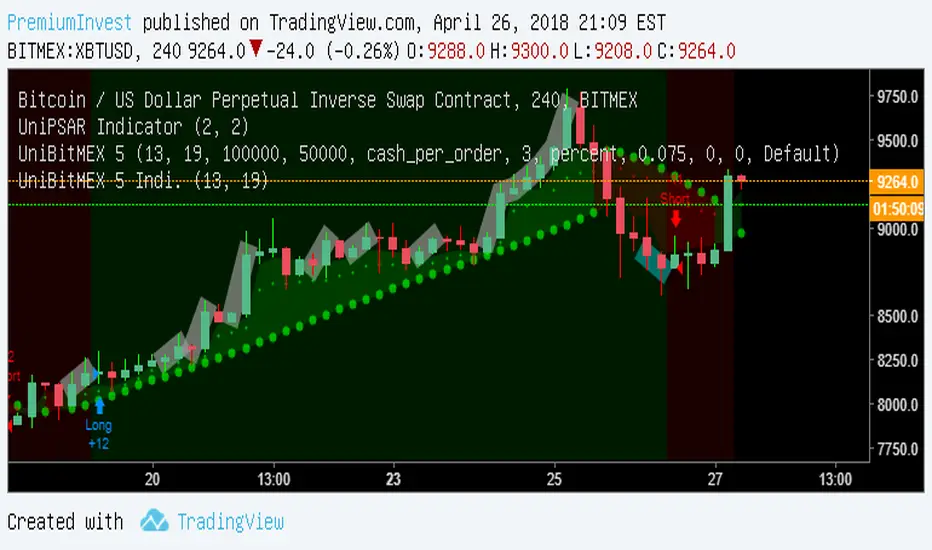
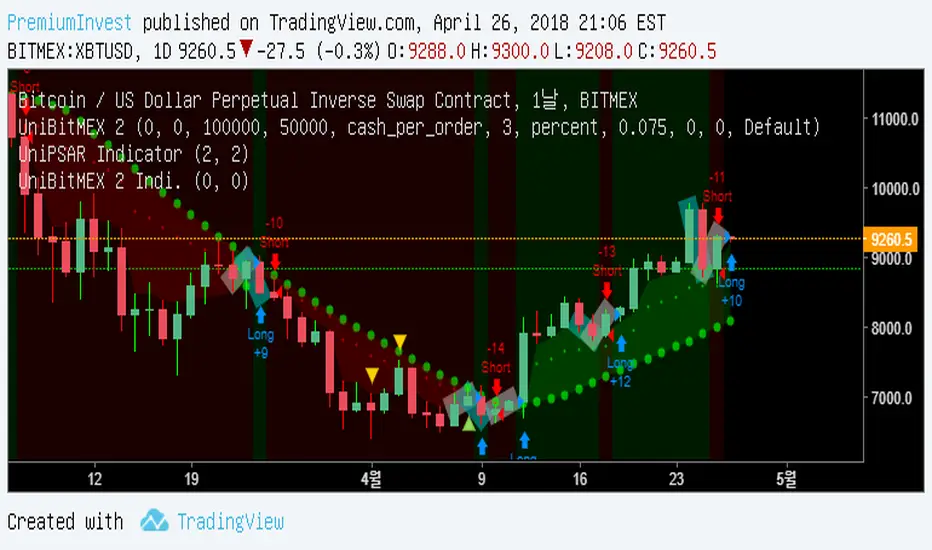
UniBitMEX 7 Indi.< Strat. Indicator for alert>
UniBitMEX 7 Indicator : Once Per Bar Close (봉 닫힐때 한번)
UniBitMEX 6 Indicator : Once Per Bar Close (봉 닫힐때 한번)
UniBitMEX 5 Indicator : Once Per Bar Close (봉 닫힐때 한번)
UniBitMEX 4 Indicator : Once Per Bar (봉마다 한번)
UniBitMEX 3 Indicator : Once Per Bar Close (봉 닫힐때 한번)
UniBitMEX 2 Indicator : Once Per Bar Close (봉 닫힐때 한번)
UniBitMEX Indicator : Once Per Bar Close (봉 닫힐때 한번)

UniBitMEX 6 Indi.< Strat. Indicator for alert>
UniBitMEX 7 Indicator : Once Per Bar Close (봉 닫힐때 한번)
UniBitMEX 6 Indicator : Once Per Bar Close (봉 닫힐때 한번)
UniBitMEX 5 Indicator : Once Per Bar Close (봉 닫힐때 한번)
UniBitMEX 4 Indicator : Once Per Bar (봉마다 한번)
UniBitMEX 3 Indicator : Once Per Bar Close (봉 닫힐때 한번)
UniBitMEX 2 Indicator : Once Per Bar Close (봉 닫힐때 한번)
UniBitMEX Indicator : Once Per Bar Close (봉 닫힐때 한번)

UniBitMEX 5 Indi.< Strat. Indicator for alert>
UniBitMEX 7 Indicator : Once Per Bar Close (봉 닫힐때 한번)
UniBitMEX 6 Indicator : Once Per Bar Close (봉 닫힐때 한번)
UniBitMEX 5 Indicator : Once Per Bar Close (봉 닫힐때 한번)
UniBitMEX 4 Indicator : Once Per Bar (봉마다 한번)
UniBitMEX 3 Indicator : Once Per Bar Close (봉 닫힐때 한번)
UniBitMEX 2 Indicator : Once Per Bar Close (봉 닫힐때 한번)
UniBitMEX Indicator : Once Per Bar Close (봉 닫힐때 한번)
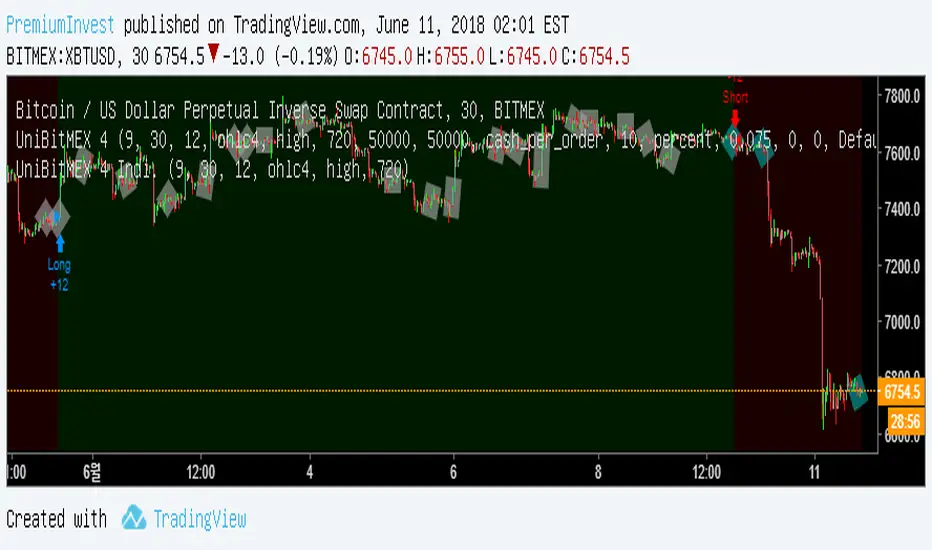
UniBitMEX 4 Indi.< Strat. Indicator for alert>
UniBitMEX 7 Indicator : Once Per Bar Close (봉 닫힐때 한번)
UniBitMEX 6 Indicator : Once Per Bar Close (봉 닫힐때 한번)
UniBitMEX 5 Indicator : Once Per Bar Close (봉 닫힐때 한번)
UniBitMEX 4 Indicator : Once Per Bar (봉마다 한번)
UniBitMEX 3 Indicator : Once Per Bar Close (봉 닫힐때 한번)
UniBitMEX 2 Indicator : Once Per Bar Close (봉 닫힐때 한번)
UniBitMEX Indicator : Once Per Bar Close (봉 닫힐때 한번)
UniBitMEX 3 Indi.< Strat. Indicator for alert>
UniBitMEX 7 Indicator : Once Per Bar Close (봉 닫힐때 한번)
UniBitMEX 6 Indicator : Once Per Bar Close (봉 닫힐때 한번)
UniBitMEX 5 Indicator : Once Per Bar Close (봉 닫힐때 한번)
UniBitMEX 4 Indicator : Once Per Bar (봉마다 한번)
UniBitMEX 3 Indicator : Once Per Bar Close (봉 닫힐때 한번)
UniBitMEX 2 Indicator : Once Per Bar Close (봉 닫힐때 한번)
UniBitMEX Indicator : Once Per Bar Close (봉 닫힐때 한번)

UniBitMEX 2 Indi.< Strat. Indicator for alert>
UniBitMEX 7 Indicator : Once Per Bar Close (봉 닫힐때 한번)
UniBitMEX 6 Indicator : Once Per Bar Close (봉 닫힐때 한번)
UniBitMEX 5 Indicator : Once Per Bar Close (봉 닫힐때 한번)
UniBitMEX 4 Indicator : Once Per Bar (봉마다 한번)
UniBitMEX 3 Indicator : Once Per Bar Close (봉 닫힐때 한번)
UniBitMEX 2 Indicator : Once Per Bar Close (봉 닫힐때 한번)
UniBitMEX Indicator : Once Per Bar Close (봉 닫힐때 한번)
UniBitMEX Indi.< Strat. Indicator for alert>
UniBitMEX 7 Indicator : Once Per Bar Close (봉 닫힐때 한번)
UniBitMEX 6 Indicator : Once Per Bar Close (봉 닫힐때 한번)
UniBitMEX 5 Indicator : Once Per Bar Close (봉 닫힐때 한번)
UniBitMEX 4 Indicator : Once Per Bar (봉마다 한번)
UniBitMEX 3 Indicator : Once Per Bar Close (봉 닫힐때 한번)
UniBitMEX 2 Indicator : Once Per Bar Close (봉 닫힐때 한번)
UniBitMEX Indicator : Once Per Bar Close (봉 닫힐때 한번)
