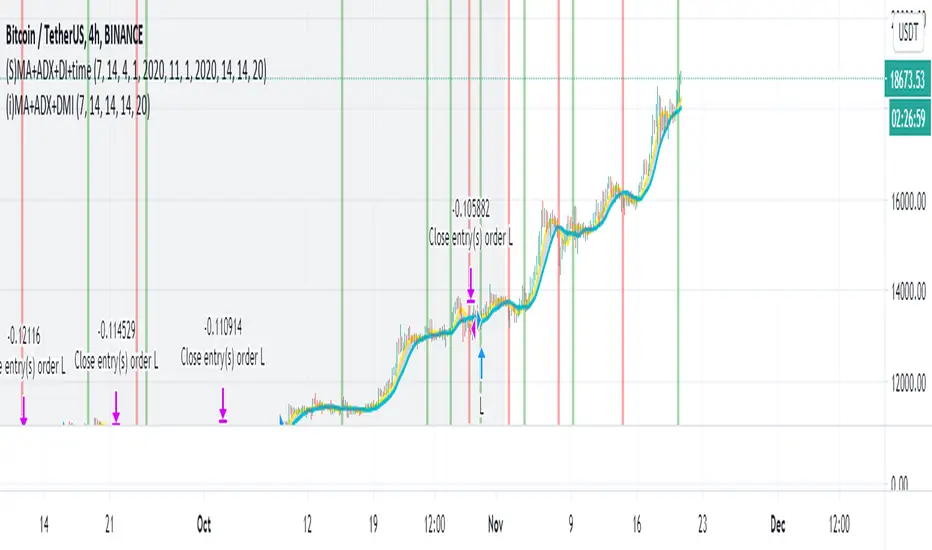
Simple Moving Average + ADX + DMI + Time Range Test
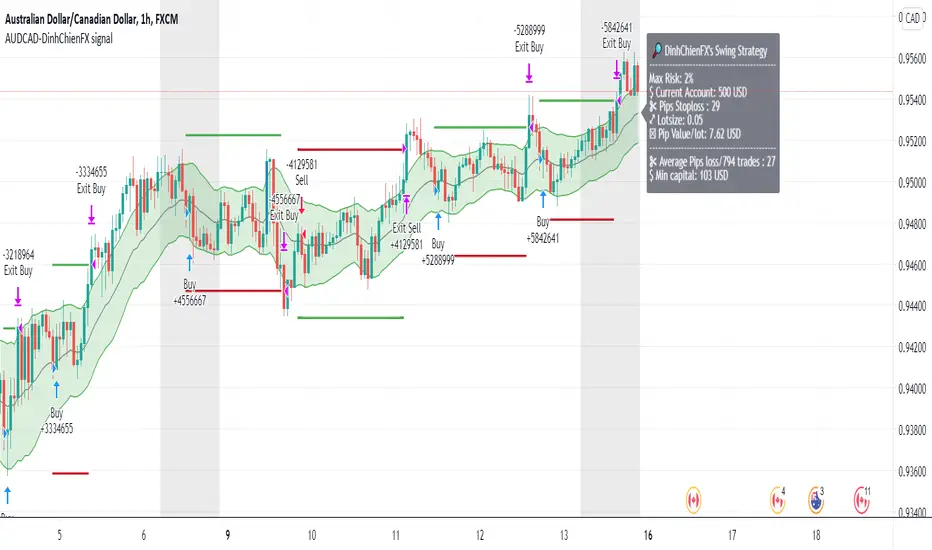
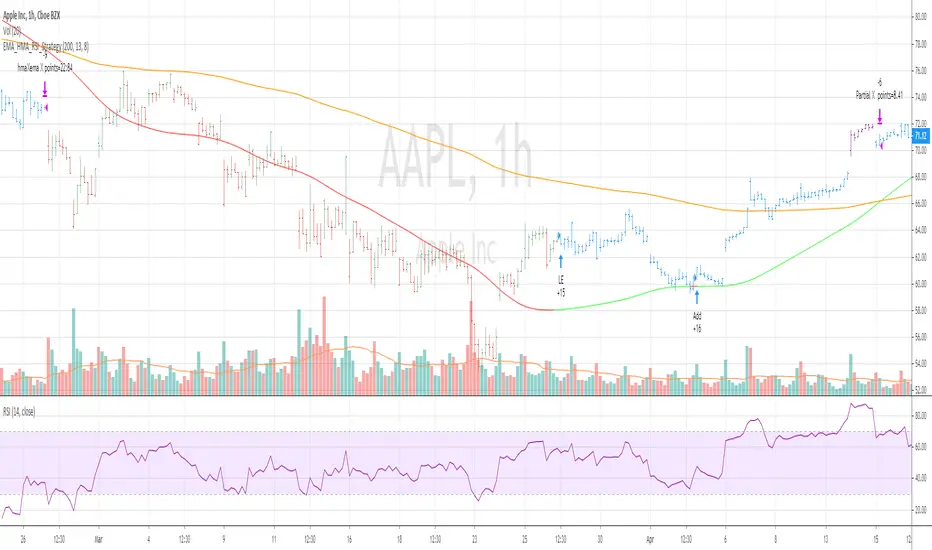
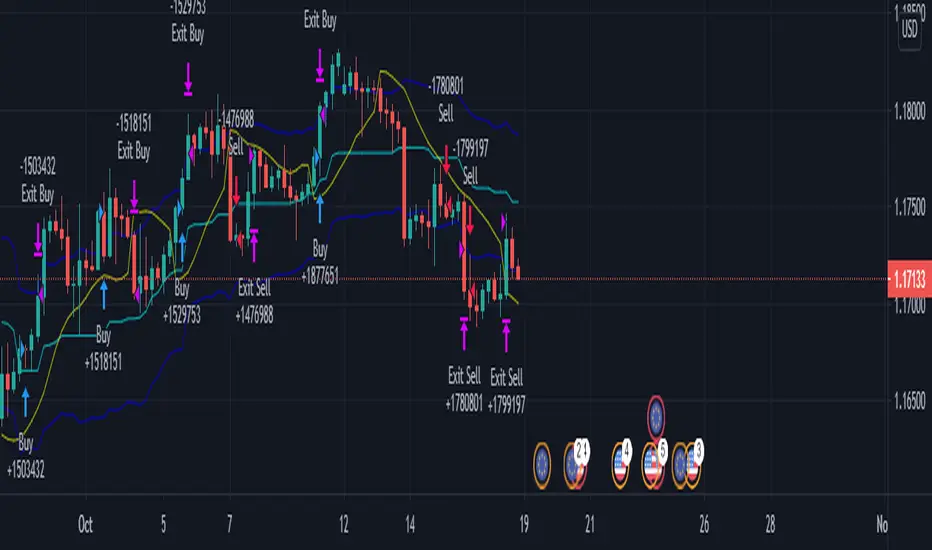
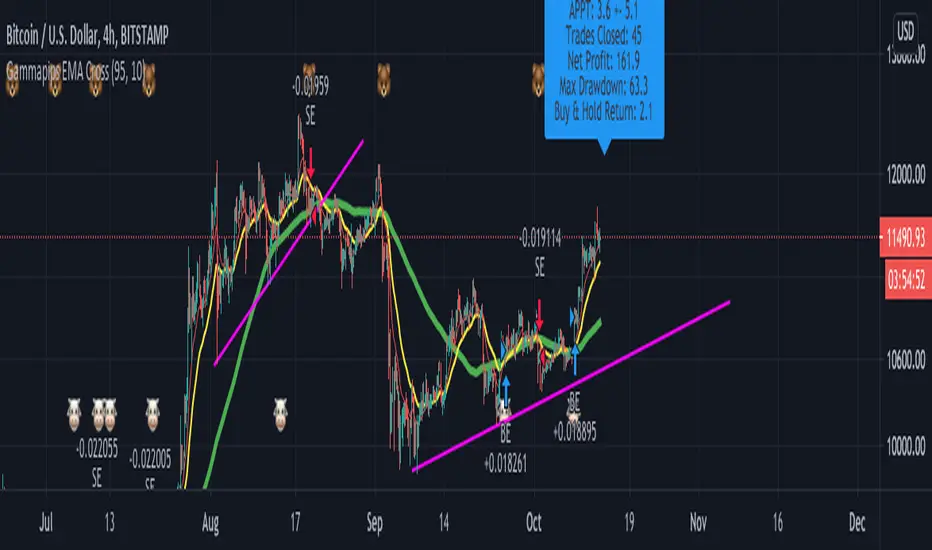
Use long and short moving average to look for a potential price in/out. (default as 14 and 7, bases on the history experience)
ADX and DMI to prevent the small volatility and tangling MA.
This script allows you to set the beginning & end time to test the bullish & bearish market.
If you want an indicator version, here is it.
Thanks.
Strategia Pine Script®