TSI CCI Hull with profit$$$This is a modified version of @SeaSide420 TSI CCI Hull with profits exit on long and short order ORIGINAL SCRIPT: /// /// feel free to edit/improve and comment Strategia Pine Script®di faresg79002525 1.8 K
Swing trading StrategyThis indicator based on capturing historical swing. It predicts future swing based on historical swing data. This is very useful for short term swing trading and gives best result on 30 minute chart.Strategia Pine Script®di AnkitaRanjan11128
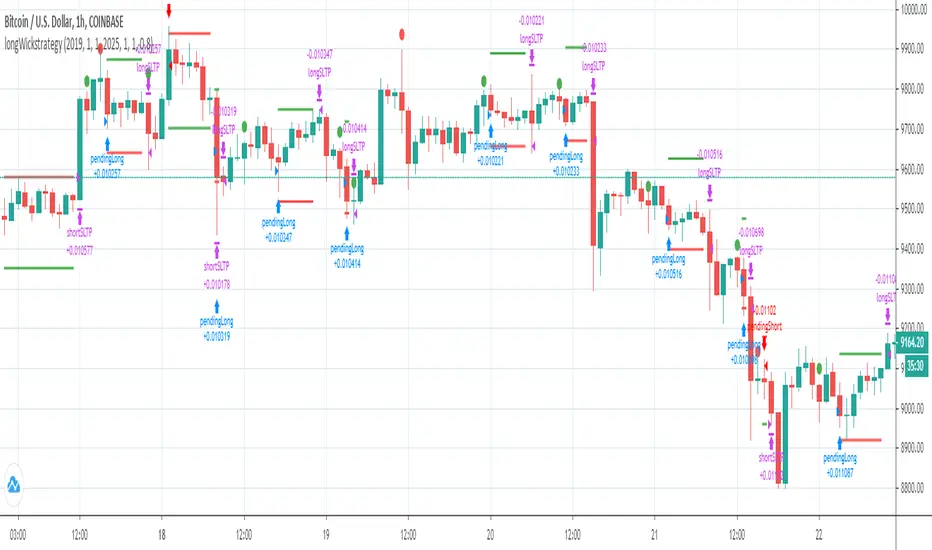
longWickStrategyprice action strategy for intraday trading based on candle vs wick length ratioStrategia Pine Script®di ondrej17118
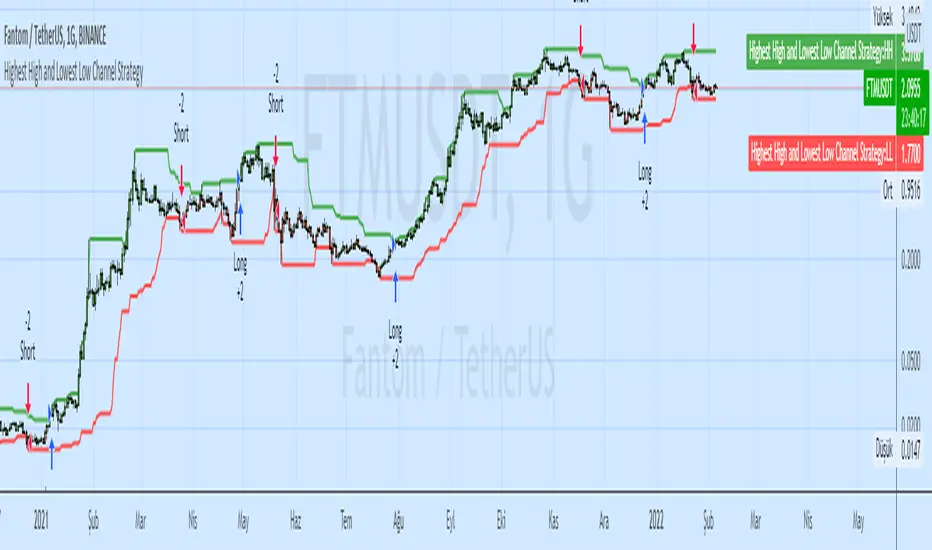
Highest High and Lowest Low Channel StrategyHighest / Highest High Highest (Data) - HHV (Data, Period) Lowest / Lowest Low Lowest (Data) LLV (Data, Period) These functions calculate the highest / lowest value of a selected data. Highest High and Lowest Low options are mostly used. The Highest function calculates the highest value of the selected data in the past. The Lowest function calculates the lowest value of the selected data in the past. Strategia Pine Script®di ceyhunAggiornato 1919 1.5 K
TradeSense Breakout Strategy v1TradeSense is a Renko brick breakout trading system for short-term or intraday trade. It is also a trend following strategy using a confluence of multiple MA's to spot the underlying trend. Exit and Stop Loss is based on dynamic ATR to predict possible target based on ticker's real time volatility. So far this has been back-tested on major cyrptos, and the same concept is applicable to other asset types. It is more suitable for lower timeframes (such as the 30m, 15m, and 5m) though you may try adjusting the parameters for higher timeframes. Feel free to backtest it and comment below! Optimum parameters: BTCUSD-15m - Noise Filter: 1 - ATRLength : 15 - SL coefficient : 2.0 - TP coefficient : 1.5 ETHUSD-15m - Noise Filter: 7 - ATRLength : 16 - SL coefficient : 2.0 - TP coefficient : 1.5 Strategia Pine Script®di TradeSenseTVAggiornato 1010114
Systematic Momentum strategy v 1.0Systematic Momentum strategy v 1.0 This is a long-only strategy optimized taking into consideration the underlying's momentum and volatily. Long story short it opens positions when the momentum is highest and the risk is lowest and closes the same position when the risk-to-reward is no longer optimal. How to use: -> To be used on an Index or a tracker ETF -> Position sizing should be set up to 100% of the portfolio Strategia Pine Script®di pedrodmalves2219
EMA Slope Trend Follower StrategyThis strategy is based on the slope of the EMA130. Over that slope, the script calculates two EMAs (9,21) which are used to generate the main entry and exit signal. In particular, the strategy enters a LONG position when EMA9 > EMA21. On the contrary, it closes the LONG and opens a SHORT when EMA9 < EMA21. When the slope of the EMA130 is rising, it means that the price is accelerating upwards, fueling an uptrend. Conversely, when the slope is falling, it means that the price is slowing down, falling into a possible downtrend. Calculating and analyzing two EMAs (fast and slow) over the slope of a medium length EMA instead of the price anticipates a lot the signal. In this way, the strategy never miss a trend. In order to minimize false positives (entering useless positions), I included two filters, which can be optionally turned on: - Trend Filter: When the price is above EMA200, the strategy opens ONLY LONG positions. If price < EMA200, only shorts allowed. If the slope gives a long signal and price is below EMA200, for example, the eventual SHORT position is closed, but the LONG entry is postponed to the moment when both conditions (slope uptrending and price > ema200) are met. I recommend always turning on this filter, as it dramatically decreases drawdown. - Volatility Filter: When the standard deviation of the last 20 candles is below its 50 samples moving average, no positions are opened, as market is going sideways. The purpose of this filter is to prevent false positives (positions which open and close in a matter of candles due to false signals in sideways market). I recommend turning on this filter only on low time frames. This strategy works great on medium time frames (like 4h, 6h, daily), since it spends way less in fees, opening less positions. It works good on low TFs too (up to 1h, didn't test lower ones), provided Volatility filter is turned on and parameters are set according to the asset. Commission included in calculations: 0.06% (it's the taker commission on BitMEX with the 10% discount obtainable with any referral link) Slippage included in calculations: 2 ticks (BitMEX has very liquid order books, and slippage doesn't happen very often unless a huge position size is used).Strategia Pine Script®di lukescream1717 2.5 K
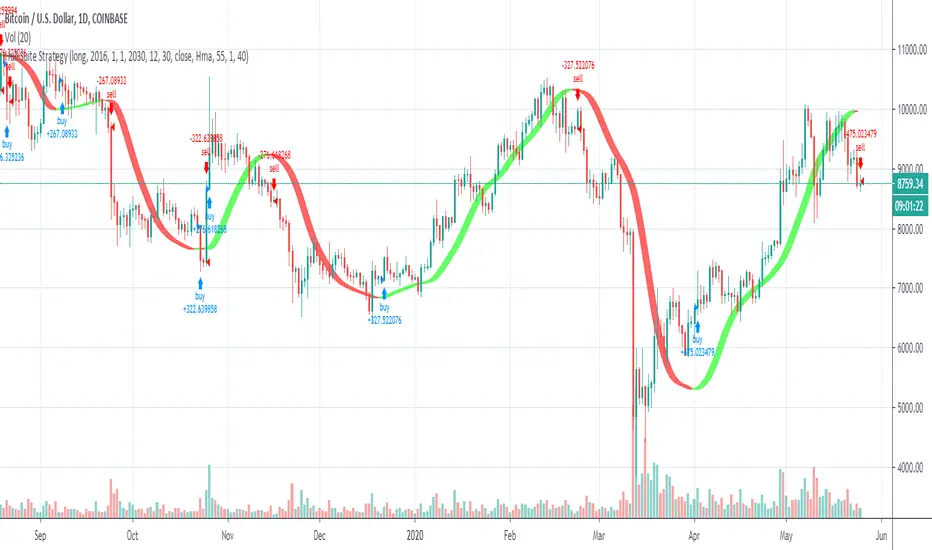
Hull Suite StrategyConverted the hull suite into a strategy script for easy backtesting and added ability to specify a time periods to backtest over.Strategia Pine Script®di DashTraderAggiornato 7373 13.2 K
Random Strategy with 3 TP levels and SL - KenfusI wanted to see how important risk-managment is. Strategia Pine Script®di Enzo123321Aggiornato 139
Psychological for Strategy testingHello everyone I've made Psychological to be able to adjust some variables for strategy. When you adjust each parameter of the settings, the strategy tester also comes to work in conjunction with. so please find your best parameter! ^^ I'm not very good at English, so i really want to write how to use Pychological's entry and exit too ,but please look up psychological entries as they are well known. Notice: There may be some programming mistakes, so please take your own responsibility when actually investing. Strategia Pine Script®di MemBar32
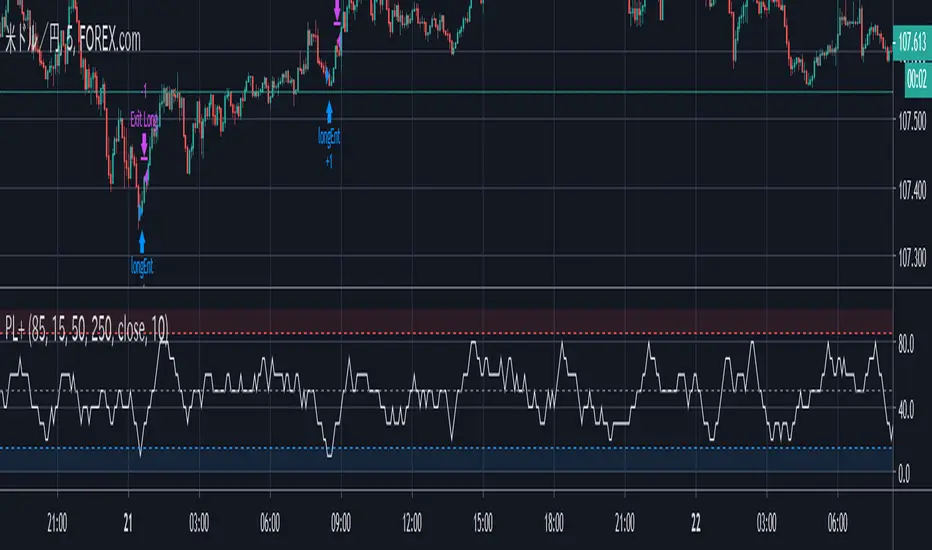
EMA(Rsi,length) Strategy onEMAのソースをRsi、期間をlenght(=デフォルトでは5)としたもの作成しました。 作成したものはデフォルトで黄色で表れております。 インジケーター上の緑色は、通常のRSIです 作成した際に参考にした足と通貨 5分足のUSDJPYとEURUSD 主にデイトレ目線で作っております。 デフォルト設定では "EMAが75を上抜け、または25を下抜けた際に逆張りでエントリーをするもの" として作成しております。 ◎利確と損切りの幅ならびにインジケーター上の水平線は変更可能となっており、変更後はストラテジーテスターの各値も付随して自動変更します。 設定画面の各項目 RSI : 一般的なRSIの終値に対しての期間(デフォルトでは14) Length : EMAでの期間をlengthとしております(デフォルトでは5) up、downはインジケーター表示上のデフォルトでの75と25の水平線の位置 shortprofit,shortloss : ショートで入るとした場合の利確と損切りの長さ。(longprofit,longlossについても同様) なおショートのポジションを持っている際にロングのポジションエントリーポイントに入った際は、持ってるショートのポジションは手仕舞いし、新たなロングのみポジションをもつようになっております。 免責事項ならびにお願い:上記の様に、各値、ならびにストラテジーテスターを設定しているつもりですが、プログラミングの入力ミスなどがある場合がございます。お知らせいただけますと幸いです。 また、投資をする際はご自身の責任と判断にて投資をなさるようお願いいたします。Strategia Pine Script®di MemBar19
E.B. INVERSE CROSSING MOVING AVERAGEThis strategy uses the EMAs 10, 20 and 200. When the EMA 10 is above EMA 100 and crossunder EMA 20, the strategy will buy the stock. When the EMA 10 is under EMA 100 and crossover EMA 20, the strategy will sell the stock. If during a buy/sell transaction the EMA 10 crosses EMA 100, the transaction will be closed. You can adapt the EMA's value. Just DM to me for access!!Strategia Pine Script®di EntrenamientoBursatil0
RSI5_50 with DivergenceThis is variation of RSI Divergence strategy. I have added a filter (long term RSI) to the Rules. strategy BUYs when RSI 50 period is above 50 line and there is divergence on the short term RSI settings ========= short term RSI period 5 long term RSI period 50 stopLoss is 8% --- if setting is enabled BUY Rule ======== RSI 50 is above 50 line short term RSI is showing divergence Add to existing ============== if already in position, BUY when shorTermRSI is crossing above 20 TakeProfit ========= when longTermRSI reaches 60,65, 70 and 75 level , take partial profits . (not when crossing down --- This may affect on profits , because when price goes down , it goes very fast ) Exit ===== when longTermRSI is crossing down 30 OR stopLoss value hits Note: When I tested this with GOOGL stock , I have got excellent results ... any experts there , please check everything is good with scripting ... Happy TradingStrategia Pine Script®di eemani1231717421
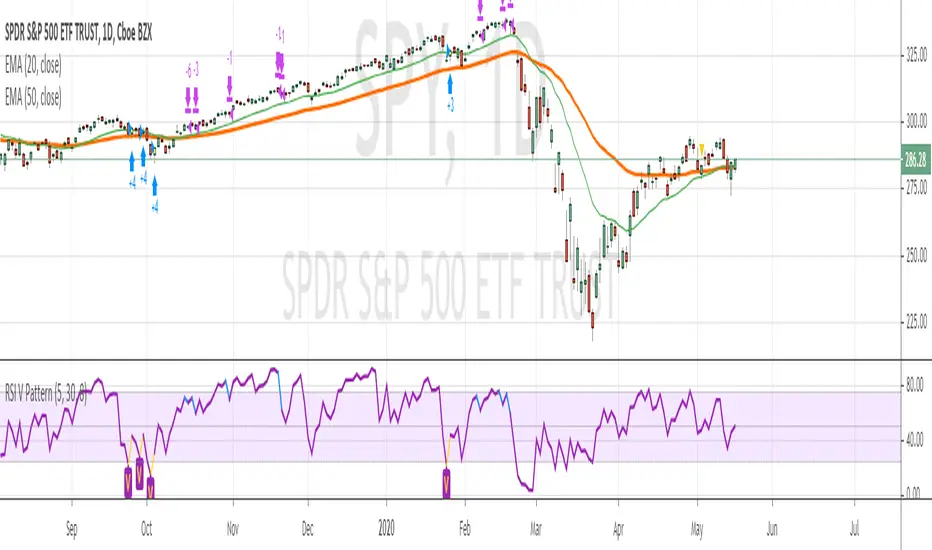
RSI V Pattern strategyThis strategy based on RSI for swing trading or short term trading Strategy Rules ============= LONG 1. ema20 is above ema50 --- candles are colored green on the chart 2. RSI value sharply coming up previous candle1 low is previous candle2 low and previous candle1 RSI value is less than previous candle2 current candle RSI value is greater than previous candle1 and crossing above 30 above which makes a V shape on RSI indicator, colored in yellow on the chart , price bar is colored in yellow 3. Enter Long when the above V pattern occurs EXIT LONG 1. when the RSI reaches 70 , close half position and move stop loss to up 2. when RSI reaches high value 90, close 3/4 position 3. when RSI crossing below 10 OR stopLoss hit , whichever happens first , close whole position Note : take profit levels are colored in blue on RSI and Price candles I have tested SPY , QQQ on daily chart , performance results are with 80% win rate and more than 3 profit factor Happy Trading Strategia Pine Script®di eemani123Aggiornato 66436
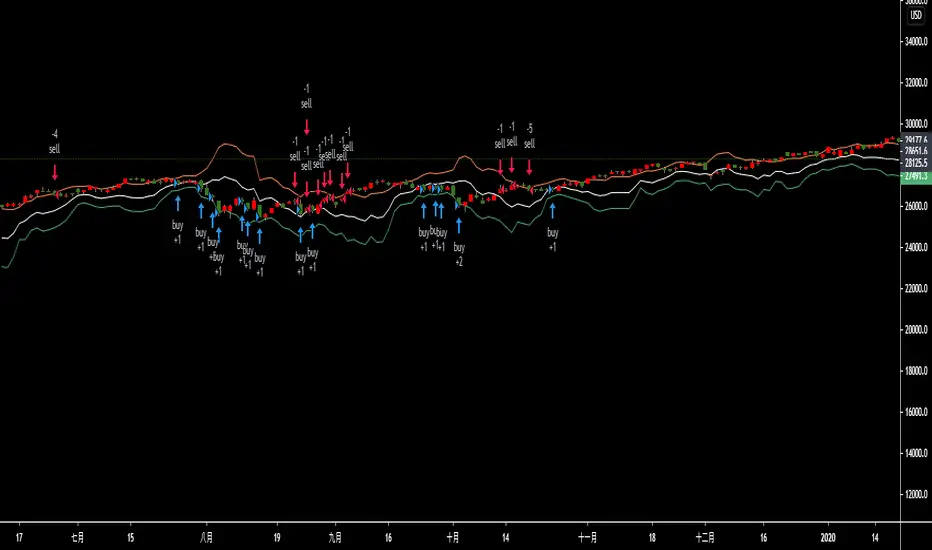
KD compare strategy (交易策略對照組)This is a base and easy trading strategy for comparing my other strategy. The strategy consider K >= 80 is strong target in the last high period, and consider K <=20 is the weak target in the last low period. In the strong target, the strategy may increase long at the first day when K < 50, until 2/3 max order limitation or strong target become to weak. In the weak target, the strategy may increase short at the first day when K > 50, until 2/3 max order limitation or strong target become to strong. there are three orders for this strategy. when the strong become to weak, it may use the remain 1/3 to save itself, and change the direction at the next k > 50 when the weak become to weak, it may use the remain 1/3 to save itself, and change the direction at the next k < 50 這是一個簡單的雙向交易策略,用來對照我其他的策略。 當 K>=80 它會認為目前是強勢股,偏多操作 當 K<=20 它會認為目前是強勢股,偏空操作 當標的為強勢股時,當第一次 K<50 會加碼多單,最多買進2/3的持股,直到轉弱 當標的為弱勢股時,當第一次 K>50 會加碼空單,最多買進2/3的持股,直到轉強 當強勢轉弱勢時,會使用剩下的1/3來拯救持股,在下次 k > 50 出清持股 當弱勢轉強勢時,會使用剩下的1/3來拯救持股,在下次 k < 50 出清持股Strategia Pine Script®di TonyderAggiornato 87
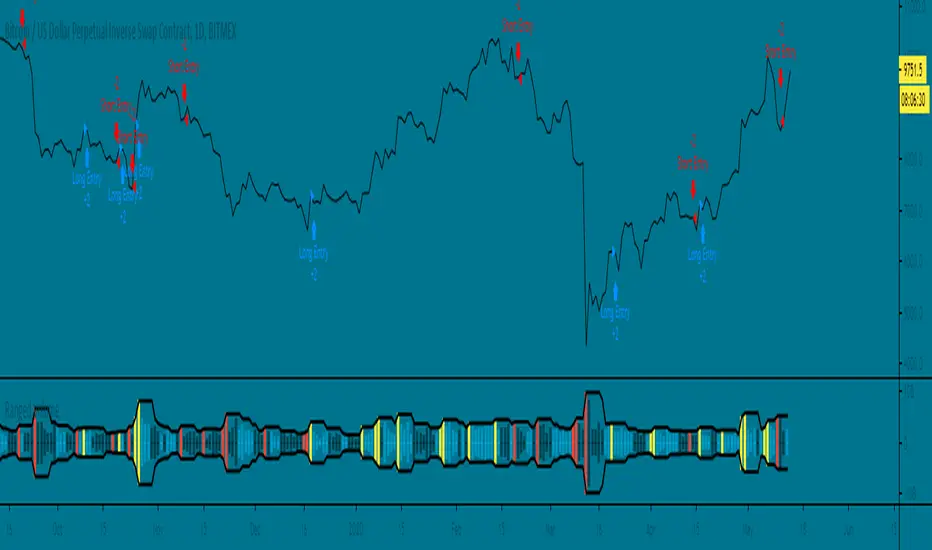
Ranged Volume Strategy - evoThis is the strategy version for the ranged volume indicator I published a few days ago. Long : First yellow break-out after red Short : First red break-out after yellow Because this is volume, you want to be using this on an exchange with high volume for the best results. Default settings are not optimized but work great on bitcoins daily chart. A short explanation of the indicator below: Strategia Pine Script®di EvoSti_1010512
MBRLong only strategy that focuses on momentum, acceleration and volatility. Backtested results are from 2011-2020 10 ticks of slippage and 0.25% comissions. $10k starting equity is used and 33% of equity is traded per position. Backtest isn't indicative of future results, automated forward testing will start soon and results will be posted in this thread.Strategia Pine Script®di FjvdbAggiornato 4414
E.B. StrategyThis strategy use a custom indicator. When the green line cross above the level 6, it's going to sell the stock. When cross down -6, it's going to buy the stock. You can change the level's number to adapt it to any asset. It works for US30, or any Dow's Futures . But you can adapt it to any market, FOREX/Crypto/Stocks. Also it works better in 5/15 min chart, but you can adapt it to any resolution too. We use EMA 100 and ADX 14 as a filter of the indicator. EntryModel is the level to make Buy and Sell transactions. ExitModel is the level to close transactions. In TPandSL you can choose: No -> if you want only buy and sell, without closing transactions. Model -> you will use the ExitModel parameter to close transactions. % -> if you want to use a percentage of TP and SL. Volatility -> to adapt TP and SL with the volatility of the moment. Pips -> if you want to use Pips to close transactions. If you would like to have the access, just DM me!Strategia Pine Script®di EntrenamientoBursatil112
Ichimoku Kinko Hyo: ETH 3h Strategy by tobunoIchimoku Kinko Hyo strategy for long term trend trades of Ethereum . Optimized for 3H ticks. Strategia Pine Script®di iamcyberduck22376
Strategy BTBTBTBT — strategy for only long positional trading of top cryptocurrencies. BTCUSD and ETHUSD are best suited for this strategy. The main idea of the strategy is to buy cryptocurrency with a leverage of up to 1: 3 when the market is growing, and get rid of cryptocurrency when the market is not growing or falling. The strategy is working on a daily timeframe . To determine the trend, the strategy uses a combination of indicators MA25 and MA99. To determine overbought (pump) and oversold (dump), the strategy uses the oscillator "SPPO". The strategy has three trading conditions: 1) SPPO SPPOoverBought - "pump" market. Close all long positions or leave a position with a micro-leverage of 1: 0.1 for a period of 28 days. 3) Closing> MA25 > MA99 - uptrend in the market. We open the "long" position with a leverage of 1: 3. If market conditions do not meet the above criteria, then the strategy does not have open positions. Input parameters Recommended timeframe D1. FastLength - period for fast MA. Default = 25. SlowLength - period of slow MA. Default = 99. SPPOoverSold - trigger for determining the dump in the market. Default = -30. SPPOoverBought - trigger to determine the pump in the market. Default = 35. SPPOmaxForLong - the maximum value of SPPO for opening a long position. Default = 10. LeverageLong - leverage when entering the market with a "long" signal. Default = 3. LeveragePamp - the amount of leverage when entering the market with a "pump" signal. Default = 0.1. LeverageDamp - the amount of leverage when entering the market with a "dump" signal. Default = 1. Log equity chart - If true, use a logarithmic scale for a graph of equity. Default = false.Strategia Pine Script®di Elrid18
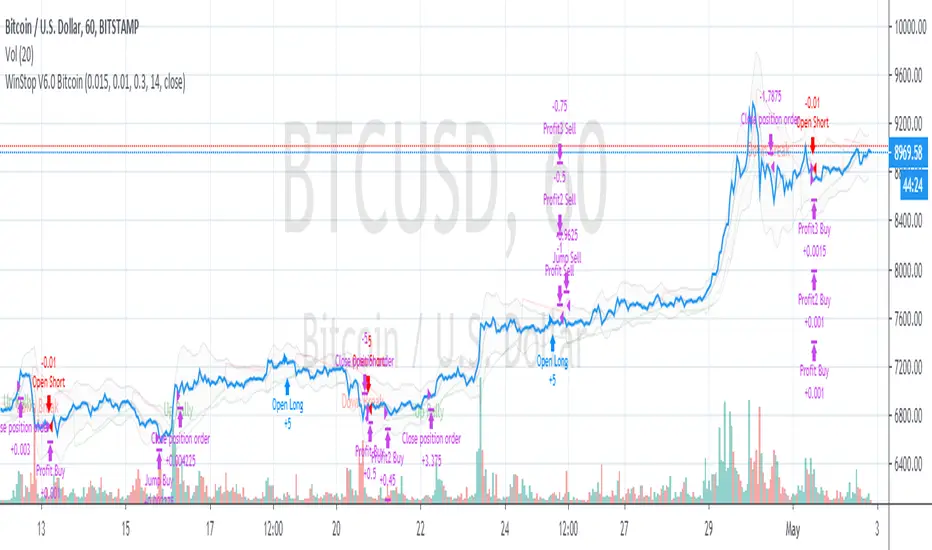
WinStop Strategy for BItcoinWinStop strategy is a high alpha low volatility trend following strategy based on Validate PSAR trends and RSI and William %R oscillators.Strategia Pine Script®di accutrades_net56
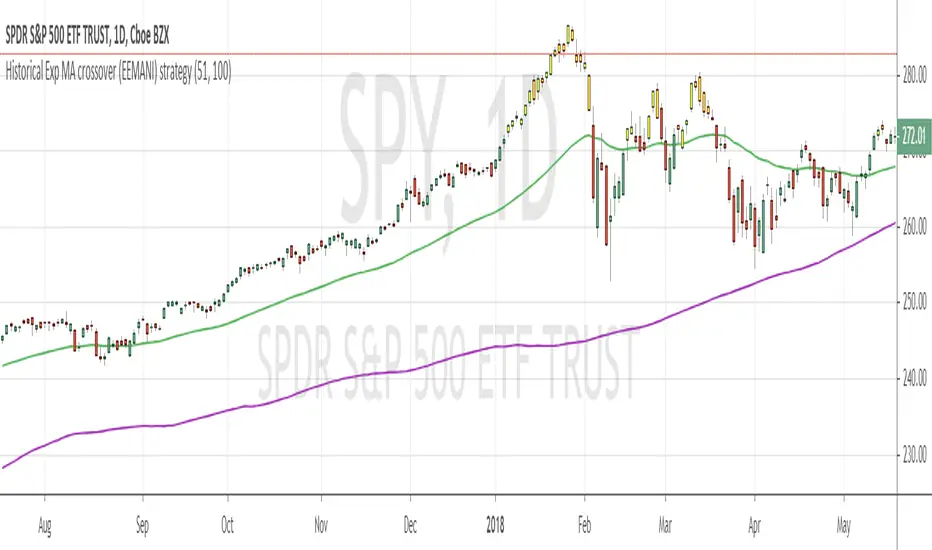
Historical Exp MA crossover (EEMANI) strategyThis strategy is based on exponential moving average. I was doing some research on when price extended too far from moving averages / exponential moving averages , ended up with this idea. LONG RULE when Exponential MA cross over the historical Exponential MA EXIT RULE when Exponential MA cross down the historical Exponential MA Take Profit if you check take profit parameter , strategy marks the bars in yellow color when it reaches 30% profit Example: I have tested this strategy with SPY , which showed best results with Exp MA = 51 and Historical Exp MA = 100 which has 71% win ratio and High profit factor low max draw down . especially Max Loss on any taken trade is less than 5% Though price movement looks ugly on the chart , ultimately trade closes with decent profit / minimal loss Note : past performance is not necessarily indicative of future results, please do your research and back test Strategia Pine Script®di eemani12368
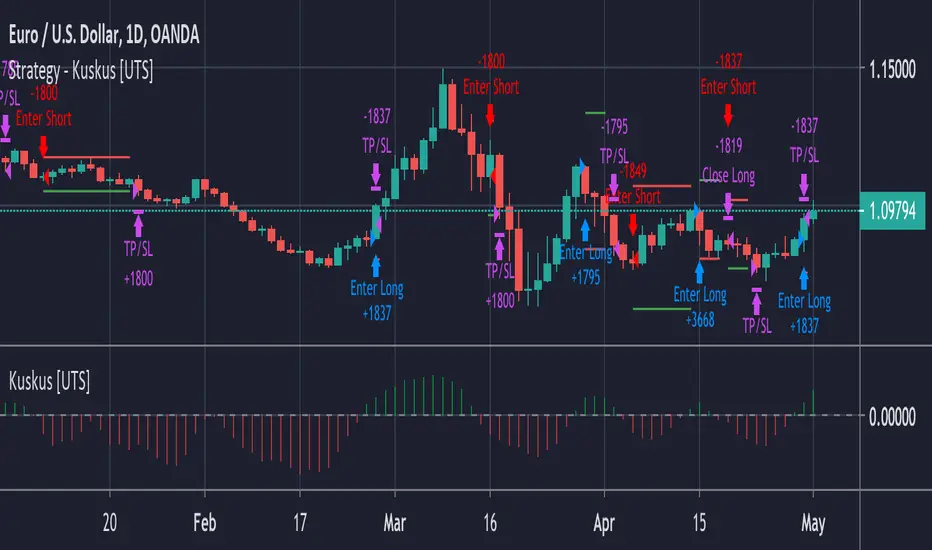
Strategy - Backtest Uber Kuskus Starlight [UTS]Backtest of Uber Kuskus Starlight Backtest with focus win/loss profitability. Formula: profitability = win / (win+loss) Default equity 100k USD Default 2% Risk per trade Default currency USD Define backtest interval precisely by month, year, day LONG and SHORT positions Visualize SL and TP on chart ATR (len: 14, smooth: SMA) ATR based Stop-Loss, if hit trade will be closed and considered as loss ATR based Take-Profit, if hit trade will be closed and considered as win On TP or SL hit the trade is closed and marked as win/loss Strategia Pine Script®di UberTradingSystemsAggiornato 2216