Btc and Eth 5 min winnerWhat the Strategy Does
Finding the Trend (Like Watching the Bus Move): The strategy uses special tools called Hull Moving Averages (HMAs) to figure out if Bitcoin (BTC) Ethereum (ETH) prices are generally going up or down. It looks at short-term (5 minutes) and long-term (10 minutes) price movements to make sure the “bus” (the market) is moving strongly in one direction—up for buying, down for selling.
Spotting Good Times to Jump On (Buy or Sell Signals): It looks for two types of opportunities:
Pullbacks: When the price dips a little while still moving up (like the bus slowing down but not stopping), it’s a chance to buy.
Breakouts: When the price suddenly jumps higher after being stuck (like the bus speeding up), it’s another chance to buy. It does the opposite for selling when prices are dropping.
It also checks if there’s enough “passenger activity” (volume) and momentum (speed of price change) to make sure it’s a good move.
Avoiding Traffic Jams (Filters): The strategy uses tools like RSI (to check if the market’s too fast or too slow), volume (to see if enough people are trading), and ATR (to measure how wild the price swings are). It skips trades if things look too chaotic or if the trend isn’t strong enough.
Setting Safety Stops and Profit Targets: Once you’re on the “bus,” it sets rules to protect you:
Stop-Loss: If the price moves against you by a small amount (0.5% of the typical price swing), you jump off to avoid losing too much—think of it as getting off before the bus crashes.
Take-Profit: If the price moves in your favor by a small amount (1.0% of the typical swing), you cash out—imagine getting off at your stop with a profit.
Trailing Stop: If the price keeps moving your way, it adjusts your exit point to lock in more profit, like moving your stop closer as the bus keeps going.
Using Leverage (10x Boost): This strategy uses 10x leverage on Binance futures, meaning for every $1 you have, you trade like you have $10. This can make profits (or losses) 10 times bigger, so it’s risky but can be rewarding if you’re careful.
Why 5 Minutes and Bitcoin and Ethereum?
5-Minute Chart: This is like checking the bus every 5 minutes to make quick, small trades—perfect for fast, short profits.
Bitcoin Ethereum (BTC/USD)(ETH/USD): It’s the most popular and liquid crypto, so there’s lots of activity, making it easier to jump on and off without getting stuck.
Why It Aims for 90% Wins (But Be Realistic)
The goal is to win 9 out of 10 trades by being super picky about when to trade—only jumping on when the trend, momentum, and volume are all perfect. But in real trading, markets can be unpredictable, so 90% is very hard to achieve. Still, this strategy tries to be as accurate as possible by avoiding bad moves and focusing on strong trends.
Risks for a New Trader
Leverage: Trading with 10x leverage means small price moves can lead to big losses if you’re not careful. Start with a demo account (pretend money) on TradingView or Binance to practice.
Learning Curve: This strategy uses technical terms (like HMAs, RSI) and tools you’ll need to learn over time. Don’t rush—just practice and ask questions!
How to Use It
Go to TradingView, load this strategy on a 5-minute BTC/USD futures chart on Binance.
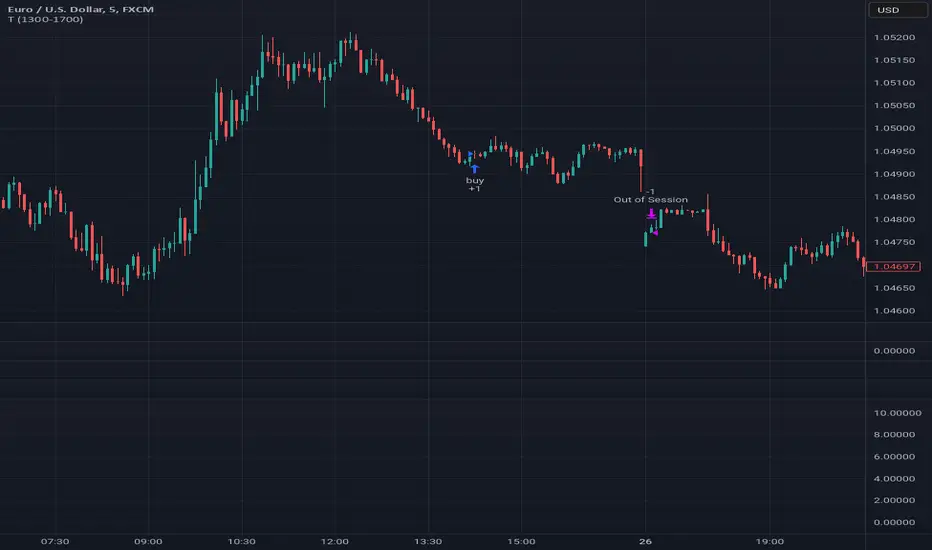
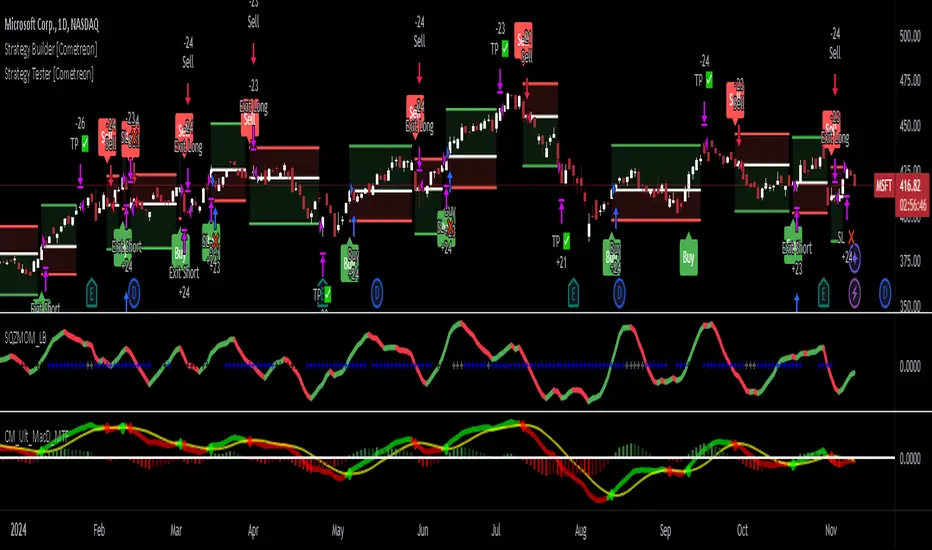
Watch the green triangles (buy signals) and red triangles (sell signals) on the chart—they tell you when to trade.
Use the stops and targets to manage your trades—don’t guess, let the strategy guide you.
Start small, learn from each trade, and don’t risk money you can’t afford to lose.
This is like learning to ride a bike—start slow, practice, and you’ll get better. If you have more questions or want simpler tips, feel free to ask! Trading can be fun and rewarding, but it takes patience and practice.
Strategia Pine Script®