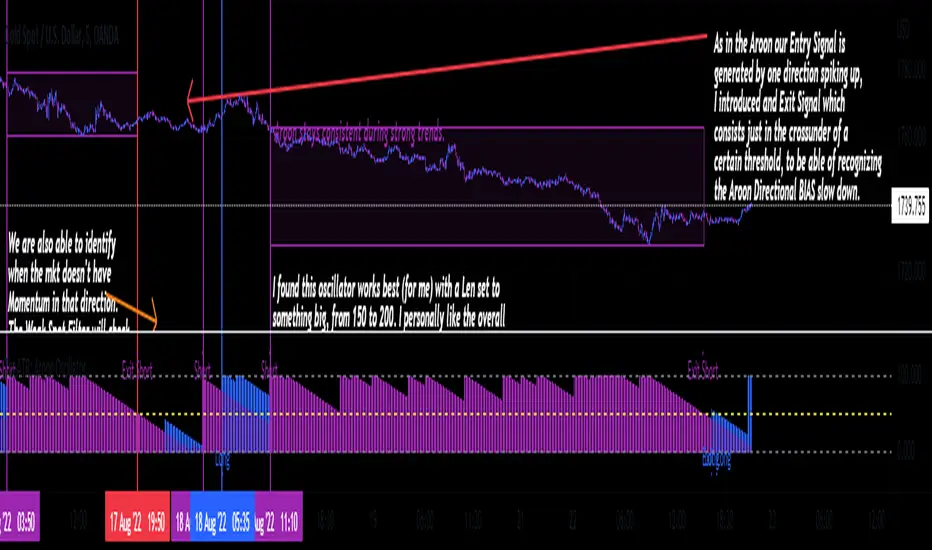
TheATR: Aroon Oscillator.Aroon Oscillator (AO).
The Aroon Oscillator, was developed by Tushar Chande, in 1995, to highlight the start of a new trend and to measure trend strength.
I re-branded a bit the whole thing, If you are familiar with how this Oscillator usually is, you are going to notice the differences.
Aroon Oscillator Components.
1 - Aroon Up -> Bullish Directional Component, highlighted in blue.
2 - Aroon Down -> Bearish Directional Component, highlighted in purple.
We also have the Oscillators static thresholds, which are:
- 0 Line.
- 100 Line.
- Exit Signal Line Level.
How to read the Aroon Oscillator.
The AO main goal, is to identify the trend from its first stages, to then come up with how strong that trend is.
So, classic interpretation for the AO would be:
-Aroon Up>Aroon Down = Bull Scenario.
-Aroon Up
Strenght
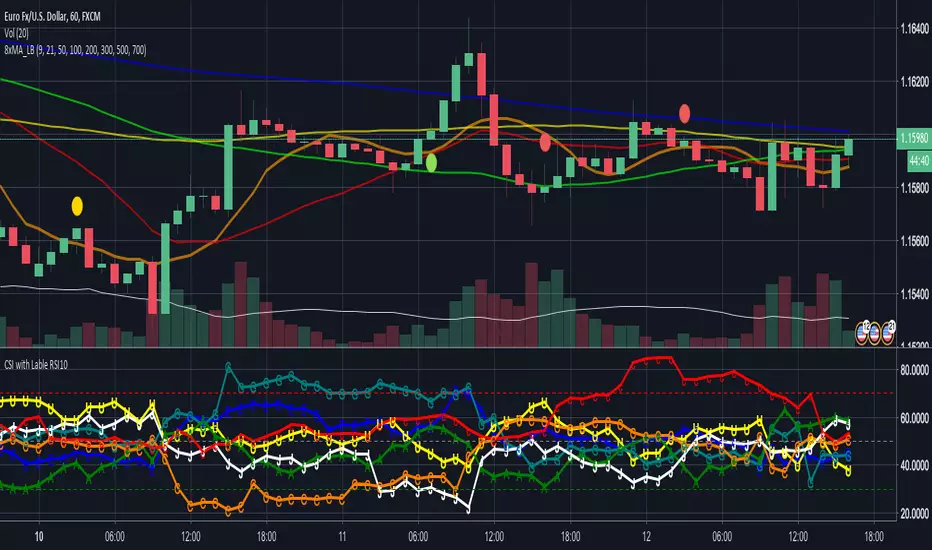
CSI - Currency strength indicator RSI 10This Indicator shows you the strength of the Currency in comparison for all other Main Currencys at the timeframe you choose.
The Currencys in this Indicator is: EUR, USD, GBP, CHF, AUD, CAD, JPY
The Base is the RSI (relative strength Indicator) with the following Currency pairs:
eurusd, eurgbp, euraud, eurjpy, eurcad, eurchf
usdeur, usdgbp, usdaud, usdjpy, usdcad, usdchf
gbpeur, gbpusd, gbpaud, gbpjpy, gbpcad, gbpchf
audeur, audusd, audgbp, audjpy, audcad, audchf
jpyeur, jpyusd, jpyaud, jpygbp, jpycad, jpychf
cadeur, cadusd, cadaud, cadgbp, cadjpy, cadchf
chfeur, chfusd, chfaud, chfgbp, chfjpy, chfcad
The letters in the LineChart:
EUR = E
USD = U
GBP = G
CHF = C
AUD = A
CAD = C
JPY = J
The CSI can help to see, if your trading pair have the potential to breakout on the support and resistance or if it more likely go back.
Some people say that the banks use this indicator.
NZD is missing there because Tradingview only support 6 variables.
If you have a solution for than, please let me know.
Thanks