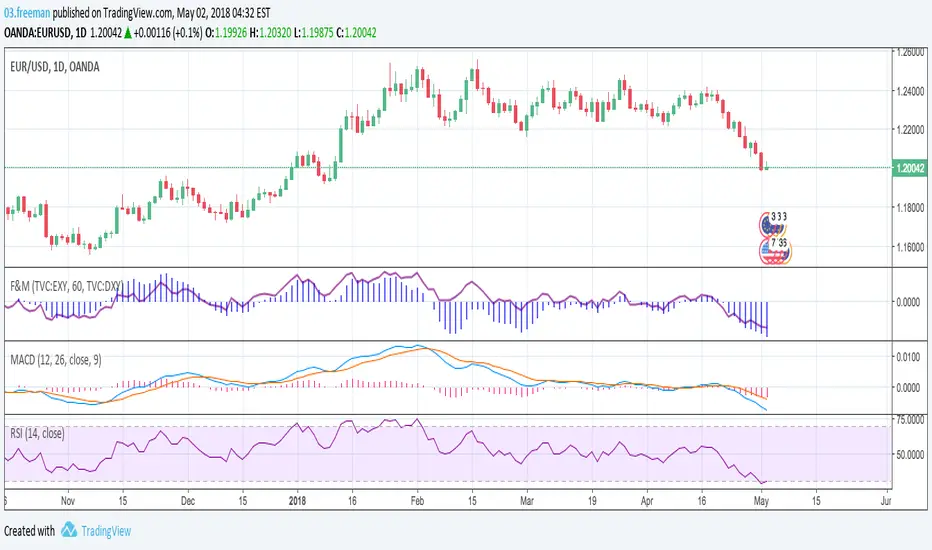
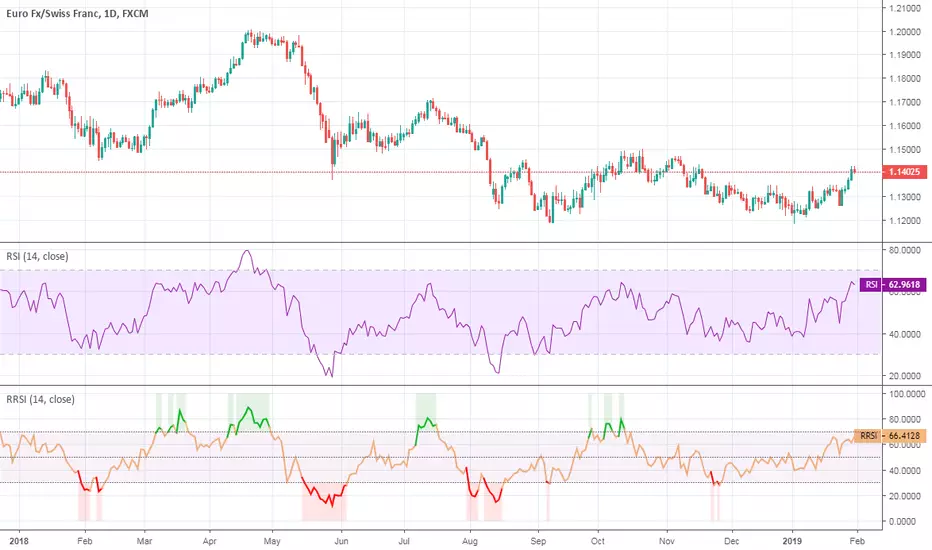
Ultimate Strength Index (USI),Stoch Multi Time Frame(MTF)[cI8DH]Ultimate Strength Index ( USI ) adds stochastic, multi time frame, signal line, histogram, and bar coloring options to RSI and Absolute Strength Index ( ASI ) . It can also turn into an indicator similar to Awesome Oscillator/MACD line. This indicator can be used for analyzing momentum and trendiness/choppiness, as well as identifying swings (stoch). The fix applied in True RSI is also applied here. Chart below shows example multi-TF setup with bar coloring.
For analyzing volume, I made a similar indicator based on money flow and accumulation/distribution, which you can find in the link below.
Aggregation Method
aggregation method = MA Percent => True RSI: momentum and divergence, failure swings
aggregation method = MA => Absolute Strength Index: accurate momentum and divergence
aggregation method = Cumulative => Awesome Oscillator alternative : momentum and divergence, twin peaks, ... (set the smoothing to 5 and signal length to 29ish)
Smoothing, signal line and histogram to detect trend and choppiness
You can apply additional smoothing to USI . Also, you can add a signal line and histogram (histogram is the difference between main line and signal line). To do so, set the signal length to a number greater than one. Signal line can help you detect changes in trend similar to the signal line on MACD. If signal line criss-crosses USI , it shows market is choppy. The worst case is when this criss-crossing coincides with USI flattening near neutral line and histogram height is relatively short; that means market is ded (until it is not; expansion following a contraction period is a common phenomena)! (Bear in mind that histogram will be hidden in stoch mode, and main and signal lines will be hidden in cumulative mode)
Stochastic
To enable stoch, change the stoch length to a number greater than 1 (default stoch length for the built-in RSI stoch is 14). This length should be calibrated depending on TF and asset. If done correctly, it can be a powerful tool for identifying swings. Stoch can be combined with any aggregation method. I recommend using stoch with MA aggregation (i.e. ASI ). For conventional uses of stochastic, please read www.tradingview.com(STOCH) and www.tradingview.com(STOCH_RSI).
Experimental Bar coloring Feature
There is an option to color bars depending on USI's position relative to the signal line. If both TFs are used in coloring and they are in disagreement, the TF with greater histogram height wins. There are two shades of green and red. The darker shade means both TFs agree. If you use the signal line, bar coloring can help with calibrating the indicator (play with parameters until you see a good looking chart i.e. a lot of green candles followed by a lot of red candles in a row). Please note that bar colors might change until candle(s) close(s). The bar coloring rules will most likely change in the future.
Notes
- Smooth MA length N = EMA length 2*N-1
- With correct settings, you can also create an alternative to normalized MACD line in the cumulative mode.
True RSI
Absolute Strength Index
Please give a like, and share the interesting configurations you find in the comments.
Indicatore Pine Script®