Institutional Price LevelsInstitutional price levels
(AKA round numbers, Perfect Price Levels-PPL)
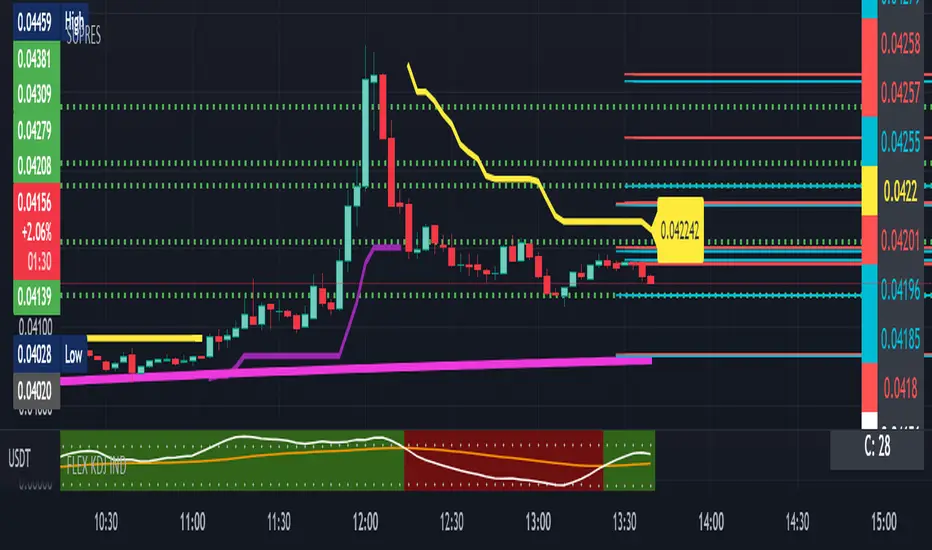
Institutional Price Levels (IPL) script shows the closest round numbers from the current price.
Some traders uses round numbers as a support resistance levels.
For example: 0.000 0.500 1.000 levels. Additional levels are 0.200 0.800.
So I made a simple script that shows round numbers and the quarter levels(Not exactly quarter but minor levels)
Quarter level option is planned on next update.
Default range is 300 pips and you can extend until 500 pips range.
Time range is extandable to the right and left side. You can just extend the line by increasing the bar numbers.
Inputs:
Show levels - Can show and hide all levels. Level colors are optional.
Show quarter - Can show and hide minor levels which is 0.800 0.200 levels. Colors are optional
Show more levels - Can show and hide more levels. Default range is 300 pips. Additional 200 pips range is optional.
Extend right bars - Can set length of levels to the right side.
Extend left bars - Can set length of levels to the left side.
Thank you.
Indicatore Pine Script®