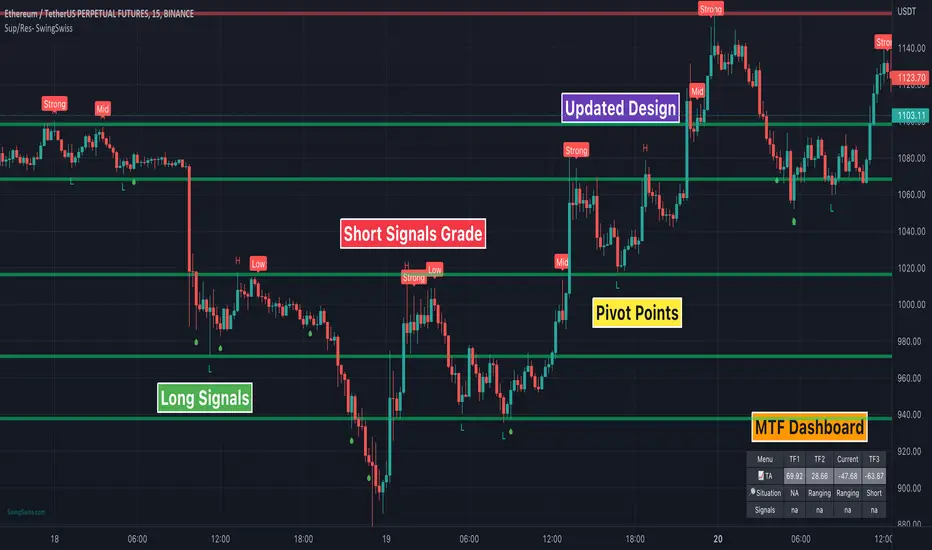
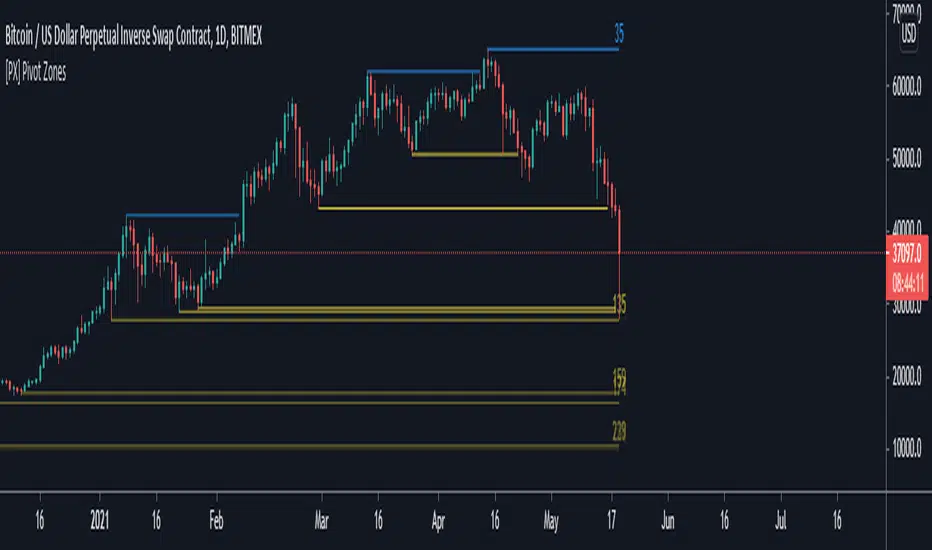
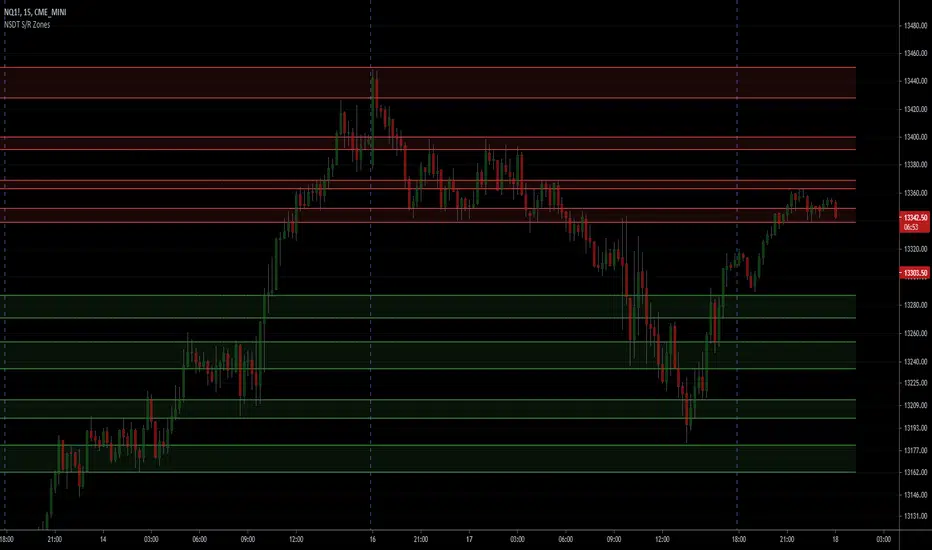
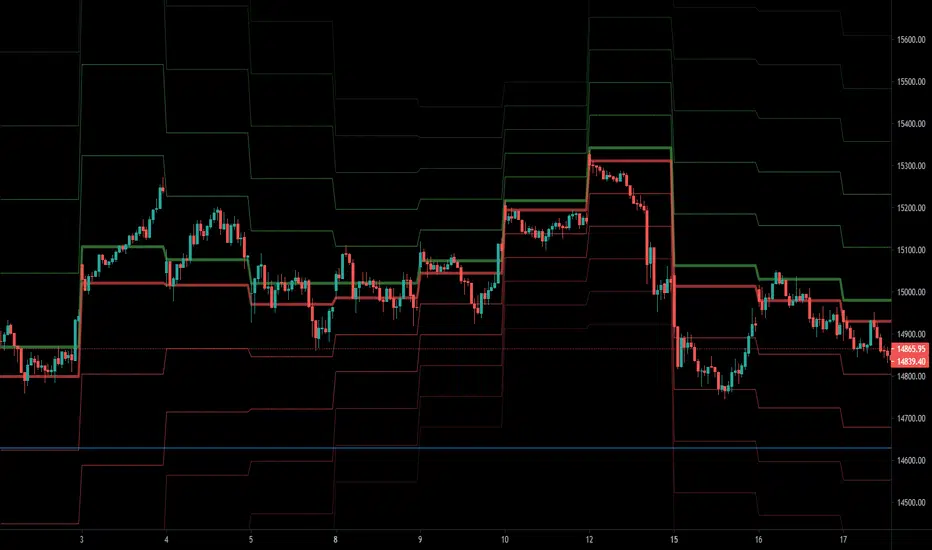
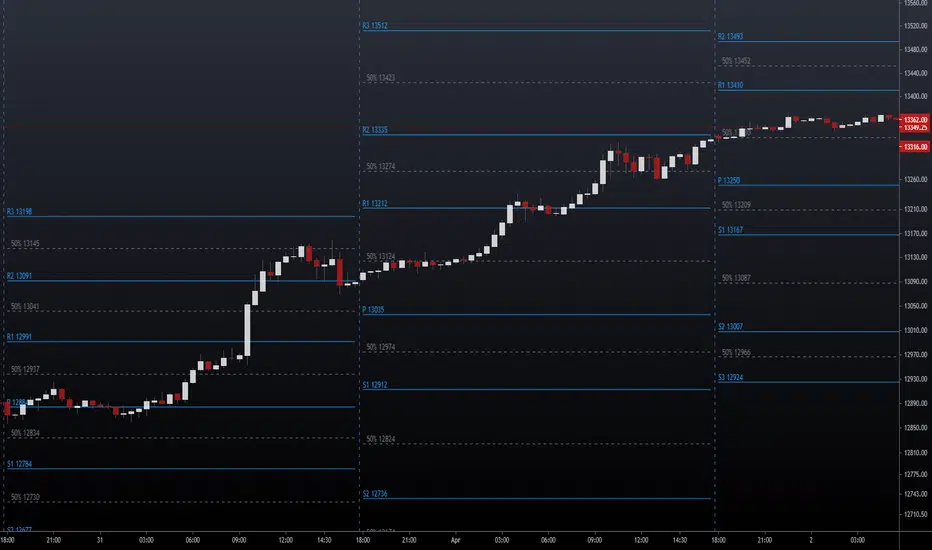
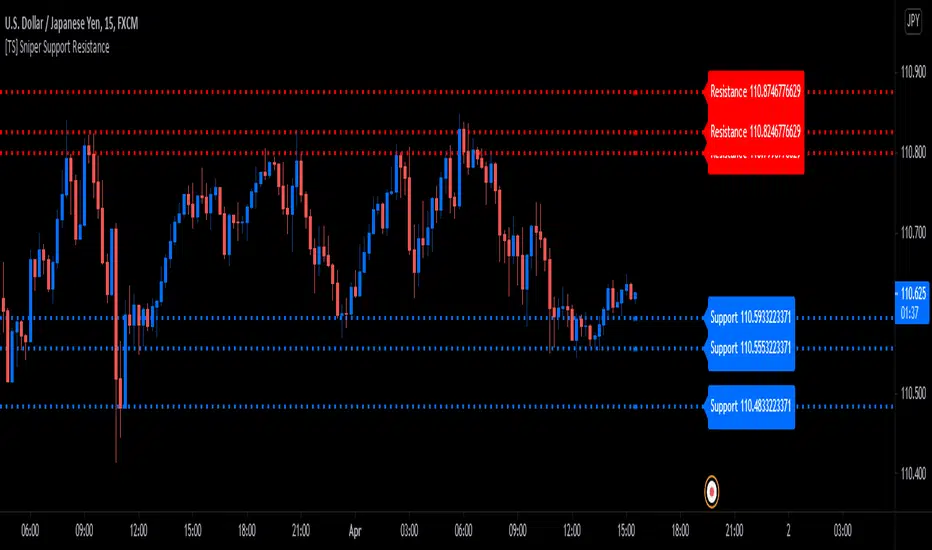
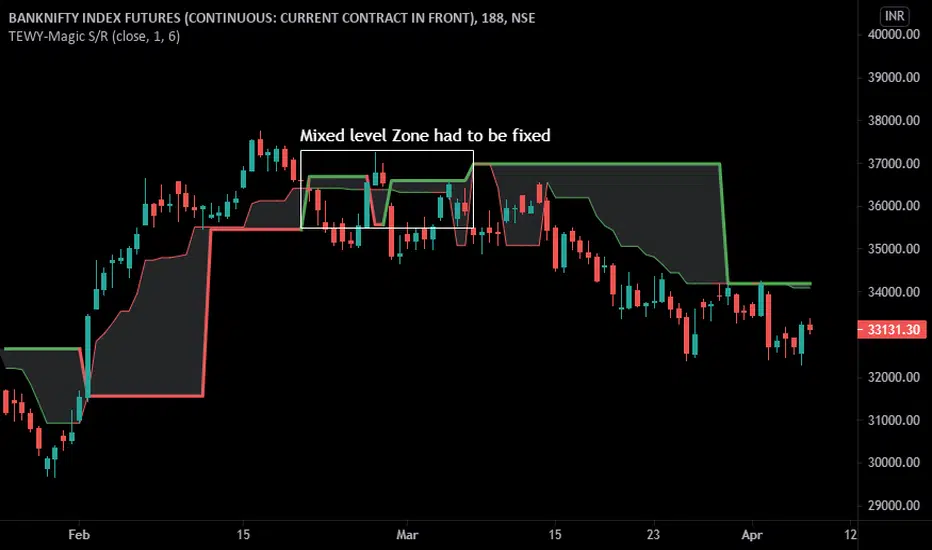
Sup/Res - SwingSwiss SuiteSup/Res can display up to ten different lines of supports and resistance.
It’s super reliable and ultra-customizable. You won’t have to draw them yourself anymore. It’s more accurate and time-saving.
Also, the indicator calculates in real-time the distance in % from the market price to the lines.
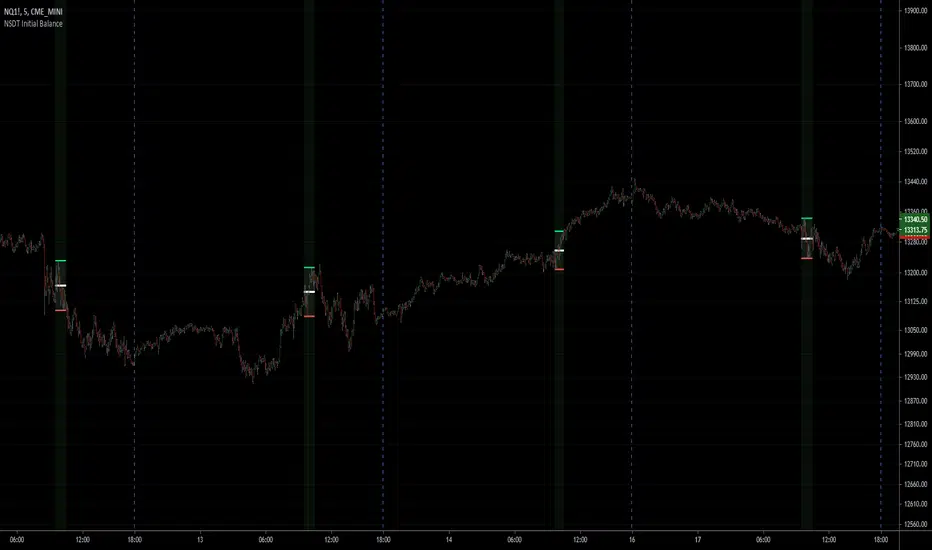
The indicator is perfect if you need to define your price limits on a swing trading strategy or for scalping a 5mn chart as a day trader.
Disclaimer:
Trading and investing in the financial markets involves substantial risk of loss and is not suitable for every investor.
All trading strategies are used at your own risk.
Trend Analyzer is part of the SwingSwiss Suite, contact me for more info
Indicatore Pine Script®