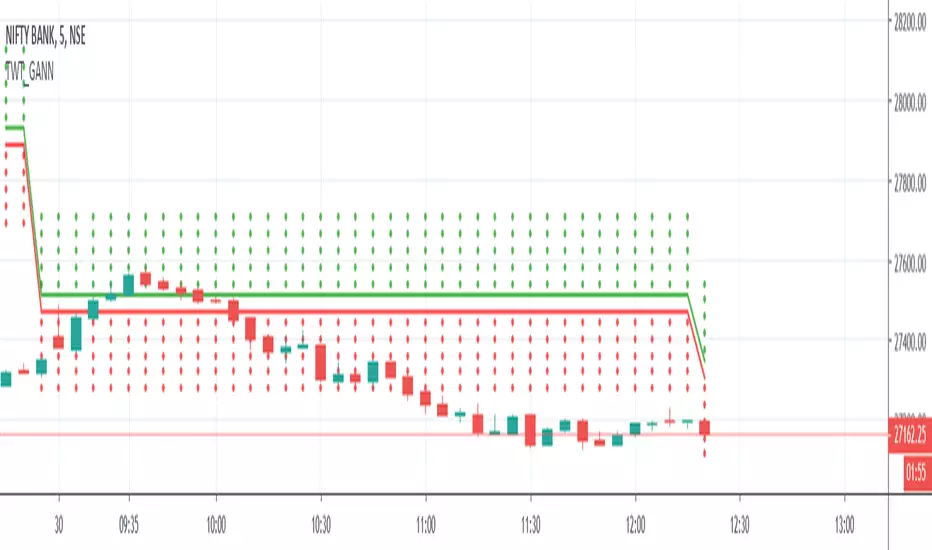
TWT_GANNGann Square of 9 is being calculated in this script and plotted
Price which is being considered for calculation is :: Session Open Price ( It means everyday Open Price)
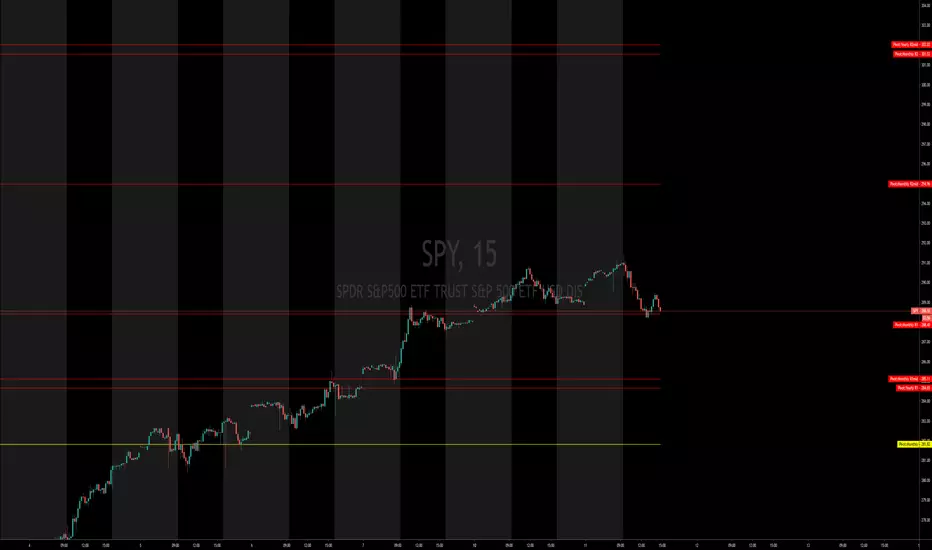
BUY near/above GREEN Straight Line
SELL near/below RED straight line
Indicatore Pine Script®