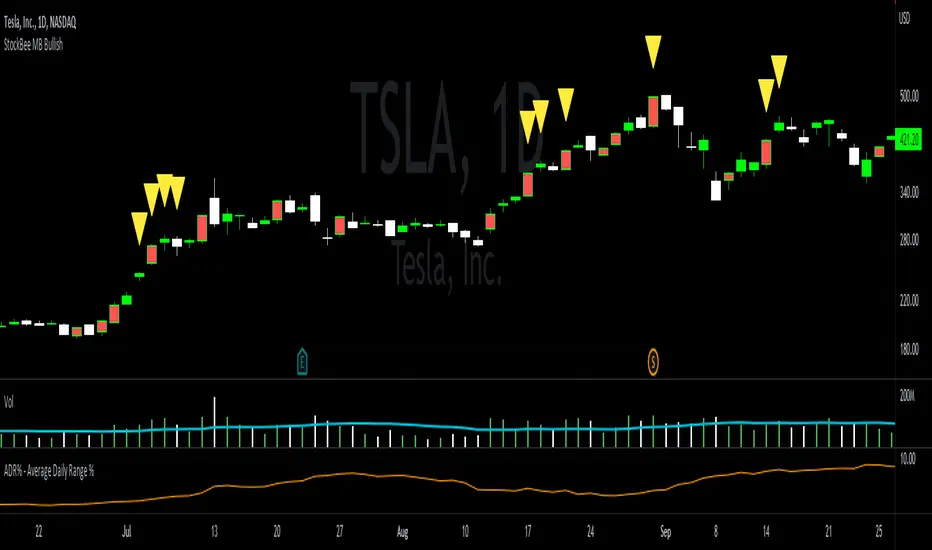
StockBee MB BullishStockBee Bullish Momentum Burst & 20% Plus Study Tool
The Stockbee bullish momentum burst study tool is helpful for practitioners of the momentum burst method who want to easily find historical momentum bursts and/or 20% plus gainers using Trading View. This script finds three specific breakouts that meet the below criteria:
4% Breakouts (Colors Candle Body)
1. Volume of the candle is greater than the previous candle volume.
2. The percent change of candle's price is greater than 4% from the previous candle close.
3. Current candle close is less than 30% from candle's high.
**Users can toggle 4% Breakouts on/off and also change candle body color in settings**
Dollar Breakouts (Colors Candle Body)
1. The change of candle's price is greater than $0.90 from the previous candle close.
2. Current candle close is less than 30% from candle's high.
** Dollar Breakout does not take volume into consideration **
**Users can toggle Dollar Breakouts on/off and also change candle body color in settings**
20% Plus Gainers (Displays Yellow Triangle Icon)
1. The change over five candles is greater than 20%.
**Users can toggle 20% plus label on/off, cannot change the label color**
This script also filters out any candle that gaps up and breaks down with a close above 4% the previous candle (Eliminates gap-ups that fade). This tool is meant to find and filter possible candidates. Not every marked candle is a great momentum burst trade. Users can look at 4% Breakouts, Dollar Breakouts, 20% Plus Gainers individually or any combination of the three.
This is helpful for Trading View users trading this specific setup.
Swing
StockBee 4% BreakoutThe Stockbee 4% Breakout script is a study tool for users who wants to do a deep dive on StockBee's 4% Breakout momentum burst method. This script will assist a specific group of traders who trade this method easily find historical momentum bursts. This script finds and colors red any candle body that meets the following criteria:
1. Volume of the candle is greater than the previous candle volume.
2. The percent change of candle's price is greater than 4% from the previous candle close.
3. Current candle close is less than 30% from candle's high.
This script also filters out any candle that gaps up and breaks down with a close above 4% the previous candle (Eliminates gap-ups that fade). This tool is meant to find and filter possible candidates. Not every marked candle is a great momentum burst trade.
This is very helpful for Trading View users trading this specific setup.

RSI Wave SignalsQuick Description: Smoothed RSI with optimized trailing moving average. Look for cross above or cross under signals for buy and sell orders respectively.
VIDYA moving average of RSI incorporated with "optimized trend tracker" system. Thanks to kivancozbilgic and anilozeksi for implementing this great idea on Tradingview. The indicator adds "1,000" to the RSI MA values for more natural and accurate percentage trailing.
Settings:
- Period MA is the moving average length of the blue line
- Trailing Percentage of MA adjusts the percentage (sort of) trailing level of the moving average.
- RSI Length adjusts the rsi length in calculation.
Trading Tips:
- System might be enhanced by taking signals only on "oversold" or "overbought" territories (i.e <~1020 or >~1080)
- Adjust position size of by 4 times of atr(length=14)
- Take 50% of position as profit when position reaches the 4*atr TP Level (breakeven)
- Let the rest ride.
- Best performing on short frequencies such as 1, 3, 5 mins.

SARWThis indicator aims to indicate the correlation between two assets(Current and Base), it does NOT show entries or help your chart analysis directly.
The main features of this Correlation indicator is :
Correlation type : Direct Correlation | Inverse Correlation | No Correlation
Correlation Percentage : as its name, it calculate the Correlation Percentage between Current and base assets if exist
How to use: Chose the base asset (default: bitcoin) and open any other chart to be the other -Current- asset
inputs:
Max Lookback length : how many candles will be included in the scan.
Swing intensity : How many candle should be counted to confirm a Swing, If you are confused leave it as its default.
Base Asset : The base asset to calculate the current asset correlation with.
Important Notes:
As I promised, the previous correlation indicator used each candle alone, while this one uses waves and swings.
The Current asset has more power over the base, because it compares the Base to current, but not the opposite((E.g. if you want to check if some coin have correlation with bitcoin, it's better to use bitcoin and put the other coin name in the input field)).
For any notes on the indicator to be edited, or for another indicator ideas please comment.

Swing ComparatorHere I bring you an array of methods to compare the swings and consistency between assets.
This indicator is excellent for swing traders and scalpers looking to maximize their profits by examining which of two closely related pairs provides greater price fluctuation during given period.
This indicator works against two assets, which are to be configured in settings.
This indicator has 5 particular plots for you to examine, each which can be considered for you to contemplate which pair for you to next perform a trade on.
First off, let's start with the blue.
The blue is simply a pearson correlation coefficient, thankfully now included in tradingview. This provides a value of 1 as values show to be close correlation, 0 showing no correlation, and -1 showing negative correlation - meaning an increase in one pair correlates to a decrease in another pair. This will turn green when greater than 0.975, showing a very strong relationship between the two pairs, and red when below -0.975. This is the only plot to be interpreted on a scale from -1 to +1.
Next, we have the purple and yellow background plots, followed by the white and green moving averages. Though similar, these are all slightly different.
For each of these 4 plots, a value greater than 0 indicates greater price swings for your Symbol #1, while a value less than 0 indicates greater price swings for Symbol #2.
These calculations are performed on a per bar basis, meaning you're likely going to be examining bars longer than what you'll normally be trading on. Use confluence, as well as your own judgement for this.
For example, if symbol #1 provides a bar with an open value 1% greater or less than close, providing a 1% swing on a given bar, but symbol #2 provides 2%, the indicator will fall down toward the negative, as Symbol #2 had the greater swing.
First, yellow focuses on only open/close bar values, and thus the body of the candlestick.
Purple, on the other hand, focuses on the wicks of the candle - thus, the high/low values. I've opted to make these two different values as a wick focuses on the embodiment within the time period, and body focuses on the open/close instant.
Next, the green is an extended EMA of the purple - High/Low ratio. This is important to examine trend overtime, and reduce unneeded noise.
Lastly, the white is simply difference in the standard deviation of the particular bars, between the two symbols you have selected. The tends to usually tie up with the green pretty well.
Considering this is going to by nature be very noisy datasets, I have included in settings the option to extend an EMA for everything. They have their default settings, but if you'd like to examine the trend without an EMA, feel free to set it to 1 to eliminate its effects.
I have additionally added the ability to introduce clipping, as well as scale the correlation coefficient to remain visible when examining very short term time scales. In the future, I hope to properly normalize all plots to remain within a -1 to +1 basis. Please be patient as I have multiple projects ongoing.
Suggestions and constructive criticism are very well encouraged.
Anyone is welcome to utilize this in their code, as well, i just ask you provide credit.
As you reduce to time frames less than a day, you will likely have to reduce the coefficient min/max closer to 0.025, or just hide it entirely.
TODO:
Make it look better. Sorry, folks.
Introduce latency between pairs.
Examine significance of a coefficient of determination
Remove static weights and introduce z-score and linear normalization.
Consider adding room for a 3rd pair. This could get ugly, however.

Swing Pivots High LowBINANCE:BTCUSDT
This indicator is an opensource merge of the built in 'Pivot Points High Low' and the most popular 'Swing-high-low-support-resistance' indicators. The original 'Pivot Points High Low' does not have extensions with better visibility, while the most popular 'Swing-high-low-support-resistance' has no source available. I've also added additional configurable alert conditions for Pivot High and Low Crossover/Crossunder.
Please read the official documentation for further information about the indicator.

Volatility ContractionVolatility Contraction is a strong trading setup for Positional Traders. It works on following time frame: Daily, Weekly and Monthly.

Swing EMAWhat is Swing EMA?
Swing EMA is an exponential moving average crossover-based indicator used for low-risk directional trading.
it's used for different types of Ema 20,50,100 and 200, 3 of them are plotted on chat 20,100,200.
100 and 200 Ema is used for showing support and resistance and it contains highlights area between them and its change color according to market crossover condition.
20 moving average is used for knowing Market Behaviour and changing its color according to crossover conditions of 50 and 20 Ema.
How does it work?
It contains 4 different types of moving averages 20,50,100, 200 out of 3 are plotted on the chart.
20 Ema is used for knowing current market behavior. Its changes its color based on the crossover of 50 Ema and 20 Ema, if 20 Ema is higher than 50 Ema then it changes its color to green, and its opposites are changed their color to red when 20 Ema is lower than 50 Ema.
100 and 200 Ema used as a support and resistance and is also contain highlighted areas between them its change their color based on the crossover if 100 Ema is higher than 200 Ema a then both of them are going to change color to Green and as an opposite, if 200 Ema is higher then 100 Ema is going to change its color to red.
So in simple word 100 and 200 Ema is used as support and resistance zone and 20 Ema is used to know current market behavior.
How to use it?
It is very easy to understand by looking at the example I gave where are the two different types of phrases. phrase bull phrase and bear phrase so 100 and 200 Ema is used as a support and resistance and to tell you which phrase is currently on the market on example there is a bull phrase on the left side and bear phrase on the right side by using your technical analysis you can find out a really good spot to buy your stocks on a bull phrase and too short on the bear phrase. 20 Ema is used as a knowing the current market behavior it doesn't make any difference on buying or selling as much as 100 Ema and 200 Ema.
Tips
Don't trade against the market.
Try trade on trending stocks rather than sideways stock.
The higher the area between 100 Ema and 200 Ema is the stronger the phrase.
Do Backtesting before real trading.
Enjoy Trading.

RSI Average Swing BotThis is a modified RSI version using as a source a big length(50 candles) and an average of all types of sources for candle calculations such as ohlc4, close, high, open, hlc3 and hl2.
In this case we are going to use a 0-1 scale for an easier calculation, where 0.5 is going to be our middle point.
Above 0.5 we consider a bullish possibility.
Below 0.5 we consider a bearish possibility.
I made a small example bot using that initial logic, together with 2 exit points for long or short positions.
If there are any questions, let me know !

Swing Dream - PAINT BARS | MA | EMA | DMA | VWAP | TABLE | ADR %- Swing Dream -
Script created for breakout-swing traders, in the style of QullaMaggie * , Dan Zanger, Oliver Kell, and Stockbee.
The following indicators are used by most successful breakout-swing traders such as mentioned above.
(As published) it contains:
Painted Bars, also known as inside/outside candles. Used for candle analysis and to determine breakout pivots & levels. For instance; use it in different timeframes and seek formations (ex, 3-1-2). For further inspiration, study Rob Smith's The Strat .
MA, Simple Moving Averages (Basic levels = 10,20,50,200). Use this indicator to define resistance/support areas as well as the overall long/swing-term trend. In breakout strategies such as EP, Flags, etc this can be used for trailing stops; an example, post-breakout, let the price ride the 20ma before exiting your position.
EMA, Exponential Moving Averages with periods inspired by Qullamaggie (10,20,65). Use this on shorter timeframes (ex, 1h) and for the same principles as MAs.
VWAP, Volume-Weighted Average Price. As for the previous, utilize this as a level indicator to find areas of resistance/support. Good for swing-trading as it implies whenever holders are profitable or not.
DMA, Displaced Moving Average (Horizontal). Personally, I use this a lot. Works very well for trailing stops (post breakout) and "bounce" areas. Choose your own offset and period.
ADR%, Average Daily Range Percentage. Displayed in the table and used to define a symbol's volatility. A very good tool for Qullamaggie-style trading. Personally, I try to find setups with over 6% ADR. Basic definition; low ADR% = Increased chance of a symbol to move slower and in smaller ranges. A higher value equals the opposite.
Table. A table with basic symbol-related information. Could save you plenty of time whenever you scan or search for new swing setups. Looking to add more features here.
Why should you use this script? Well, instead of having tens of different indicators, use this script and combine everything together with EP, Flag, or breakout principles. Suited for every plan, and more efficient in my opinion.
View settings to turn on/off different indicators.
* If you're looking for an introduction and further explanation of how Qullamaggie uses mentioned indicators, I could recommend checking out his website, stream, or participation in "Chat With Traders".
At last, I want to credit: @jkcqld @neolao @TheScrutiniser
This Script will get updated and improved.
// TechFille006

[DSPrated] Modified EMD for swing tradeModified Ehlers Empirical Mode Decomposition indicator for swing trade based on Butterworth 2nd order IIR filter
Description
This script is inspired by John Ehlers' TECHNICAL PAPERS - Truncating Indicators and Empirical Mode Decomposition. But instead of detecting trend it applies to finding swing regions.
Also here is suggested canonical DSP approach for designing coefficients for Butterworth 2nd order IIR filters - bandpass and lowpass.
Besides, truncated IIR filter with configurable length parameter is used. It worth mentioning, that although truncated filter is more robust than original IIR, it losses specified properties (bandpass) the more, the less is length parameter.
Butterworth Bandpass Infinite Impulse Response (IIR) Filter
This is the 2nd order Butterworth Bandpass Infinite Impulse Response (IIR) Filter based on the transform from the 1st order lowpass
Based on the example 8.8 on p476 from book Digital Signal Processing: A Practical Approach 2nd Edition by Emmanuel C. Ifeachor (Author), Barrie W. Jervis (Author)
It differs from Ehlers BandPass Filter only in the way you initialize input parameters. Here you can define cutoff periods of region of interest. For example on a timeframe, where one bar equals 1 hour you can define periods 18 and 22, which mean you'll see the swing intensity of price movement components within specified range.
Parameters
Source
Period 1 - cutoff period of bandpass begining
Period 2 - cutoff period of the end of bandpass
length - IIR truncation length
Concept of usage
Within specified bandpass this indicator eliminates the Trend line according to Ehlers EMD. The bandpass periods is recommended to choose accordingly to personal comfortable trading style and timeframe.
The trendline painted with 3 colors depending of the next modes:
up tend - green
cycling - black
downtrend - red
So the buy signal is generated when trend line in cycling mode and filtered component reaches it local minimum.
And the sell signal is generated when trend line in cycling mode and filtered component reaches it local maximum.
Secure long and short zones marked with color.
---
// TO DO
// - compare truncated and full version using signal generators
// - apply zero lag filter modification fordetectig ternd and swing peroids
// - implement strategy scripts
// - implement somewhat "true" EMD with sevral IMFs(intrinsic mode function)
// - better description?
// - parameter optimization
---
Please, feel free to report any issues and improvement suggestions.

Swing Multi Moving Averages Crypto and Stocks StrategySimple and efficient multi moving average strategy combined with risk management and time condition.
Indicators/ Tools used
Multi selection moving average type like SMA , EMA , SMMA , VWMA , VIDYA , FRAMA , T3 and much more
Limit 1 entry max per week, entry on monday exit on sunday or risk management tp/sl.
Rules for entry:
LONG:Close of the candle cross above the moving average while the previous close was below. All of this is happening during monday session.
SHORT:Close of the candle cross below the moving average while the previous close was above. All of this is happening during monday session.
Rules for exit:
We exit either on sunday or if we reach tp/sl levels.
Observations:
I recommend use the strategy 2 types, one for long and another for short, using different parameters since long and short movements behave differently.
For example for long we can use a shorter moving average longth and a higher tp/sl while for short we can use a bigger moving average length and a smaller tp/sl
If you have any questions let me know !

Swing VWAP Crypto and Stocks StrategyThis is a strategy designed for swing trading on markets such as crypto and stocks.
Its components are:
VWAP
Time Management
Risk management
Rules for entry:
We entry only on Monday, if our close of the candle crossed above VWAP
Rules for exit
We exit always on Sunday or if we either hit the TP/SL levels.
If you have any questions let me know

ICHIMOKU Crypto Swing AlertThis is a crypto swing alert for the strategy with the same name designed for timeframes bigger than 1h.
The main components are
ICHOMOKU
KDJ
Average High
Average Low
Rules for entry
For long: we have the ichimoku crosses between tenkan and baselines, we have a rising kdj line and at the same time we have a increase in the average high
For short: we have the ichimoku crosses between tenkan and baselines, we have a falling kdj line and at the same time we have an increase in the average low
Rules for exit
We exit when we have inverse conditions than the initial ones used for entry.
Caution
This strategy does not use a risk management, so be careful with it !
If you have any questions let me know !

Scalping Trading System ALERT Crypto and StocksThis is the alert version of the strategy with the same name.
Indicators
SImple Moving Average
Exponential Moving Average
Keltner Channels
MACD Histogram
Stochastics
Rules for entry
long= Close of the candle bigger than both moving averages and close of the candle is between the top and bot levels from Keltner . At the same time the macd histogram is negative and stochastic is below 50.
short= Close of the candle smaller than both moving averages and close of the candle is between the top and bot levels from Keltner . At the same time the macd histogram is positive and stochastic is above 50.
Rules for exit
We exit when we meet an opposite reverse order.
This strategy has no risk management inside, so use it with caution !

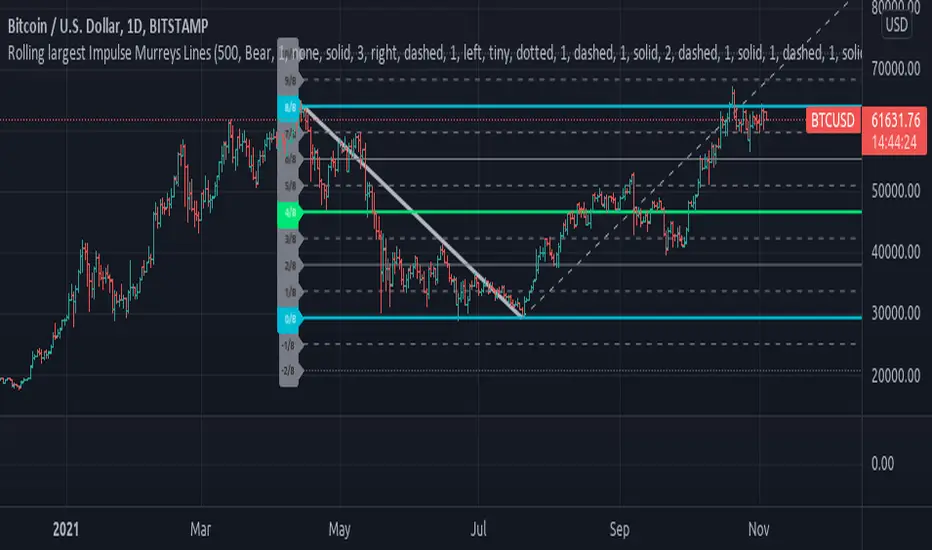
Rolling largest Impulse Murreys LinesExperimental:
Uses Kadane's max subarray sum algorithm to find the largest impulse within a window and draws Murrey's math lines based on that impulse.
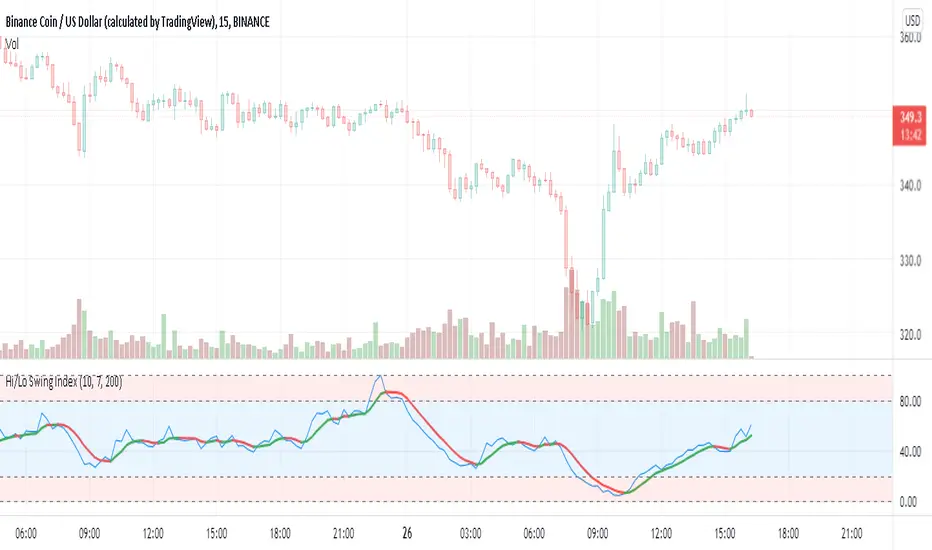
Hi/Lo Swing Index [by hajixde]Author: Hajixde
This indicator illustrates the High-to-Low variation. It works nicely on shorter time frames.
The index value is calculated based on the observation length (Memory Length). By changing this input, you can have a wider or shorter observation range.
MA Length is the moving average filter length, which smooths out the signal.
There is an additional smoothing function to make the output even smoother (Smoothing Length). Remember, that "Smoothing Length" is better to be less than "MA Length".
You may activate the trend direction.
Advanced OutSide with HMA and Klinger Forex Swing strategyThis is a swing forex strategy, adapted for big timeframes, such as 4h+.
For this example I adapted the strategy to EUR USD main forex pair.
Its components are:
Outside condition
Klinger Oscillator
Hull moving average
Rules for entry
For long: if current high is bigger than previous high and current is smaller than previous low and klinger is positive, close of the candle is above lsma and we have a bull candle.
For short: if current high is smaller than previous high and current is bigger than previous low and klinger is negative, close of the candle is below lsma and we have a bear candle.
Rules for exit
We exit when we have a reverse condition
We exit in case we hit the tp/sl based on % movement of the price.
If you have any questions, let me know !

Improved Bollinger Swing Strategy Stock NasdaqThis is an improved bollinger band strategy adapted to Nasdaq Index/Stocks.
The new update include a multiple logic calculation BB adapted for long and short, together with a risk management using movement in %.
Rules for entry
For long we have a crossover between the close and the lower band from the bb
For long we have a crossover between the close and the upper band from the bb
Rules for exit
We exit when we either find a reverse condition, or if we hit the take profit/stop loss levels.
If you have any questions, let me know !

Full Swing Gold Vwap Macd SMO StrategyThis is a full strategy designed for gold market using 12h timeframe chart.
Its components are:
VWAP monthly
SMO oscillator
MACD histogram
Rules for entry:
For long: when enter when close of the candle is above vwap monthly, current histogram is higher than the previous one and SMO oscillator is above 0
For long: when enter when close of the candle is below vwap monthly, current histogram is lower than the previous one and SMO oscillator is below 0
Rules for exit:
We exit the trade if we get a reverse condition.
We also exit the trade based on a risk management system, both for SL and TP using % movements.
If you have any questions let me know !

Crypto swing correlation RSI and SMAThis is a crypto swing strategy, designed for long term periods and correlated pairs with crypto market total(or other coins used as correlation, however I recommend total of crypto or btc)
Its components are:
RSI with a very length
Correlation candles
SMA 9
Rules for entry:
For long : RSI is above 51 level and going higher and close of the candle is above the SMA
For short :RSI is below 49 and going lower and close of the candle is below the SMA
Rules for exit:
We exit when we encountered an opposite condition than the entry one, or based on take profit/stop loss levels.
If you have any questions let me know !

Full Crypto Swing Strategy ALMA Cross with MACDThis is a full crypto swing strategy designed.
From my testing it looks like it perform the best on timeframes 4h +.
The below example has been adapted to BNB/USDT, using the entire period since 2017 until present day, with a comission of 0.03% ( which is the comission for the futures on binance).
Its components are :
ALMA Fast
ALMA Slow
MACD Histogram
Rules for entry
For long, we have a crossover of the fast alma with the slow one and the histogram is ascending.
For short, we have a crossunder of the fast alma with the slow one and the histogram is descending.
Rules for exit
We exit based on a risk management system for TP and SL, or when we receive an opposite condition than the initial one.
Regarding risk management
0.05 = 5% movement
2 = 200% movement
0.001 = 0.1% movement
If you have any questions, let me know !

DMI Swings (by Coinrule)The Directional Movement Index is a handy indicator that helps catch the direction in which the price of an asset is moving. It compares the prior highs and lows to draw three lines:
Positive directional line (+DI)
Negative directional line (-DI)
Average direction index (ADX)
DMI is simple to interpret. When +DI > - DI, it means the price is trending up. On the other hand, when -DI > +DI, the trend is weak or moving on the downside.
The ADX does not give an indication about the direction but about the strength of the trend.
Typically values of ADX above 25 mean that the trend is steeply moving up or down, based on the -DI and +D positioning. This script aims to capture swings in the DMI, and thus, in the trend of the asset, using a contrarian approach.
ENTRY
-DI is greater than +DI
ADX is greater than 45
EXIT
+DI is greater than -DI
ADX is greater than 45
Trading on high values of ADX, the strategy tries to spot extremely oversold and overbought conditions. Values of ADX above 45 may suggest that the trend has overextended and is may be about to reverse.
Our backtests suggest that this script performs well for very short-term scalping strategies on low time frames, such as the 1-minute.
The script considers a 0.1% trading fee to make results more realistic to those you can expect from live market conditions. So realistically, live results should be similar to backtested results.
You can plug this script directly into your crypto exchange using TradingView Signals on Coinrule.
Trade Safely!
