Live Position Sizer (LPS)Description (EN)
(Magyar leíráshoz görgess lejjebb!)
Live Position Sizer (LPS) is a discretionary trading utility designed to visualize risk, reward, and position size directly on the chart in real time.
The indicator draws a TradingView-style long or short position box and calculates the required position size based on your defined capital, maximum risk, stop-loss distance, and a user-defined lot conversion factor.
LPS is intended strictly as a decision-support and risk management tool. It does not place trades or generate automated signals.
Core features:
Automatic Long / Short position visualization
Dynamic Entry, Stop Loss, and Take Profit levels
Real-time position size calculation
Configurable Risk/Reward ratio
Fully customizable colors, transparency, and line styles
Clean, minimal on-chart labels showing direction, RR, and lot size
Only one active position box at a time for a clutter-free chart
Position sizing logic:
TradingView internally calculates position size in units, not broker-specific lots.
To bridge this difference, LPS uses a user-defined “Units per 1 Lot” multiplier.
Examples:
Forex (standard lot): 100000
Gold (XAUUSD): 1 or 100 (broker dependent)
Indices (e.g. NAS100): 1
The indicator first calculates the position size in TradingView units and then converts it to lots using this multiplier.
The displayed lot size is rounded to 0.01 lots.
Stop Loss logic:
The Stop Loss level is derived from the High or Low of a selectable previous candle.
Increasing the bar-back value places the Stop Loss further away, which:
increases stop distance
reduces position size for the same risk
Intended use:
Manual / discretionary trading
Risk management and position sizing
Trade planning and visualization
Educational purposes
Important notes:
This indicator does not execute trades
No alerts or automation by default
Lot size and contract specifications vary by broker
Always verify the exact lot or contract size with your broker before trading
------------------------------------
Description (HU)
A Live Position Sizer (LPS) egy diszkrecionális kereskedést támogató segédindikátor, amely valós időben jeleníti meg a kockázatot, a célárat és a pozícióméretet közvetlenül a charton.
Az indikátor TradingView-stílusú long vagy short pozíció boxot rajzol, és kiszámolja a szükséges pozícióméretet a megadott tőke, maximális kockázat, stop-loss távolság és egy felhasználó által definiált LOT szorzó alapján.
Az LPS nem stratégia, kizárólag döntéstámogató és kockázatkezelési eszköz.
Fő funkciók:
Automatikus Long / Short pozíció megjelenítés
Entry, Stop Loss és Take Profit szintek vizuális ábrázolása
Valós idejű pozícióméret számítás
Állítható Risk/Reward arány
Teljesen testreszabható színek, átlátszóság és vonalstílus
Letisztult chart label (irány, RR, lot méret)
Egyszerre csak egy aktív pozíció box
Pozícióméretezési logika:
A TradingView belsőleg egységekben (units) számol, nem bróker-specifikus LOT-okban.
Ennek kezelésére az LPS egy „Units per 1 Lot” beállítást használ.
Példák:
Forex standard lot: 100000
Arany (XAUUSD): 1 vagy 100 (brókertől függ)
Indexek (pl. NAS100): 1
Az indikátor először TradingView egységekben számol, majd ezt átváltja LOT-ra a megadott szorzó segítségével.
A kijelzett LOT méret 0.01-re van kerekítve.
Stop Loss logika:
A Stop Loss szint a kiválasztott korábbi gyertya high vagy low értékéből kerül meghatározásra.
Nagyobb bar-back érték:
távolabb helyezi a stopot
azonos kockázat mellett kisebb pozícióméretet eredményez
Ajánlott felhasználás:
Manuális, diszkrecionális kereskedés
Kockázatkezelés és pozícióméretezés
Trade tervezés
Oktatási célok
Fontos megjegyzések:
Az indikátor nem köt automatikusan
Alapértelmezetten nincs alert vagy automatizmus
A LOT és contract méret brókerenként eltérhet
Kereskedés előtt mindig ellenőrizd a pontos LOT / contract specifikációt a brókerednél
Take

Take America Back Version 1.0So basically, the when the price goes down a little, it buys, and when it goes up a little it buys. The only indicators are account balances, and the price, that’s it. Now I wish that Pine Script had a function or variable in which I could recall the balances of specific portions of the portfolio, but it doesn’t. So, I had to improvise. Now for this to work accurately, all of the money needs to be in the “base” side before the bot can begin. Now, the thing about this is that it does not re-invest the amount that is “saved” to all but guarantee the balance will go up. However, as this goes up it will not add up as quickly in order to allow more wiggle room so that the bot does not work itself into a corner. If you want to keep some of your base, enter how much you want to keep it in the initial “saved” setting, as long as you allow at least enough to be equal to the default quantity value. Also, I recommend you setting the pyramiding setting to the result of the base value divided by the default quantity value. The default quantity value is how much you invest, measured in the base currency.
This would have been sooooo much easier if pine script could allow me to recall specific balances, but maybe a future one will.
Finally, THIS is why I made this program, I wanted to create something that would prevent the little ones from being stepped on by the big players who don't always play fair.
Besides, cryptocurrencies were made in response to the 2008 financial meltdown that caused a global recession. This decentralized currency is not just the money of the banks, the corporations, or the governments, but the money of the people. Use this tool to level the massive wealth inequality in my country and take America Back.
I will post more links and updates later once my reputation score goes up. I will discuss more about what influenced me to make this program and as some advise and possible future improvements as well.

Triple ATR multiplier - 3 ATR Values in OneHere you can choose to plot 3 different ATR values in 1 window. I use this indicator to get the values of my stop loss and take profits.
You can change the multiplier value for each ATR Line and the length of the base ATR.
Ty

ATR with Take and StopThis simple indicator will plot the take profit and stop loss values based on the ATR indicator.
It's possible to set how many times the ATR value will be applied to the closing price and
what trade type is used, Long or Short.

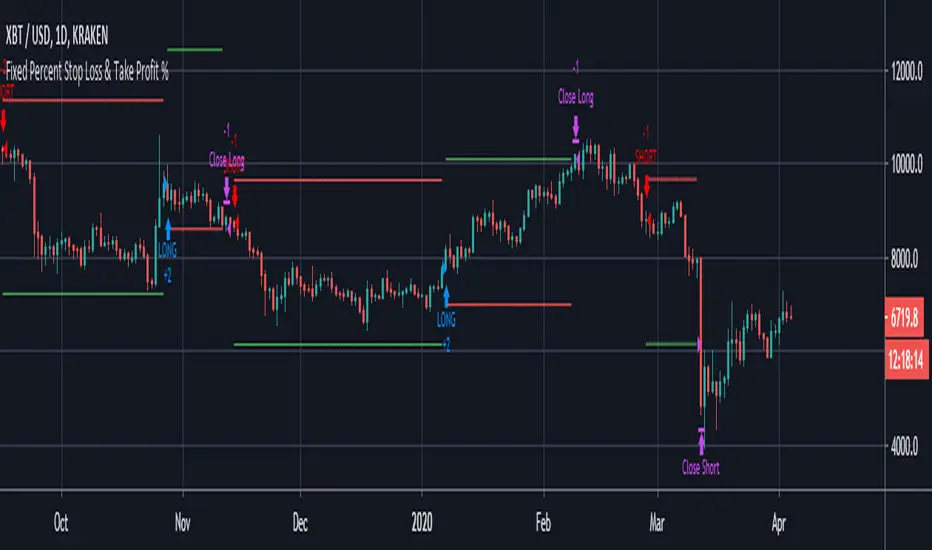
Fixed Percent Stop Loss & Take Profit % - For Study Scripts===========
Fixed Percent Stop Loss & Take Profit % - { FOR STUDY SCRIPTS! }
===========
A neat example of how to set up Fixed Stops and Take Profit as a percent of the entry price - This is for setting Alerts within your own Study Script for when either your SL or TP get hit.
Yup, that's about it!
You can ignore the actual entry/exit orders - they're based on a simple MA cross and are therefore NOT relevant, NOT profitable and NOT recommended!
You should be using this code as a way of adding Stops and Takes to your own scripts - hope it helps!
Set your "Open Long/Short" Alerts to be triggered "Once per Bar Close" - Set your "SL/TP" Alerts to trigger "Once per Bar".
--
We wrote this with a bit of a rush on! ~ If you spot any mistakes/bugs just let us know and we'll get round to them asap!
-----------
Good Luck and Happy Trading!

Fixed Percent Stop Loss & Take Profit %===========
Fixed Percent Stop Loss & Take Profit %
===========
A neat example of how to set up Fixed Stops and Take Profit as a percent of the entry price.
Yup, that's about it!
You can ignore the actual entry/exit orders - they're based on a simple MA cross and are therefore NOT relevant, NOT really profitable and NOT recommended!
You should be using this code as a way of adding Stops and Takes to your own scripts - hope it helps!
-----------
Good Luck and Happy Trading!
Scripting Tutorial A - TManyMA - StopsThis script is for a triple moving average strategy where the user can select from different types of moving averages, price sources, lookback periods and resolutions.
Features:
- 3 Moving Averages with variable MA types, periods, price sources, resolutions and the ability to disable each individually.
- Crossovers are plotted on the chart with detailed information regarding the crossover (Ex: 50 SMA crossed over 200 SMA )
- Forecasting available for all three MAs. MA values are forecasted 5 values out and plotted as if a continuation to the MA.
- Forecast bias also applies to all forecasting. Bias means we can forecast based on an anticipated bullish, bearish or neutral direction in the market.
- To understand bias, please read the source code, or if you can't read the code just send me a message on here or Twitter. Twitter should be linked to my profile.
- Ribbons added and on by default. Optional setting to disable the ribbons. 5 ribbons between MA1 and MA2 and another 5 between MA2 and MA3.
- Ribbons are alpha-color coded based on their relation to their default MAs.
- Ribbons are only visible between MAs if the MAs being compared share the same Type, Resolution, and Source because there is no way to consolidate those three in a simple manner.
- Ribbon values are calculated based on calculated MA Periods between the MAs.
- Converted the existing study into a strategy.
- Strategy only enters long positions with a market order when MA crossovers occur.
- Strategy exits positions when crossunders occur.
- Trades 100% of the equity with one order/position by default.
- Ability to disable trading certain crosses with input checks.
- Ability to exit trades with a take profit or stop loss.
- User input to allow quick changes to the take profit or stop loss percentages.
This script is meant as an educational script with well-formatted styling, and references for specific functions.
*** PLEASE NOTE - THIS STRATEGY IS MEANT FOR LEARNING PURPOSES. DEPENDING ON IT'S CONFIGURATION IT MAY OR MAY NOT BE USEFUL FOR ACTUAL TRADING. THE STRATEGY IS NOT FINANCIAL ADVICE ***
