WaveTrend Divergences, Candle Colouring and TP Signal [LuciTech]WaveTrend is a momentum-based oscillator designed to track trend strength, detect divergences, and highlight potential take-profit zones using Bollinger Bands. It provides a clear visualization of market conditions to help traders identify trend shifts and exhaustion points.
The WaveTrend Oscillator consists of a smoothed momentum line (WT Line) and a signal line, which work together to indicate trend direction and possible reversals. When the WT Line crosses above the signal line, it suggests bullish momentum, while crossing below signals bearish momentum.
Candle colouring changes dynamically based on WaveTrend crossovers. If the WT Line crosses above the signal line, candles turn bullish. If the WT Line crosses below the signal line, candles turn bearish. This provides an immediate visual cue for trend direction.
Divergence Detection identifies when price action contradicts the WaveTrend movement.
Bullish Divergence appears when price makes a lower low, but the WT Line forms a higher low, suggesting weakening bearish pressure.
Bearish Divergence appears when price makes a higher high, but the WT Line forms a lower high, indicating weakening bullish pressure.
Plus (+) Divergences are stronger signals that occur when the first pivot of the divergence happens at an extreme level—above +60 for bearish divergence or below -60 for bullish divergence. These levels suggest the market is overbought or oversold, making the divergence more significant.
Bollinger Band Signals highlight potential take-profit zones by detecting when the WT Line moves beyond its upper or lower Bollinger Band.
If the WT Line crosses above the upper band, it signals stretched bullish momentum, suggesting a possible pullback or reversal.
If the WT Line crosses below the lower band, it indicates stretched bearish momentum, warning of a potential bounce.
How It Works
The WaveTrend momentum calculation is based on an EMA-smoothed moving average to filter out noise and provide a more reliable trend indication.
The WT Line (momentum line) fluctuates based on market momentum.
The signal line smooths out the WT Line to help identify trend shifts.
When the WT Line crosses above the signal line, it suggests buying pressure, and when it crosses below, it indicates selling pressure.
Divergences are detected by comparing pivot highs and lows in price with pivot highs and lows in the WT Line.
A pivot forms when a local high or low is confirmed after a certain number of bars.
The indicator tracks whether price action and the WT Line are making opposite movements.
If a divergence occurs and the first pivot was beyond ±60, it is marked as a Plus Divergence, making it a stronger reversal signal.
Bollinger Bands are applied directly to the WT Line instead of price, identifying when the WT Line moves outside its volatility range. This helps traders recognize when momentum is overstretched and a potential reversal or retracement is likely.
Settings
Channel Length (default: 8) controls the period used to calculate the WT Line.
Average Length (default: 16) smooths the WT Line for better trend detection.
Divergences (on/off) enables or disables divergence plotting.
Candle colouring (on/off) applies or removes trend-based candle colour changes.
Bollinger Band Signals (on/off) toggles take-profit signals when the WT Line crosses the bands.
Bullish/Bearish colours allow customization of divergence and signal colours.
Interpretation
The WaveTrend Oscillator helps traders assess market momentum and trend strength.
Crossovers between the WT Line and signal line indicate potential trend reversals.
Divergences warn of weakening momentum and possible reversals, with Plus Divergences acting as stronger signals.
Bollinger Band Crosses highlight areas where momentum is overstretched, signaling potential profit-taking opportunities.
Takeprofitsignal

Trend Trader-Remastered StrategyOfficial Strategy for Trend Trader - Remastered
Indicator: Trend Trader-Remastered (TTR)
Overview:
The Trend Trader-Remastered is a refined and highly sophisticated implementation of the Parabolic SAR designed to create strategic buy and sell entry signals, alongside precision take profit and re-entry signals based on marked Bill Williams (BW) fractals. Built with a deep emphasis on clarity and accuracy, this indicator ensures that only relevant and meaningful signals are generated, eliminating any unnecessary entries or exits.
Please check the indicator details and updates via the link above.
Important Disclosure:
My primary objective is to provide realistic strategies and a code base for the TradingView Community. Therefore, the default settings of the strategy version of the indicator have been set to reflect realistic world trading scenarios and best practices.
Key Features:
Strategy execution date&time range.
Take Profit Reduction Rate: The percentage of progressive reduction on active position size for take profit signals.
Example:
TP Reduce: 10%
Entry Position Size: 100
TP1: 100 - 10 = 90
TP2: 90 - 9 = 81
Re-Entry When Rate: The percentage of position size on initial entry of the signal to determine re-entry.
Example:
RE When: 50%
Entry Position Size: 100
Re-Entry Condition: Active Position Size < 50
Re-Entry Fill Rate: The percentage of position size on initial entry of the signal to be completed.
Example:
RE Fill: 75%
Entry Position Size: 100
Active Position Size: 50
Re-Entry Order Size: 25
Final Active Position Size:75
Important: Even RE When condition is met, the active position size required to drop below RE Fill rate to trigger re-entry order.
Key Points:
'Process Orders on Close' is enabled as Take Profit and Re-Entry signals must be executed on candle close.
'Calculate on Every Tick' is enabled as entry signals are required to be executed within candle time.
'Initial Capital' has been set to 10,000 USD.
'Default Quantity Type' has been set to 'Percent of Equity'.
'Default Quantity' has been set to 10% as the best practice of investing 10% of the assets.
'Currency' has been set to USD.
'Commission Type' has been set to 'Commission Percent'
'Commission Value' has been set to 0.05% to reflect the most realistic results with a common taker fee value.

Logical Trading Indicator V.1Features of the Logical Trading Indicator V.1
ATR-Based Trailing Stop Loss
The Logical Trading Indicator V.1 utilizes the Average True Range (ATR) to implement a dynamic trailing stop loss. You can customize the sensitivity of your alerts by adjusting the ATR Multiple and ATR Period settings.
Higher ATR Multiple values create wider stops, while lower values result in tighter stops. This feature ensures that your trades are protected against adverse price movements. For best practice, use higher values on higher timeframes and lower values on lower term timeframes.
Bollinger Bands
The Logical Trading Indicator V.1 includes Bollinger Bands, which can be customized to use either a Simple Moving Average (SMA) or an Exponential Moving Average (EMA) as the basis.
You can adjust the length and standard deviation multiplier of the Bollinger Bands to fine-tune your strategy. The color of the basis line changes to green when price is above and red when price is below the line to represent the trend.
The bands show a range vs a single band that also represents when the price is in overbought and oversold ranges similar to an RSI. These bands also control the take profit signals.
You also have the ability to change the band colors as well as toggle them off, which only affects the view, they are still active which will still fire the take profit signals.
Momentum Indicator
Our indicator offers a momentum filter option that highlights market momentum directly on the candlesticks, identifying periods of bullish, bearish, or consolidation phases. You can enable or disable this filter as needed, providing valuable insights into market conditions.
By default, you will see the candlestick colors represent the momentum direction as green or red, and consolidation periods as white, but the filter on the BUY and SELL signals is not active. The view options and filter can be toggled on and off in the settings.
Buy and Sell Signals
The Logical Trading Indicator V.1 generates buy and sell signals based on a combination of ATR-based filtering, Bollinger Band basis crossover, and optional momentum conditions if selected in the settings. These signals help you make informed decisions about when to enter or exit a trade. You can also enable a consolidation filter to stay out of trades during tight ranges.
Basically a BUY signal fires when the price closes above the basis line, and the price meets or exceeds the ATR multiple from the previous candle length, which is also editable in the settings.
If the momentum filter is engaged, it will not fire BUY signals when in consolidation periods. It works just the opposite for SELL signals.
Take Profit Signals
We've integrated a Take Profit feature that helps you identify points to exit your trades with profits. The indicator marks Long Take Profit when prices close below the upper zone line of the Bollinger Bands after the previous candle closes inside the band, suggesting an optimal point to exit a long trade or consider a short position.
Conversely, Short Take Profit signals appear when prices close above the lower zone after the previous candle closes inside of it, indicating the right time to exit a short trade or contemplate a long position.
Alerts for Informed Trading
The Logical Trading Indicator V.1 comes equipped with alert conditions for buy signals, sell signals, take profit points, and more. Receive real-time notifications to your preferred devices or platforms to stay updated on market movements and trading opportunities.

Buy/Sell Toolkit (Expo)█ Overview
The Buy/Sell Toolkit is a comprehensive trading tool designed to provide a holistic approach to trading. It brings together essential trading indicators and features in one place, simplifying the trading process and offering valuable insights into the market.
The indicator serves as an all-inclusive solution for traders seeking in-depth technical insights. While the Buy/Sell Toolkit can be utilized alongside other technical analysis methods, it can also be used as a standalone toolkit, adaptable to any trading style. In addition, each feature is thoughtfully integrated because not all technical indicators are suitable for every market condition or trading style.
The Buy/Sell toolkit works in any market and timeframe for discretionary analysis and includes many features:
█ Features
Buy/Sell signals: This feature provides real-time Buy/Sell trading signals for any market and timeframe. These signals are based on the trend.
Contrarian Signals: This feature provides real-time contrarian signals to take a position against the prevailing market trend.
Ultimate Trend: This feature assists in identifying the overall trend of the market, recognizing whether the market is in an uptrend, downtrend, or sideways.
Trend Advisor: The Trend Advisor helps traders understand the trend's strength, duration, and direction.
Trend Reversal: This feature identifies potential points where the current market may reverse within a trend. It's basically a trend-following line based on reversal calculation; it helps traders catch trend continuation setups.
Momentum Average: This indicator measures the rate of change in prices to identify the strength of the current trend. It can be beneficial for spotting potential price breakouts or warning of a market slowdown and pullbacks.
Take Profit Points: This feature suggests optimal points to exit a trade and lock in profits. It determines these points by using various factors such as volatility, support and resistance levels, and historical price movements.
Candle Coloring, Arithmetic Candlesticks, including Arithmetic Heikin Ashi: This feature provides an excellent visual aid to assist traders in recognizing patterns, identifying trends, and optimizing their trading strategies. The Arithmetic Candlesticks help smooth out price volatility and identify market trends more clearly.
Reversal Cloud: This innovative feature provides a graphical representation of potential price reversal zones. The cloud helps traders visualize where the price might reverse its trend.
Trend Cloud: Similar to the Reversal Cloud, this feature visualizes the prevailing market trend, making it easy for traders to understand the direction of the market at a glance.
Signal Optimizer: The Signal Optimizer is a powerful tool that optimizes the Buy/Sell and contrarian signals based on win-rate or performance. It automatically applies the best settings to the signals, freeing traders from the task of constantly adjusting them. This helps traders to get the most reliable signals automatically, enhancing their trading efficiency.
█ How to use the Buy/Sell Toolkit?
Here are a few illustrative examples to provide traders with a better understanding of the Toolkit's practical usage. These examples showcase the combination of features, but it's important to note that they serve as demonstrations, and we encourage traders to explore and adapt the features to align with their unique trading styles.
Buy/Sell Signals & Take Profit
Optimized Buy/Sell signals & Candle Color + Trend Advisor + Reversal Cloud
Contrarian Signals & Take Profit
,with Reversal Cloud
Optimized Contrarian Signals & Ultimate Trend & Reversal Cloud
Trend Cloud
Filter signals with Trend Cloud
█ Why is this Buy/Sell Toolkit Needed?
The Buy/Sell Toolkit is an exceptional tool for traders because it consolidates several critical trading indicators into a single, user-friendly platform. The Toolkit's holistic approach to market analysis can enhance decision-making, reduce guesswork, and improve overall trading performance. Additionally, it allows traders to customize their approach according to the market conditions and their trading style.
The Toolkit's automated features, such as the Signal Optimizer, save time and effort, making it easier for both new and experienced traders. In addition, its comprehensive suite of features ensures traders have all the information they need to make informed trading decisions. All these features make the Buy/Sell Toolkit a powerful ally in any trader's arsenal.
Here's why this Toolkit is essential:
Comprehensive Market Analysis: The Toolkit offers a wide range of indicators and tools for comprehensive market analysis, from trend detection to momentum analysis. This reduces the need for multiple tools and allows for a more efficient trading process. By providing a host of indicators like Buy/Sell signals, Contrarian Signals, Trend Analysis, and Momentum Average, the Toolkit helps traders make well-informed decisions based on comprehensive data and trend analysis.
Automation and Time-Saving: The Signal Optimizer automatically applies the best settings to the signals based on win rate or performance. This saves time and ensures the signals' reliability, reducing, it makes the trading process efficient and hassle-free.
Versatility: The Toolkit is versatile and can be used for various financial markets, including stocks, forex, commodities, or cryptocurrencies. Regardless of the market you trade in, the Buy/Sell Toolkit has something to offer.
Visual Tools: The Toolkit provides visual tools like Reversal Cloud, Trend Cloud, Trend lines, Candle coloring, and much more, which are excellent for visualizing market trends and potential reversal zones. This can make the process of understanding market movements more intuitive and less intimidating, especially for novice traders.
Confirmation: By using multiple indicators in conjunction with each other, traders can confirm signals and improve the accuracy of their trades.
Learning and Development: The Toolkit serves as an excellent resource for both novice and experienced traders to learn about different trading indicators, how they interact, and how to use them effectively.
█ Any Alert Function Call
This function allows traders to combine any feature and create customized alerts. These alerts can be set for various conditions and customized according to the trader's strategy or preferences.
█ How are the features calculated? - Overview
The Toolkit combines many of our existing premium indicators and new technical analysis algorithms to analyze the market. This overview covers how the main features are calculated.
Buy/Sell
The core function calculates the Exponential Weighting for a given time series X over a period T. The time series is based on absolute price changes. It focuses on the magnitude of price changes from one period to the next, irrespective of the direction (up or down). This type of time series can be used to measure the volatility of a price series, as it quantifies the size of price movements. It's useful in scenarios where the direction of the change is not as important as the magnitude of the change.
Contrarian Signals
Our contrarian signals are based on deviation from the expected range value. The algorithm quantifies the amount of variation or dispersion in a set of trading ranges. Non-expected values are the fundamental core of the signal generation process.
Ultimate Trend
The Ultimate trend calculates an adaptive smoothing momentum function by first determining the directional price movement and then applying smoothing to the positive and negative price changes. It then uses these values to calculate a form of Variable Moving Average (VMA), where the smoothing factor is adjusted based on a normalized measure of the relative difference between the Positive and Negative Directional values.
Trend Advisor
It's a form of Moving Averages that are applied to the price chart using three different weighting functions, simple weighting, price volatility smoothing constant weighting, and the traditional EMA weighting function.
Trend Reversal and Cloud
The function uses the information on how much the current price compared to the relative historical price fluctuates over a specific period and automatically updates its equilibrium value at new price changes.
Momentum Average
Essentially, it uses a modified version of the relative rate of change over a certain period.
Take Profit
The take profit uses similar range price functions as the contrarian signals, where a take profit signal is triggered at extremely abnormal values.
Candles
Note, Using and Backtesting on non-standard charts produces unrealistic results since it does not represent the closing price. The candles are based on a smoothing process that finds the best smoothing coefficient for the current data, using close as time series.
█ In conclusion , The Buy/Sell Toolkit serves as a comprehensive, user-friendly, and efficient trading assistant. It brings automation and intelligent data play-by-play to your fingertips, making it an essential tool for anyone serious about trading.
-----------------
Disclaimer
The information contained in my Scripts/Indicators/Ideas/Algos/Systems does not constitute financial advice or a solicitation to buy or sell any securities of any type. I will not accept liability for any loss or damage, including without limitation any loss of profit, which may arise directly or indirectly from the use of or reliance on such information.
All investments involve risk, and the past performance of a security, industry, sector, market, financial product, trading strategy, backtest, or individual's trading does not guarantee future results or returns. Investors are fully responsible for any investment decisions they make. Such decisions should be based solely on an evaluation of their financial circumstances, investment objectives, risk tolerance, and liquidity needs.
My Scripts/Indicators/Ideas/Algos/Systems are only for educational purposes!
Script a pagamento

OH2B Take Profit IndicatorOH2B Trading Indicator
The Take-Profit Indicator gives you exit points for taking profits based on the Average Directional Index and Relative Strength Index.
It also gives you possible swing-high and swing-low in a trend .
The OH2B Trading Indicator is an indicator that gives you entry points for BUY and SELL based on Trend Channel and Ema-Crossover.
Both indicators work better in tandem with the best result.
Trading with Both Indicators
Orange Zone : Wait for the next signal from OH2B Trading Indicator.
The OH2B Trading Indicator gives you entry points for BUY or SELL .
When the ema1 crosses above ema2, the trend channel will be painted GREEN in color, and a BUY signal will appear. = BUY
When the ema1 crosses below ema2, the trend channel will be painted RED in color, and a SELL signal will appear. = SELL
When a BUY or SELL signal appears on the chart, don't rush into any trade.
Please allow a few hours for confirmation of signals .
To take profit, please follow the Take-Profit Indicator at the bottom.
RED dots are the Take-Profit targets for the BUY (long) signal
GREEN dots are the Take-Profit targets for the SELL (short) signal
*After taking profit, please set a Stoploss to at least break-even level to protect your profits.
When the price enters the Orange Zone again, you may close your trade and wait for the next signal.
If you like to keep your positions at Orange Zone, please remember to set a stop-loss alert when an opposite signal pops up on the chart.
Often the price goes to the Trendline after the signal, so keep some funds to increase the position or even open all position near the Trendline , or use it for re-enter with SL after you closed position on TPs.

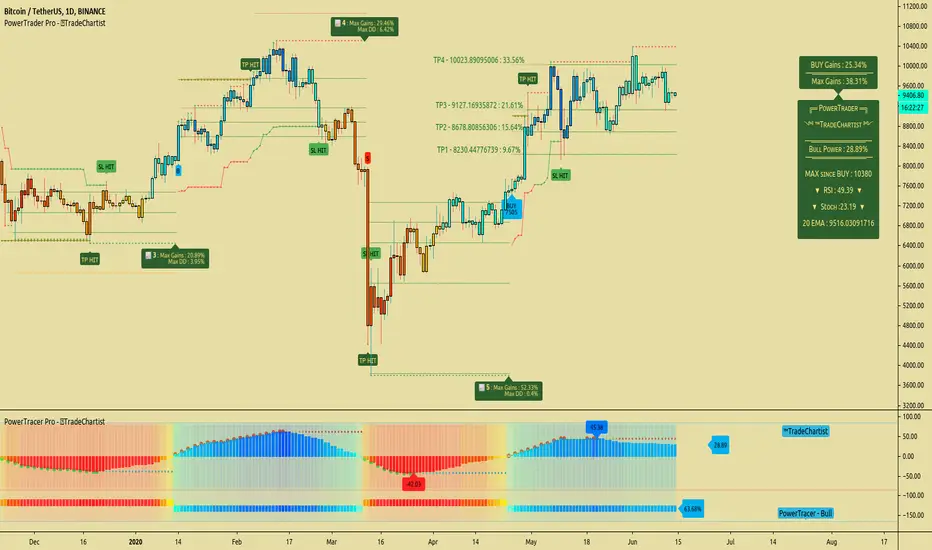
TradeChartist PowerTrader ProTradeChartist PowerTrader Pro is a versatile Signal generator and Signal plotter on the main price chart based on signals from other compatible scripts like TradeChartist PowerTracer Pro . This elegantly designed script plots the following based on user preference.
BUY and SELL signals based on external compatible signal source
Automatic Targets if opted from settings
Trailing or Fixed Stop Loss based on user input
Take Profit % and Quantity to trade based on user input
PowerTrader Dashboard displaying 14 period RSI, Stoch and 20 EMA
Real-Time Gains Tracker displaying Max Gains and open PnL
Past Performance labels displaying Max Gains and Max Drawdown for each trade
Higher Highs since BUY and Lower Lows since SELL
Once the external Signal is connected to the script, the results based on signal backtester ( TradeChartist PowerTracer Pro Backtester ) can be used to optimise the settings to generate plots and also to set Alerts for the following.
Long and Short Signals
Long and Short Stop Loss Hit
Long and Short TP Hit
Move up/down Trailing SL
To create alerts, the user must choose PowerTrader Pro from the alert condition drop-down and choose the required alert. Since the signals are generated only after confirmation, "Once per bar" must be used for Alerts.
===================================================================================================================
This is not a free to use indicator. Get in touch with me (PM me directly if you would like trial access to test the indicator)
Premium Scripts - Trial access and Information
Trial access offered on all Premium scripts.
PM me directly to request trial access to the scripts or for more information.
===================================================================================================================
Trend analysis - Take Profit (Expo)Trend analysis - Take Profit (Expo)
DESCRIPTION
Trend analysis - Take Profit (Expo) indicator is developed to visualize ‘Lock In Profits -points' in trends. It’s a necessity for a professional trader to continuously ‘Lock In Profit’ in order to grow their balance and to reduce their risk. In fact, research shows that exits have more impact on the results than any other factor (Tharp, 2006). So when the indicator shows a ‘TP’ - point, start to lock in some of your profit and continuously do so on every TP - point and exit the trade when a circle is shown.
The indicator does also visualizes the current trend by the color of the cloud. Green color = positive trend. Red color = negative trend.
The professional trader will have the possibility to adjust the sensitivity of the TP - point as well as the length of the trend calculation.
HOW TO USE
1. Use this indicator to identify when to Lock In Profits in trends.
2. Use the indicator to identify trends.
3. Use the indicator to identify a trend shift.
INDICATOR IN ACTION
BTCUSD
BTCUSD
EURUSD
BRENT
EURGBP
The indicator works with RENKO, HEIKIN ASHI and with KAGI charts as well.
I hope you find this indicator useful, and please comment or contact me if you like the script or have any questions/suggestions for future improvements. Thanks!
I will continue to work on this indicator, so please share your experience and feedback with me so that I can continuously improve it. Thanks to everyone that have contacted me regarding my scripts. Your feedback is valuable for future developments!
ACCESS THE INDICATOR
• Contact me on TradingView or use the links below
-----------------
Disclaimer
Copyright by Zeiierman.
The information contained in my scripts/indicators/ideas does not constitute financial advice or a solicitation to buy or sell any securities of any type. I will not accept liability for any loss or damage, including without limitation any loss of profit, which may arise directly or indirectly from use of or reliance on such information.
All investments involve risk, and the past performance of a security, industry, sector, market, financial product, trading strategy, or individual’s trading does not guarantee future results or returns. Investors are fully responsible for any investment decisions they make. Such decisions should be based solely on an evaluation of their financial circumstances, investment objectives, risk tolerance, and liquidity needs.
My scripts/indicators/ideas are only for educational purposes!

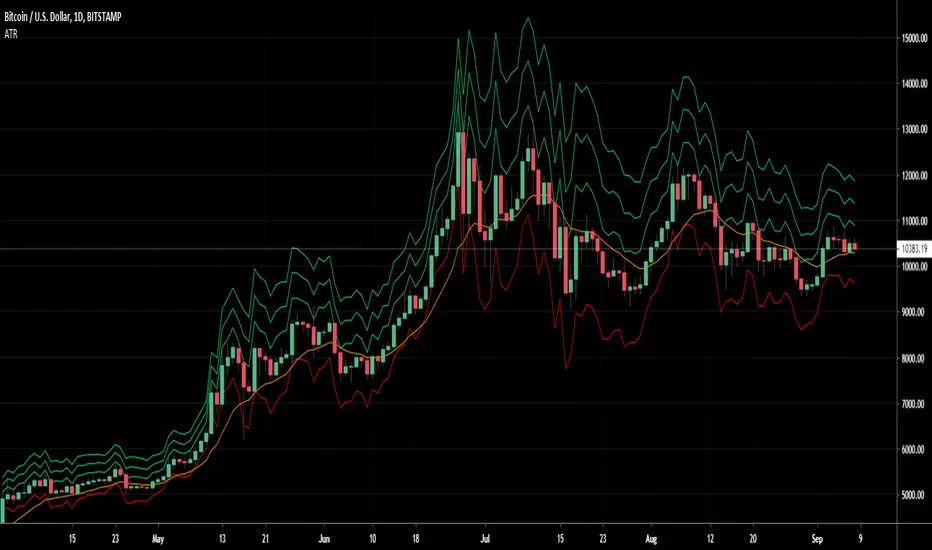
Average True Range Take profit (ATR)Average True Range Take Profit
An objective method of determining an initial Take Profit and Stop Loss, based on true market volatility and not arbitrary price levels.
Take Profit Levels and Stop Loss Levels are calculated based on multiples of Average True Range
Features & Functions
Option to switch between long or short
Default Value
Take Profit 1 = 1x ATR.
Take Profit 3 = 2x ATR.
Take Profit 5 = 3x ATR.
Stop Loss 2 = 1.5x ATR.
Basline 13 exponential moving average (EMA) (2)
Extra options ATR
Take Profit 2 = 1,5x ATR.
Take Profit 4 = 2,5x ATR.
Take Profit 6 = 3,5x ATR.
Take Profit 7 = 4x ATR.
Take Profit 8 = 4,5x ATR.
Take Profit 9 = 5x ATR.
Stop Loss 1 = 1x ATR.
Stop Loss 3 = 2x ATR.
Extra options MA
Simple moving average (SMA) (1)
Weighted Moving Average (WMA) (3)
Hull moving average (HMA) (4)
Volume Weighted Moving Average (VWMA) (5)
R moving average (RMA) (6)
Triple exponential moving average (TEMA) (7)
Two MM Cross (Signal version)Hi everyone
This is a dummy two MM cross script to be used for the Trade Manager
I'll publish a video explaining how to use the Trade Manager as I received many questions.
This was my fault for not being clear enough. A video will do great wonders here
Dave
