Wick Strategy AnalyzerOverview
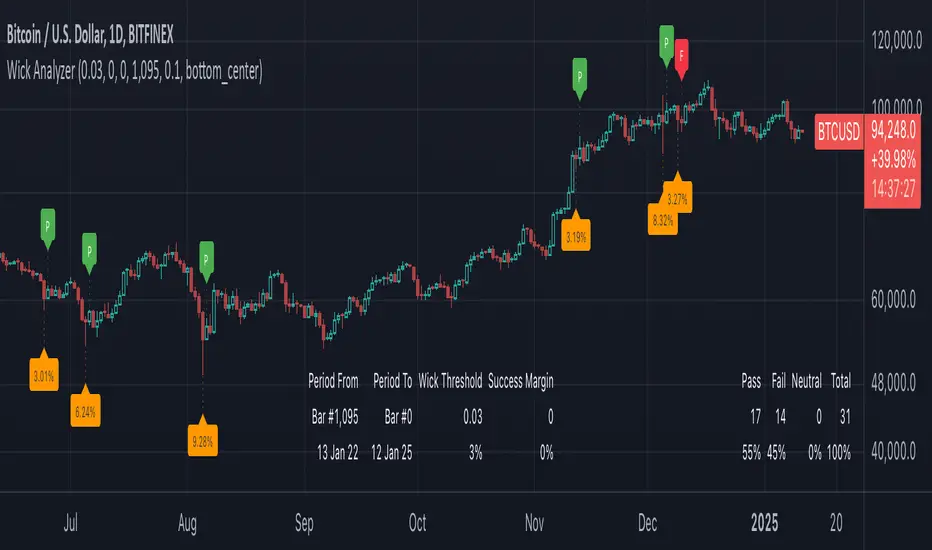
This indicator analyzes candle wick patterns and evaluates their outcomes over a user-definable range (default is 1 year). Labels are rendered on the chart to mark events that meet the specified wick condition.
Features
Customizable Bar Range - users can specify the range of bars to include in the analysis. Default is 365 bars back from the most recent bar (bar 0)
Visual Indicators - labels are rendered to mark conditions & outcomes.
Wick Condition Met - an Orange label below the wick candle displaying the wick’s percentage size.
Outcome Labels - rendered above the candle after wick condition met candles
P (Green): Pass
F (Red): Fail
N (Navy): Neutral
I (Blue): Indicates the current candle has not yet closed, so the outcome is undetermined.
Input Parameters
Wick Threshold - minimum wick size required to qualify as a wick condition.
Success Margin - Defines the margin for classifying outcomes as Pass, Fail, or Neutral. E.g., a success margin of 0.01 requires the next candle's close to exceed the wick candle's close by 1% in order to be a Pass.
Bar Offset Start - starting offset from the last bar for analysis. A value of -1 will include all bars.
Bar Offset End - ending offset from the last bar for analysis. Bars outside this range are excluded.
Example Scenario
Goal: Analyze how candles with a wick size of at least 3.5% perform within a success margin of 1% over the past 540 days.
Setup:
Set Wick Threshold to 0.035
Set Success Margin to 0.01
Set Bar Range Start to 0
Set Bar Range End to 540.
Expected Output
Candles with a wick of at least 3.5% are labeled.
Outcome labels (P, F, or N) indicate performance.
TD9
FrameKitHere are the elements that FrameKit adds to your graphic.
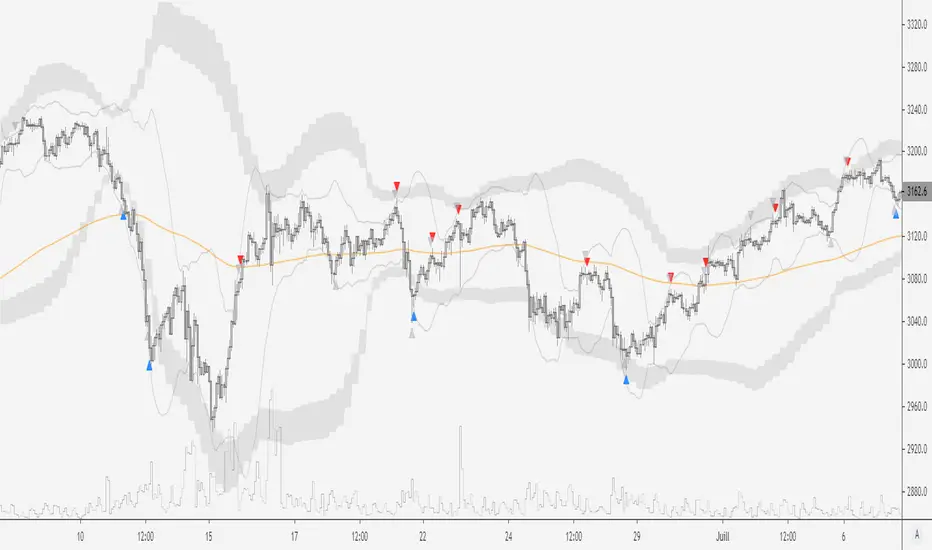
The Bollinger Bands of the upper TimeFrame.
As explained above, context bands are present to speed up your analysis and give you interesting areas to position on your local TF.
Also, since there are two elements in the BBs, the bands and the moving average, I have shown you a trace of this moving average for the last 40 candles. This information therefore gives you an additional technical zone to watch out for when the price approaches it, since there could be a price reaction. This may be the less useful information in FrameKit, because I personally use it very little and that's why I only displayed it for the last 40 candles. On the other hand, I don't want to saturate your chart with too much information and leaving the complete MM trace would have been superfluous and useless.
The Bollinger Bands of the local TimeFrame.
The other information that FrameKit offers you is the bollinger bands channel of the local TimeFrame. This channel is called the minor channel. This information is represented by 2 thin lines, identical to BBs. As its name indicates, the minor channel gives us additional information about the local TF and minor market fluctuations. In addition, this channel allows us to secure our position, something we will see in the risk management stage.
A 200-period Moving Average (orange line).
The penultimate information offered by FrameKit is a 200-period moving average. This MM is used a lot by Traders and that's why it's important. The 200MM, combined with another technical framework such as the Fibonacci ratios as instance, offers you once again a better information package and strengthens your conviction about the market and your trading plan. The 200 Moving Average gives a very good idea of the current trend in the medium term and it's always good to keep an eye on it! For example, it can be useful in a context such as pull-back within a trend. Also be aware that you can change the period’s number of the moving average by clicking on the settings button besides the Framekit indicator. Then change the value over EMA Lenght. That said, I recommend using the 200MM since it gives us a good view of the current market.
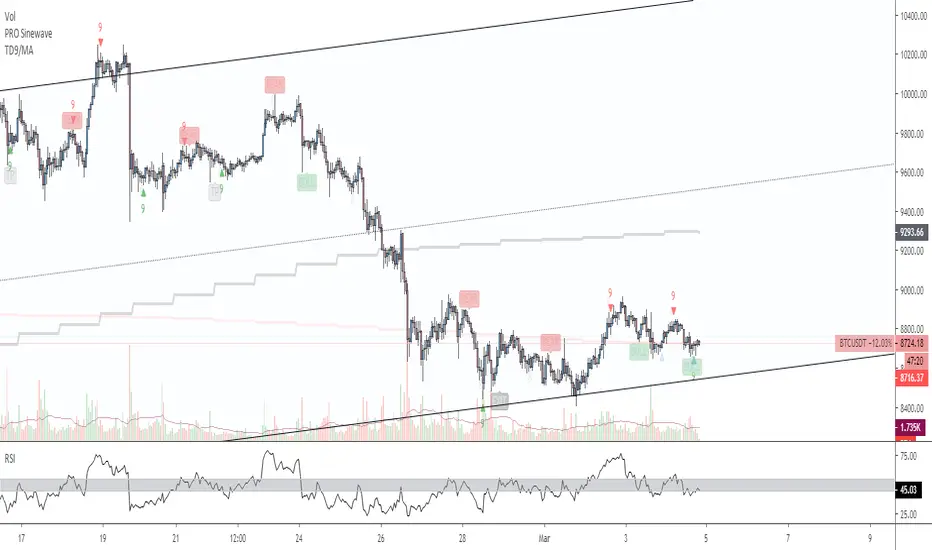
TD9
Finally, the last information that FrameKit gives us is the TD9 Sequential, that can be activated by going again in the FrameKit settings and checking the box “Show TD9 Sequential”.
Here is the TimeFrame List for the indicator, but you can also access this list with the google sheets on Teachable.
1M = 5M
3M = 15M
5M = 15M
15M = 1H
30M = 2H
1H = 4H
2H = Daily
4H = Daily
Daily = Weekly
Weekly = Monthly