Range Deviations PRO | Trade SymmetryRange Deviations PRO — Extended Session Levels
An enhanced version of the original Range Deviations by @joshuuu, retaining the full core logic while adding a key upgrade:
🔹 All session ranges, midlines, and deviation levels now extend into the next trading session, giving seamless multi-session context.
Supports Asia, CBDR, Flout, ONS, and Custom Sessions — with options for half/full standard deviations, equilibrium, and range boxes exactly as in the original.
Extending these levels helps identify:
• Liquidity sweeps
• Trap moves / false breaks
• Daily high/low projections
• Premium–discount behavior across sessions
Ideal for traders using ICT concepts who want clearer continuation of session structure into the next day.
Credit: Original logic by @joshuuu — enhancements by TradeSymmetry.
Disclaimer: Educational use only. Not financial advice.
Timeandprice

DTLLC Time & PriceDTLLC Time and Price with Signals
This indicator is built for traders who understand ICT concepts and want a structured, visual way to align time-based price action with key market levels. By combining customizable trading windows, breakout logic, and daily reference points, it helps you identify high-probability trade opportunities while filtering out market noise.
Key Features
1. Dual Custom Time Ranges (Kill Zones)
Set two independent time ranges per day (start/end hour and minute).
Each range identifies the highest high and lowest low within its window.
Built-in breakout detection generates buy/sell signals when price moves beyond these levels.
2. Volatility Filtering
Adjustable volatility threshold based on True Range relative to ATR.
Filters out low-quality signals during choppy, low-volatility conditions.
3. ATR-Based Stop Loss
Custom ATR length and stop-loss multiplier settings.
Automatically plots ATR-based stop levels for triggered trades.
4. Daily Key Levels
Plots Previous Day High, Previous Day Low, and Midnight Open continuously on the chart.
Useful for spotting breakout and reversal opportunities in line with ICT market structure concepts.
5. Liquidity & Engulfing Candle Highlights
Highlights potential liquidity grab zones (yellow candles) when significant highs/lows are set within your lookback period.
Detects bullish (green) and bearish (red) engulfing patterns for added confluence.
6. Visual & Signal Tools
Buy/Sell signals plotted directly on chart (separate colors for Range 1 and Range 2). Continuous plotting of reference levels to maintain market context throughout the session.
Example Use Case:
A common ICT-inspired reversal setup:
Wait for price to sweep the Previous Day’s High or Low during your chosen time range.
Look for a buy or sell signal with volatility confirmation.
Manage risk using the ATR-based stop-loss plot.
Disclaimer: This script is for educational purposes only and is not financial advice. Trade responsibly and always test strategies before applying them in live markets.

TimeLy Moving Average - TMAHello traders, I'm Only Fibonacci.
With this indicator, you will see the averages according to the hourly, weekly and monthly price movements in many periods on the chart.
This will show you the moving average values of the price over different periods in a progressive manner on the chart that is open to you.
Options and Usage
To see the hourly average, your chart's time range must be less than or equal to 60 minutes, otherwise it will produce a NaN value.
In order to see the daily average, your chart must be open for any minute period or (even if the second is open, it must be greater than 6 seconds). Otherwise, it does not produce any value.
Your chart must be larger than the second chart to see the weekly average. In other words, you can see the weekly average with at least 1 minute chart open.
In order to see the monthly average, your chart time interval must be above 10 minutes, otherwise you will not be able to see data again.
Settings
You choose the moving average type and the time interval value you want to see from the indicator settings.
You can also select a source for moving averages.
Enjoy it, you can make improvements on it.
Please do not forget to comment for various bug reports.

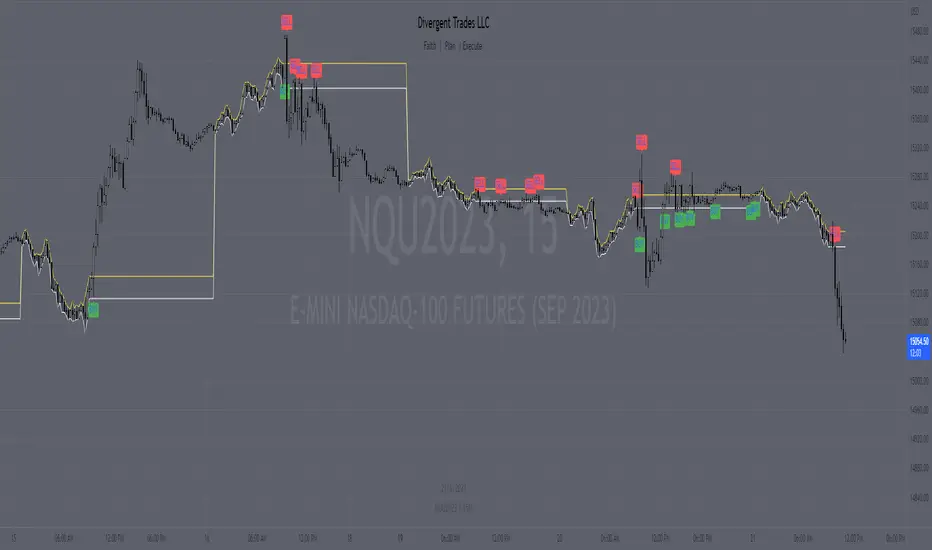
Range H/L Buy and Sell SignalThe "Range H/L Buy and Sell Signal" indicator is designed to identify potential buy and sell signals based on a specified price range and market volatility. This indicator can be used in the TradingView platform to assist traders in making informed decisions.
The indicator allows customization of several parameters to adapt to different trading strategies. These parameters include the start and end times for the price range, the volatility threshold, and the desired breakout conditions.
To begin, the indicator calculates the range start and end timestamps based on the provided hours and minutes. This defines the time period within which the indicator will analyze price movements.
Next, the indicator determines the highest high (High) and lowest low (Low) within the specified price range. These levels represent the upper and lower boundaries of the range and act as potential breakout points.
Volatility is also taken into account to filter out false signals. The indicator calculates the true range and the average true range over a period of 14 bars. The true range measures the price range from the current high to low, while the average true range provides an indication of market volatility.
Based on the breakout conditions and the volatility threshold, buy and sell signals are generated. A buy signal occurs when the closing price crosses above the High and the true range is greater than the volatility threshold multiplied by the average true range. Conversely, a sell signal is triggered when the closing price crosses below the Low and the true range exceeds the volatility threshold multiplied by the average true range.
The indicator visually displays the High and Low levels as plotted lines on the chart. Additionally, it marks the buy signals with green labels labeled "BUY" below the corresponding bars and the sell signals with red labels labeled "SELL" above the bars.
It is important to note that this indicator should be used in conjunction with other technical analysis tools and indicators for comprehensive market analysis. Trading always carries risks, and it is crucial to exercise caution and conduct thorough analysis before making any trading decisions.
Divergent Trades LLC:
Disclaimer: The information provided by the Divergent Trades LLC indicator is for educational and informational purposes only. It should not be considered financial advice or a recommendation to buy, sell, or trade any financial instrument. Divergent Trades LLC is not responsible for any losses incurred as a result of using this indicator. Trading in the financial markets carries a high level of risk and may not be suitable for all investors. Before making any investment decisions, please consult with a financial advisor and do your own due diligence. Past performance is not indicative of future results. By using the Divergent Trades LLC indicator, you acknowledge that you have read and understand this disclaimer and agree to its terms and conditions.
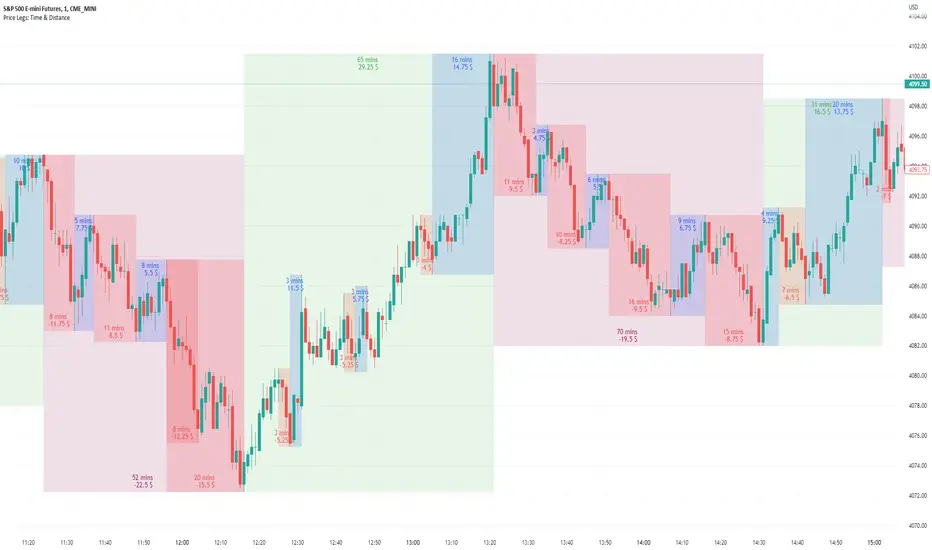
Price Legs: Time & Distance. Measuring moves in time & price-Tool to measure price legs in terms of both time and price; gives an idea of frequency of market movements and their typical extent and duration.
-Written for backtesting: seeing times of day where setups are most likely to unfold dynamically; getting an idea of typical and minimum sizes of small/large legs.
-Two sets of editable lookback numbers to measure both small and large legs independently.
-Works across timeframes and assets (units = mins/hours/days dependent on timeframe; units = '$' for indices & futures, 'pips' for FX).
~toggle on/off each set of bull/bear boxes.
~choose lookback/forward length for each set. Increase number for larger legs, decrease for smaller legs.
(for assets outside of the big Indices and FX, you may want to edit the multiplier, pMult, on lines 23-24)
small legs
large legs