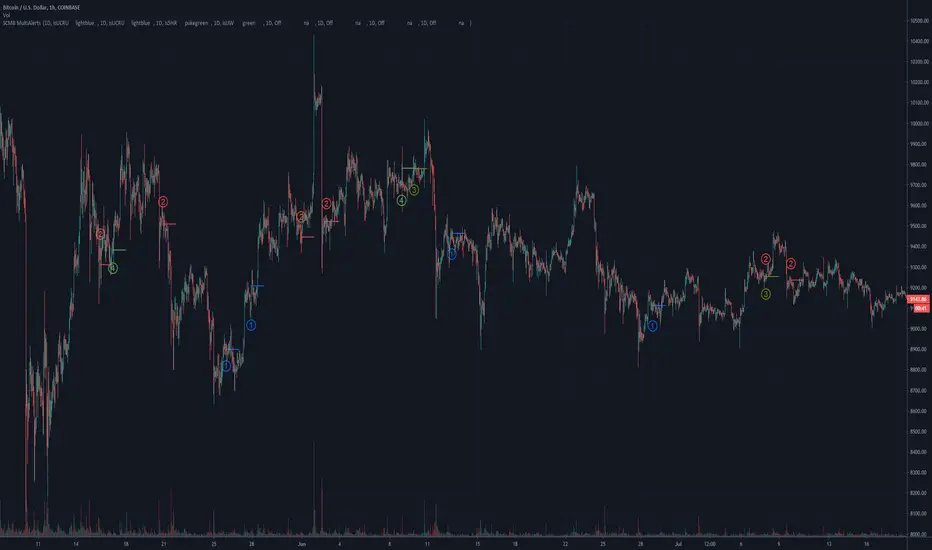
piphunter sspiphunter ss the latest indicator in the pip hunter suite its single aim is to combine important trend analysis from multiple time frames and display the estimated direction of price based off that multi-timeframe analysis
the multi-timeframe analysis is done with a series of modified SSL channels taking data from 4 different time frames and then assimilating that with a pair of moving averages periods then through a series of calculations using those 2 moving averages gives you a signal line and what we call the bacd line when they cross it signifies a new trend direction to enable entry and exit points in a lower time frame whilst still respecting the overall trend from higher time frames
things that this displays
- symbol above or below candles when multiple time frames line up in the same direction and confirmed with the integrated maths mentioned above
- recoloured candles when an overbought or oversold condition is met
This is best used with the rest of the pip hunter package for more info on getting access to all indicators in the package. Please message me for more information.
Timeframe

12 multi time frame MA displayed on specific timeframe/複数MTF MAJapanese below. / 日本語説明は下記
——Republishing after issues pointed out by a moderator resolved.—————
This indicator shows 12 sets of multi time frame moving average(MTF MA) from different time frames which is weekly, daily, 4 hour and 1 hour to lower time frames.
Purpose
This indicator has been developed to show higher timeframe’s moving average as they are expected to work as support and resistance .
How is it different from other MTF MA indicators?
Problems with other conventional MTF MA indicators are;
1.If you set higher timeframe MA, it will also be shown on further higher time frames.
e.g. If you set 4hour chart’s MA on 1 hour or lower time frame charts, it will also appear on daily and weekly chart, which is unnecessary and annoys your chart.
2.One indicator displays one MTF MA only which impacts the number of indicators that you can set.
To tackle these problems, this indicator has incorporated functions below.
1. Control time frames where MTF MA is displayed to avoid showing unnecessary information.
2. One indicator contains 12 MTF MA in which 3 MTF MA from weekly chart, 3 MTF MA from daily chart , 3 MTF MA from 4 hour chart and 3 MTF MA from 1 hour chart. Thus, this contributes to save the number of indicators that you can set.
These are the value added on this indicator.
Specification
-This indicator shows weekly MTF MA, daily MTF MA, 4 hour MTF MA and 1 hour MTF MA.
To be clear, daily MTF MA means that moving average created based on daily chart , which can be shown on daily chart and lower timeframes.
-Each MTF MA will be shown as follows based on timeframes that you select.
1. Weekly MTF MA: Shown on weekly, daily, 4hour, 1 hour, 30M, 15M and 5M chart(Monthly chart does not show MTF MA)
2. Daily MTF MA: Shown on daily, 4hour, 1 hour, 30M, 15M and 5M chart(Weekly and Monthly chart does not show MTF MA)
3. 4hour MTF MA: Shown on 4hour, 1 hour, 30M, 15M and 5M chart(Daily, Weekly and Monthly chart does not show MTF MA)
4. 1hour MTF MA: Shown on 1 hour, 30M, 15M and 5M chart(4hour, Daily, Weekly and Monthly chart does not show MTF MA)
-Each MTF MA can be enabled and disabled by ticking checkbox.
Sample chart with the indicator
●Sample parameters setting
2 MA from weekly timeframe and 3 MA from daily timeframe set.
Here is how MAs are displayed.
It does not show anything.
Only 2 MA from weekly timeframe are shown. MA from daily timeframe are not appeared. This is the difference between this indicator and other conventional MTF MA indicators.
You can see 5 MAs, which are 2 MA from weekly timeframe and 3 MA from daily timeframe .
<4hour chart>
<15M chart>
Journey to use indicator
This indicator is paid indicator and invited-only indicator.
Please contact me via private chat or follow links in my signature so that we can initiate the process to access the indicator
--------------------------------------------------------------------------------------------------
週足、日足、4時間足、1時間足という異なる複数のタイムフレームから最大で12本(各タイムフレームから3本ずつ)のマルチタイムフレーム移動平均線を設定できるインジケーターです。
インジケーターの目的
上位足の移動平均線を下位足に表示することで、上位足での目線を持ったまま下位足の分析を行ったり、上位足によるレジサポの判断に使うことを想定しています。
他のマルチタイムフレーム移動平均線との違い
他のマルチタイムフレーム移動平均線インジケーターでは、よく以下の問題に直面します。
・上位足の移動平均線を表示しようとすると、さらに上位足でもその移動平均線が表示され、チャートが見にくくなる。
例: 4時間足の移動平均線を1時間足で表示可能なように設定すると、日足や週足でも4時間足の移動平均線が表示され、チャートがノイズだらけに・・・
・一つのインジケーターでは原則一つの移動平均線のみ表示。異なる時間軸のマルチタイムフレーム移動平均線を表示しようとするとその数だけインジケーターを追加する必要あり。
これらの問題に対応するため、このインジケーターでは、
・マルチタイムフレーム移動平均線を表示する時間軸を制御することで上位足側に不必要な情報を表示させない。これによりチャートをスッキリと見やすくすることができる。
・週足、日足、4時間足、1時間足という4つの異なる時間軸から3つずつ、最大で12本のマルチタイムフレーム移動平均線を設定可能。これによりインジケーター数を節約。
という機能を加えることでこれらの問題を解決しています。
これがこのインジケーターが提供する付加価値だと考えています。
仕様
機能概要
・このインジケーターでは週足、日足、4時間足、1時間足の4つの時間軸のマルチタイムフレーム移動平均線を表示します。
・設定できる移動平均線は週足から3本、日足から3本、4時間足から3本、1時間足から3本の最大12本まで設定可能です。
・それぞれの移動平均線はSMA(単純移動平均線)とEMA(加重移動平均線)を選択することができます。期間の設定も移動平均線ごとに設定可能です。
・各移動平均線は表示しているチャートの時間軸に応じて以下の様に表示されます。
例えば週足の移動平均線を設定すると、その移動平均線は週足、日足、4時間足、1時間足、30分、15分、5分足に表示されます。
・毎回チャートを開くごとにそれぞれの移動平均線の表示・非表示を切り替えることは可能ですが、この移動平均線はこの時間足では常に非表示といった制御は不可能です。
サンプルチャート
週足の移動平均線を2本、日足の移動平均線を3本設定した場合のチャートの例です。
<月足>
月足では週足の移動平均線も日足の移動平均線も表示されません。
<週足>
週足では2本の移動平均線のみが表示されていることがわかります。
日足の移動平均線が上位足である週足に表示されないのが、他のマルチタイムフレーム移動平均線との違いです。
<日足>
日足では週足と日足両方の移動平均線が表示されます。
<4時間足>
<15分足>
インジケーターの使用について
当インジケーターは招待制インジケーター(有料)となっています。
使用を希望される方はプライベートチャットや下記リンクのDMでご連絡ください。
このページのコメント欄はインジケーターそのものに対するコメントやアップデートの記載のためのものとなっております。Tradingviewのハウスルールを守るためにもコメント欄からの連絡はご遠慮ください。

Multi Time Frame Bollinger Bands(Daily/4H/1H)/MTFボリンジャーバンドJapanese below. / 日本語説明は下記
-----Republishing after issues resolved.---------
Summary
This indicator shows 3 multi time frame Bollinger bands (MTF BB) from different time frames which is daily, 4 hour and 1 hour to lower time frames with 3 bands(+-1-3ς).
Example: If you set daily BB, it will be shown on daily, 4hour, 1hour, 30M, 15M, 5M and 1M charts. It will not appear on weekly and monthly charts as it is not necessary to see it on higher time frames.
Purpose
This indicator has been developed to show higher timeframe’s BB as they are expected to work as support and resistance .
How is it different from other BB indicators?
Problems with other conventional BB indicators are;
-If you set higher timeframe BB(MTF BB), it will also be shown on further higher time frames.
i.e. If you set 4hour chart BB on 1 hour or lower time frame charts, it will also appear on daily and weekly chart, which is not necessary.
-One indicator displays one BB only which impacts the number of indicators that you can set(depending on your account plan)
-One indicator displays one band only. If you need 1-3ς, you need to add the same BB indicator.
To tackle these problems, this indicator has incorporated functions below.
-Control timeframes where BB is displayed to eliminate unnecessary information on higher time frames.
-One indicator contains 3 BB with 3 bands(minus 1-3ς & plus 1-3ς) which contributes to save the number of indicators that you can set.
These are the value added on this indicator.
Spec
-This indicator shows daily BB, 4 hour BB and 1 hour BB.
To be clear, daily BB means that BB created based on daily chart , which can be shown on lower timeframes.
-Each BB displays 3 bands(minus 1-3ς & plus 1-3ς) and middle line
-Display of each band can be parameterized to show and not to show
e.g. Showing only plus/minus 2 and 3ς etc.
-The middle line adopts SMA ( simple moving average ) only and you can set period of SMA .
-Each BB will be shown as follows based on timeframes that you select.
Daily BB: Shown on daily, 4hour, 1 hour, 30M, 15M, 5M and 1M chart
(Weekly and Monthly chart does not show BB)
4hour BB: Shown on 4hour, 1 hour, 30M, 15M, 5M and 1M chart
(Daily, Weekly and Monthly chart does not show BB)
1hour BB: Shown on 1 hour, 30M, 15M, 5M and 1M chart
(4hour, Daily, Weekly and Monthly chart does not show BB)
-Each BB can be enabled and disabled by ticking checkbox.
e.g. On 1 hour chart, you can disable 4 hour BB and show daily BB only etc.
Please see the sample chart below.
Sample chart with the indicator
Daily chart
4hour chart showing daily BB and 4H BB
1hour chart showing daily BB, 4H BB and 1H BB
5Mchart showing daily BB, 4H BB and 1H BB
Journey to use indicator
This indicator is paid indicator and invited-only indicator.
Please contact me via private chat or follow links in my signature so that we can initiate the process to access the indicator
--------------------------------------------------------------------------------------------------
日足、4時間足、1時間足の3つのボリンジャーバンド(プラスマイナス1-3シグマのバンド)を下位足含めて表示するマルチタイムフレームボリンジャーバンドのインジケーターです。
インジケーターの目的
上位足のボリンジャーバンドを下位足に表示することで、レジサポの判断に使うことを想定しています。
他のボリンジャーバンドインジケーターとの違い
他のボリンジャーバンドインジケーターでは、よく以下の問題に直面します。
・上位足のボリンジャーバンドを表示しようとすると、さらに上位足でもそのバンドが表示されチャートがみにくくなる。
例: 4時間足のボリンジャーバンドを下位足で表示可能な様に設定すると、日足や週足でも表示され、チャートがノイズだらけに・・・
・一つのインジケーターでは一つのボリンジャーバンドのみ表示。異なる時間軸のボリンジャーバンドを表示しようとするとその数だけインジケーターを追加する必要あり。
・バンドが一つしか設定できず、1-3シグマまで表示しようとするとインジケーターを追加する必要がある。
これらの問題に対して、このインジケーターでは、
・ボリンジャーバンドを表示する時間軸を制御することで上位足側で不必要な情報を表示させない。これによりチャートをスッキリ見やすくすることができる。
・一つのインジケーターで3つの異なる時間軸のボリンジャーバンドを表示し、かつそれぞれでプラスマイナス1-3のバンドを表示することでインジケーター数を節約。
という機能を加えることでこれらの問題を解決しています。
これがこのインジケーターが提供する付加価値だと考えています。
仕様
機能概要
・このインジケーターでは日足、4時間足、1時間足の3つの時間軸のボリンジャーバンドを表示します。
・それぞれのボリンジャーバンドはプラスマイナス1-3シグマまでのバンドと基準線を表示します。
・各バンドは表示・非表示の切り替えが可能です。(例: プラスマイナス2、3シグマのみ表示など)
・各ボリンジャーバンドの基準線(ミドルライン)はSMA(単純移動平均線)です。移動平均線の期間は自由に設定できます。
・各ボリンジャーバンドは表示しているチャートの時間軸に応じて以下の様に表示されます。
日足のボリンジャーバンド : 日足, 4時間足、1時間足、30分足、15分足、5分足、1分足チャートにのみ表示(週足以上では非表示の仕様です。)
4時間足のボリンジャーバンド : 4時間足、1時間足、30分足、15分足、5分足、1分足チャートにのみ表示(日足以上では非表示の仕様です。)
1時間足のボリンジャーバンド : 1時間足、30分足、15分足、5分足、1分足チャートにのみ表示(4時間足以上では非表示の仕様です。)
・各ボリンジャーバンドは表示・非表示のフラグをON/OFFにすることで表示を制御することができます。
例えば1時間足のチャートでは日足のボリンジャーバンドのみを表示し、4時間足のボリンジャーバンドを表示させない、など。
サンプルチャート
日足
日足では日足ボリンジャーバンドしか表示されない設定ですので、4時間足や1時間足の設定が邪魔になりません。
ここが他のボリンジャーバンドインジケーターと違う点です。
4時間足
4時間足に日足と4時間足のボリンジャーバンドを表示した状態です。不要な場面では両方もしくはいずれか一方を非表示にすることができます。
1時間足
1時間足に日足と4時間足と1時間足のボリンジャーバンドを表示した状態です。
5分足
5分足に全てのボリンジャーバンドを表示したチャートです。
短期トレードで上位足ボリンジャーバンドによる反発を狙う時などに活用できるのではないでしょうか。
インジケーターの使用について
当インジケーターは招待制インジケーター(有料)となっています。
使用を希望される方はプライベートチャットや下記リンクのDMでご連絡ください。
このページのコメント欄はインジケーターそのものに対するコメントやアップデートの記載のためのものとなっております。Tradingviewのハウスルールを守るためにもコメント欄からの連絡はご遠慮ください。
Renko MTF - Traditional and ATRSomehow there aren't too many renko bars that have the traditional setting built-in so I put one up. This one has the option to choose between Traditional and ATR, the size number corresponds to the option that was chosen. And just in case if anyone wanted, I put up a multi-time frame option to choose the time frame the bars take place. D is for day, W is for week, flat numbers are in minutes, and leaving it blank looks at the current time frame the chart is in. The calculation comes from how Tradingview handles renko bars.
Renko bars don't paint a color unless the market moves a certain amount based on its settings. When the market moves up it turns green, if it moves down it turns red, simple color changes alone can say a lot. They're a good way to try to find trends somewhat objectively and seem to be a good way to eliminate time and can replace other time-based indicators that can whipsaw or lag. The bars have a tendency to repeat themselves so it's a good way to find trends. There aren't too many settings for the box size, most people either just choose 5, 10, 14, etc where as other indicators have many options that differ on different markets. The numbers can be chosen easily enough to pick a sweet spot with just a single input where other indicators such as MACD have multiple inputs to pick the right number that can make it difficult to choose from(although it won't be as precise as a MACD would sometimes but can be worth the objectiveness and consistency and same setting repeatability in different markets in my opinion). Some example strategies could be to use them as an alternative trailing stop, finding trends, a simple color change for entry and exit on top of other strategies, etc. It can do the job of many in an all in one price action type indicator(although not better all the time, it can come close enough). Despite all this, it does seem to depend on which time-frame it's being looked at, how TV does the calculation for it, and how one can use this with the lack of practical information on it out there.

Multiple EMAs - Variable lengthsA simple cluster of EMAs that will switch the lengths based on intraday or not.
The fast, medium and slow periods will switch to set values as per input.
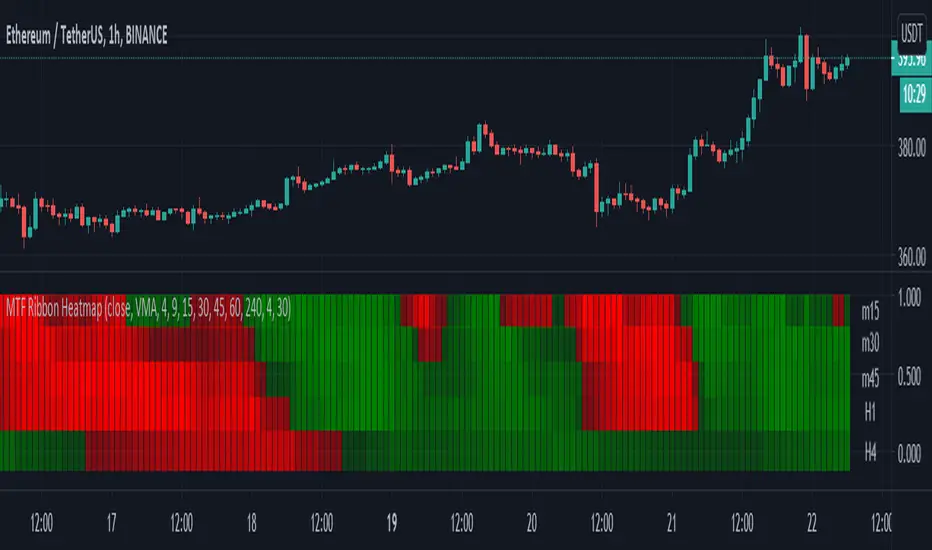
Moving Averages - 5 Ribbon MTF HeatmapThis is a 5 Ribbon heatmap moving averages indicator where each represents a different time frame, The RED or GREEN color palette is also affected by asset velocity using ATR.
Supports various moving averages including VMA (Default), Zero Lag, TSF (Time Series Forecast).
A single ribbon is set to GREEN when fast MA (moving average) is above the slower MA and RED when fast MA is below the slower MA.
In the settings you can set the ATR length (Average True Range) which will affect the velocity calculation for the colors, higher ATR length will smooth the coloring more (Less color changes), while lower ATR will show more instant changes.
HOW TO USE?
The brighter the GREEN is the stronger the up trend.
The brighter the RED is the stronger the down trend.
A weakening GREEN color can be a sign for a down reversal.
A weakening RED color can be a sign for a up reversal .
Supports alerts when fast moving average crosses slow moving average from all time frames, either way, up or down.
Comments/Suggested/Positive feedbacks are welcome and can make this indicator even better.
Follow for upcoming indicators: www.tradingview.com
MTF VWAP + Fibo Incremental deviationsI made a Fibo variant of my first script "VWAPs + devs" :
This new indicator give you the possibility to plot multi timeframes VWAP (D, W, M, 3M and 12M ) and Fibo deviations for each one.
VWAP is a powerfull indicator which is used by big players to get informations if the price is "overbought" or "oversold". Deviations give the opportunity to have supports and resistances in those "over"-zones.
I searched for better results and found those defaults values :
Fib 1 level : 0.618
Fib 2 level : 0.786
Fib 3 level : 1.000
Fib 4 level : 1.618
Fib 5 level : 2.618
In the thumbnail, we can see that the 1.618 deviation level made a great support on the last uptrend for BTCUSDT .
You can change each values but low ones as 0.382 and 0.5 don't give really interesting supports/resistances.
I made this script as clear and simple as possible with only one menu in the parameters.
Some examples of what you can do :
BTCUSDT (Binance) H4 / D, W, M, 3M ,12M VWAP without devs
BTCUSDT (Binance) M5 / Daily VWAP + Fibo devs
Hope this will be useful for you !

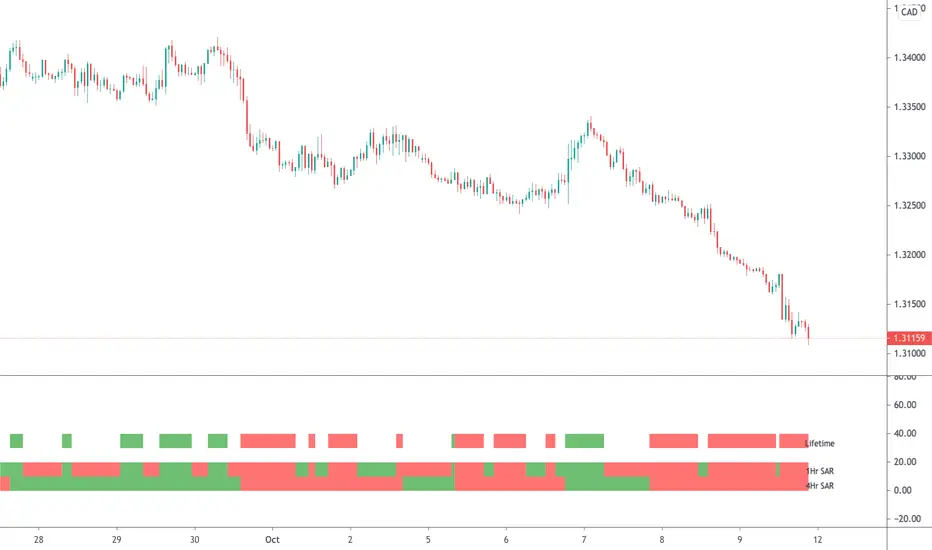
Parabolic SAR (MTF)This is a multi-timeframe Parabolic SAR indicator which uses 1 and 4 hour charts.
Using this indicator is simple, if the LifeTime line is green then buy, if red then sell OR don't trade. So...
Green Line - This strategy is in a buy position
Red Line - This strategy is in a sell position
Any other colour - DON'T TRADE
The traders approach is simple, when all indicators are green or red, then take the trade. As soon as one indicator changes, then re-evaluate using your normal process, such as price action, to determine whether to close the trade or continue.
If you require any further information or script modifications, please message me.
PLEASE CHECK OUT MY OTHER SCRIPTS
Supertrend (MTF) & Parabolic SAROne of my mixed approach strategy indicators which includes:
- Parabolic SAR
- 1 Hour Supertrend
- 4 Hour Supertrend
Whilst this script may appear slow due to the 4hr Supertrend, it does a great job of managing breakouts.
Using this indicator is simple, if the line labeled Lifetime is green then buy, if red then sell OR don't trade. So...
Green Line - This strategy is in a buy position
Red Line - This strategy is in a sell position
Any other Color - DON'T TRADE
The traders approach is simple, when all indicators are green or red, then take the trade. As soon as one indicator changes, then re-evaluate using your normal process, such as price action, to determine whether to close the trade or continue.
If you require any further information or script modifications, please message me.
PLEASE CHECK OUT MY OTHER SCRIPTS

Multi Time Frame CandlesHello Traders,
This script can show (upto) 3 candles of another time frames without changing chart time frame realtime . You can choose the time frame and number of candles in the options. You have option to change body and wick colors as well.
in this example number of candles is 2:
You can set body and wick colors:
In this example, weekly candles are shown on 1h chart:
Enjoy!

London Open Range Breakout by KviateqThis script is what I currently use to day trade forex on a 5-minute timeframe.
The script features Multi-timeframe EMA20 that uses timeframe multipliers and is smoother by the factor by which you're multiplying your current timeframe.
Default settings are set to display EMA20 on the current (M5) timeframe, as well as M15, H1, H4 and D1 timeframes.
The background color changes intensity based on how many conditions are met - are all EMAs in the right order, is the current close above/below all the EMAs.
Featured is also a range set to 1 hour since the London breakout (can be changed to M15, or however long you'd like - my current setting is 30 minute).
Also featured are levels that I find to be of most importance - such as Daily and Weekly Open, Previous Day's and Week's Highs.
The idea is to only take trades when all stars align - EMAs, break above/below the Opening Range and not to long/short into an important level.

Alert of Cryptooo fox HYPER trading(CRYPTOOO FOX ( BCH ) long & short no repaint strategy)
Hello traders
- The alert of strategy is using higher time frame but it never repaint .
- The alert of strategy is working only in ( 10 % of equity ) you can change it as you want .
- When you use this alert you will get this message alert ( THIS INDICATOR MAY BE REPAINT )
and this is normal so we use higher time frame but as i said it ( never repaint )
- The alert of strategy is working in ( BCH / USDTP ) and ( BTC / USDTP) IN BINANCE FUTURE MARKET .
- I recommanded too much using ( 15 min , 30 min ) charts .
- This script is working in standard charts no ( heikien ashi or range ) charts .
- ( TO ACCES THIS SCRIPT PLEASE USE THE LINKS BELOW ) .

KK_MA_MTFThis is multitimeframe Hull moving average
you can change offset to 0 if you want realtime data

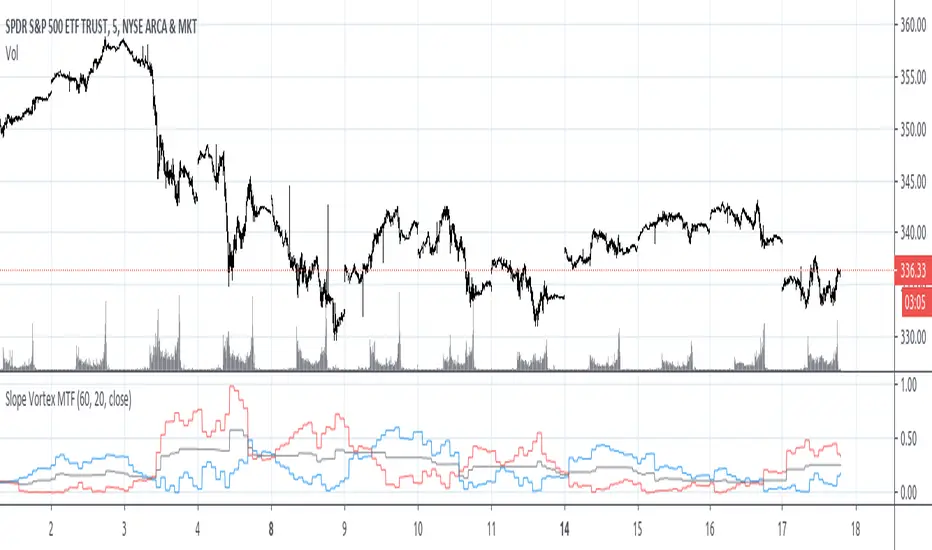
Slope Vortex MTFA request was made to make this script into a mult-time frame version. :)
I'm not fond of the outcome using a really high time frame like the 1 Day when you're looking at a 5 minute intraday chart, but I think it looks pretty decent on something like a 5 min chart with 1 hour higher time frame.
Please checkout the original Slope Vortex script for more information on how it can potentially be used as a trading signal.
ATR Limits | Custom Timeframe | Day | Week | Month | H4 | H1Marks out the ATR limits for your own custom selected timeframe
Allows you to set an "Exact Distance" for the ATR.
Note:
If the "Exact Distance" is set = 0
then an ATR will be calculated for you based on an average of the "ATR Periods"
i.e. By Default: atr(20)
Otherwise if "Exact Distance" is not = 0
then ATR limits will be calculated using your specified distance
E.g. Exact Distance = 0.5
Low of Day = 1.0
High of Day = 1.1
ATR Limit Low = 1.1 - 0.5 = 0.6
ATR Limit High = 1.0 + 0.5 = 1.5
Enjoy!
Higher Timeframe Trend Indicator V3.0What is it?
An indicator that depicts the trend of up to 5 higher timeframes on the same chart without needing to context-switch between charts.
Features
- Supports up to 5 timeframes
- Trends indicated by 5 colored buttons: one for each timeframe
- Varying shades of green: uptrend
- Varying shades of red: downtrend
- White/silver: sideways/neutral
- Configurable length (time period) for each timeframe
- Increase length to capture long term trends; decrease it to capture only short term ones
- Configurable sensitivity for each timeframe
- Sensitivity determines what angle is considered trending and what is not
- Increase sensitivity to capture weak trends
- Decrease sensitivity to filter out weak trends and capture only strong/steep ones
- Sensitivity ranges from 1 (least sensitive) to 3 (most sensitive)
- Move the labels around vertically for better visibility by changing the "Location" and "Offset" parameters
How should one use it?
Use it to quickly browse through charts to understand the context across timeframes, and zero in on only those that have trends aligning on the higher and lower timeframes as per your strategy. For e.g., a chart that is trending up strongly on the 15min and 60min (indicated by dark green colored buttons), and trending down on the 1 and/or 5 min (indicated by red-colored buttons), can be shortlisted for a potential pullback trade. Use your favorite pullback strategy (Supply/Demand, Support/Resistance, Moving Averages, etc.) to hop in on the trend.
How are trends determined?
The indicator uses normalized %change in price of the linear regression line segment of the chosen price sources (close, high, low, MA, etc.) over a specified length to determine trend direction and intensity
Known Issues
Will indicate the trend correctly only for timeframes *higher* than the current (visible) resolution/timeframe of the chart. Might not indicate it correctly for lower timeframes ( i.e., lower than the current (visible) resolution/timeframe of the chart). For this reason, all timeframes lower than the current resolution will be hidden in the present release.
Future releases
- I am still experimenting with various sensitivity levels and the corresponding trend shades to make the tool as accurate and intuitive as possible. These modifications might come in
- Sensitivity levels might be increased.
- Bug fixes, if any

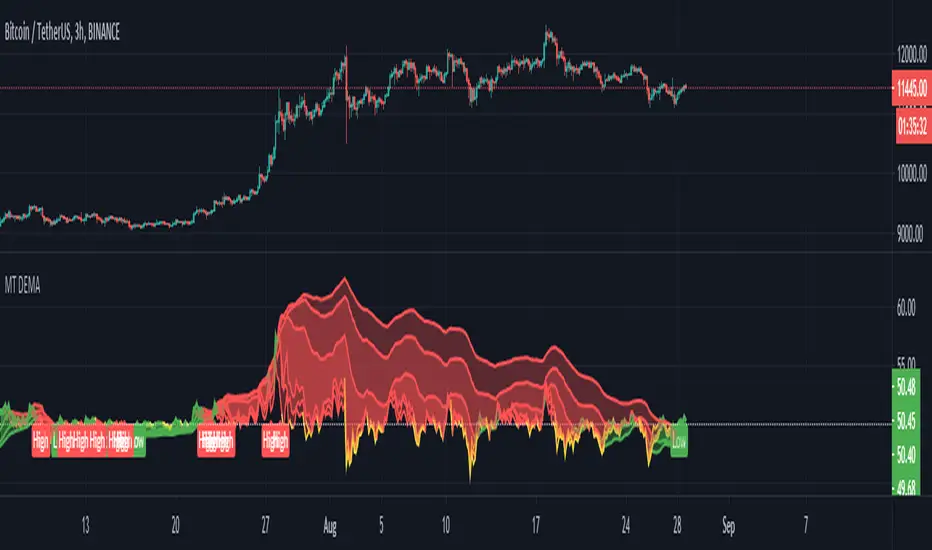
MT DEMA
In this example I'm using 3H 2H 1H as inputs with 200 50 20 lengths.
DEMA is a indicators based on 3 EMAs on 3 time frames.
It measures the distances from its exponential moving averages.
Really great in swing trading.
HISTOR
In this chart I used the 3H 2H and 1H
HISTOR, short histogram RSI is based on 3 time frames of RSI and MF averages and SMAs.
The script also plots a normilized volume.
The script has 3 alert conditions. Overbought, oversold and "potential trade" when overbought or oversold.

[CP]3 RSI Multi Timeframe InceptionTriple RSI indicator where you can set the timeframe for each RSI.
Take confirmation from different timeframes to make high probability trades!
Typical settings would be,
1 Day, 1 Week, 1 Month or
1 hr, 4hr, 1 Day or
3 min, 15 min, 1 hr or.........your imagination is the only limit here!

VWAP x5 [Higher]MTF Refactored by IzocelMultiple VWAP
What is the Volume Weighted Average Price (VWAP)?
The volume weighted average price (VWAP) is a trading benchmark used by traders that gives the average price a security has traded at throughout the day, based on both volume and price. It is important because it provides traders with insight into both the trend and value of a security. <---- Source Investopedia 2020 : By CORY MITCHELL Reviewed By GORDON SCOTT
There's nothing much to explain, possibility to use fills between the VWAP and it's associated previous close.
Be sure to use it with higher Timeframe than your chart T.F.
-Raphaël V.D.
Efficient Support & Resistance LevelsThis script is a mixture of my two previous scripts "True Strong Classical Support/Resistance Levels" and "Hidden Supports & Resistances + Round Levels". This combination brings on better identification of the most efficient support/resistance levels.
Note that "Hidden SnR Levels" part of the code is only expected to work on Forex charts, but apart from that, the other parts could be applied to any chart.
The script may:
- Draw classical support/resistance levels which retraced the price previously, aided by multi-timeframe analysis
- Draw hidden support/resistance levels based on psychological patterns of the price
- Adjust to wicks better than Pine Script built-in pivot functions
- Differ the levels color based on chart reactions
- Merge nearby classical levels to avoid congestion on the chart
Feel free to use it and send me your thoughts.

Profit Accumulator Moving Average SlopeMoving Average Slope Indicator
This is a support indicator to the Main Indicator which has also been published.
This indicator makes use of custom and adjustable moving averages. There are two options for this centred oscillator:
Average of Three Moving Averages on Current Time Frame
Average of Three Moving Average Time Frames for One Length (i.e. if I'm using a 1hr time frame I would take the average of 30min, 1hr and 4hr moving averages with a 12 length).
When the trend line crosses above zero it is an indication for a long trade and when the trend line crosses below zero it is an indication for a short trade.
Whilst an actual alert function is not set for the indicator, the TradingView alert function can be used to trigger a message when the trendline crosses above or below zero.
I've been using this successfully on the one hour FX charts, but seems to work equally as well on higher or lower time frames (not less than 15min).
The other indicators which are part of the suite are shown on the website which is highlighted in my signature at the bottom of the page. Purchase of the main indicator gives access to the full suite of eight indicators. I use the other indicators to confirm the direction of the trade and to determine if I want to trade or not. I use it along with the 2min, 15min and 4hr timeframes to identify the best entry window and how long I'm likely to be in the trade.
Support can be provided via private message or in the comments below.
The links are provided below for access to the indicator.

SCMB MultiAlerts - Candle Structure Alert ScriptSCMB Multialerts is a tool for candle structure alert automation.
The input screen allows you to input the timeframe, choose candle structure condition, toggle inverse condition, and toggle Heiken-Ashi for that candle structure trigger condition.
Input the timeframe with the # first and use H - Hour, D - Day, W - Week, and M - Month after the number; example - "1H" - "3D" - "4H" - "1W"
There are 8 total alert conditions that are programmable. You may use any combination of timeframes, inverse/HA, and candle-structure unique to each trigger available at the same time.
When you have set the conditions you want for alerts with the input settings, the color and the position of on-screen alerts is automatically populated.
You can then visually back-test to make sure these settings are desirable
Customize the colors individually, or choose to use "Color0" for all alert conditions by default by "user colors" toggle at the bottom of settings window, then you only need to change "Color0" for each alert condition.
Use the "Indicator Templates" to save your configuration, save several presets with settings for different situations, you can link the settings to a particular symbol as well.
Finally, use the "add alert" feature within tradingview to select the SCMB alert conditions as triggers. TV will deploy alerts with your customized message when each condition is met.
Some notes and known bugs:
Timeframe input requires capital letters for H,D,W,M.
Selecting "Close" Open" or "HL/2" from the drop down will do nothing at the moment. Future release plans to make use of these options.
If there is a feature you would like, question answered, or a bug to report, visit the TradingView SNOW_CITY public chat-room; link in my signature
Use the pastebin link below for indicator access information