Ichimoku PourSamadi Signal [TradingFinder] KijunSen Magic Number🔵 Introduction
The Ichimoku Kinko Hyo system is one of the most comprehensive market analysis tools ever created. Developed by Goichi Hosoda, a Japanese journalist in the 1930s, its purpose was to allow traders to recognize the balance between price, time, and momentum at a single glance. (In Japanese, Ichimoku literally means “one look.”)
At the core of the system lie five key components: Tenkan-sen (Conversion Line), Kijun-sen (Baseline), Chikou Span (Lagging Line), and the two leading spans, Senkou Span A and Senkou Span B, which together form the well-known Kumo or cloud representing both temporal structure and equilibrium zones in the market.
Although Ichimoku is commonly used to identify trends and support/resistance levels, a deeper layer of time philosophy exists within it. Ichimoku was not designed solely for price analysis but equally for time analysis.
In the classical model, the numerical cycles 9, 26, 52 reflect the natural rhythm of the market originally based on the Tokyo Stock Exchange’s trading schedule in the 1930s.
These values repeat across the system’s calculations, forming the foundation of Ichimoku’s time symmetry where price and time ultimately seek equilibrium.
In recent years, modern analysts have explored new approaches to extract time-based turning points from Ichimoku’s structure. One such approach is the analysis of flat segments on the Kijun-sen and Senkou B lines.
Whenever one of these lines remains flat for a period, it signals temporary balance between buyers and sellers; when the flat breaks, the market exits equilibrium and a new cycle begins.
This indicator is built precisely upon that philosophy. Following the timing methodology introduced by M.A. Poursamadi, the focus shifts away from price signals and line crossovers toward identifying flat periods on Kijun-sen (period 52) as time anchors.
From the first candle that changes the line’s slope, the tool begins a temporal count using a fixed sequence of key numbers: 5, 9, 13, 17, 26, 35, 43, 52, 63, 72, 81, 90.
Derived from both classical Ichimoku cycles and empirical testing, these numbers mark potential timing nodes where a market wave may end, a correction may begin, or a new leg may form.
Thus, this method serves not merely as another Ichimoku tool but as a temporal metronome for market structure a way to visualize moments when the market is ready to change rhythm, often before candles reveal it.
🔵 How to Use
The Kijun Timing BoX is built entirely on Ichimoku’s concept of time analysis.
Its core idea is that within every flat segment of the Kijun-sen, the market enters a temporary balance between opposing forces.
When that flat breaks, a new time cycle begins. From that first breakout candle, the indicator starts counting forward through the predefined time sequence(5, 9, 13, 17, 26, 35, 43, 52, 63, 72, 81, 90).
This counting framework creates a temporal map of market behavior, where each number represents an area where meaningful price fluctuations often occur.
A “meaningful fluctuation” does not necessarily imply reversal or continuation; rather, it marks a moment when the market’s internal energy balance shifts, typically visible as noticeable reactions on lower timeframes.
🟣 Identifying the Anchor Point
The first step is recognizing a valid flat zone on the Kijun-sen.
When this line remains flat for several candles and then changes slope, the indicator marks that bar as the Anchor, initiating the time count.
From that point onward, vertical gray lines appear at each interval in the key-number sequence, visualizing the time nodes ahead.
🟣 Reading the Timing Lines
Each numbered line represents a timing node a temporal point where a change in price rhythm is statistically more likely to occur.
At these nodes, the market may :
Enter a consolidation or minor correction phase.
Develop range-bound movement.
Or simply alter the speed and intensity of its move.
These behaviors do not imply a specific direction; they only highlight zones where time-based activity tends to cluster, giving traders a clearer view of cyclical rhythm.
🟣 Applying Time Analysis
The indicator’s primary use is to observe temporal order, not to predict price direction.
By tracking the distance between Anchors and the reactions that appear near major timing lines, traders can empirically identify each market’s characteristic rhythm—its own time DNA.
For example, one asset may consistently show significant fluctuations around the 13- and 26-bar marks,while another might react closer to 9 or 52. Recognizing such patterns helps traders understand how long typical cycles last before new phases of volatility emerge.
🟣 Combining with Other Tools
The indicator does not generate buy/sell signals on its own.
Its best use is in combination with price- or structure-based methods, to see whether meaningful price reactions occur around the same timing nodes.
In practice, it helps distinguish structured time-based fluctuations from random, noise-driven moves an insight often overlooked in conventional market analysis.
🔵 Settings
🟣 Logical Settings
KijunSen Period : Defines the baseline period used for timing analysis. Default = 52. It is the main line for detecting flats and generating time anchors.
Flat Event Filter : Controls how flat segments are validated before triggering a new timing event.
All : Every flat triggers a new Timing Box.
Automatic : Only flats longer than the historical average are used (recommended).
Custom : User manually defines the minimum flat length via Custom Count.
Update Timing Analysis BoX Per Event : If enabled, a new Timing Box is drawn each time a new flat event occurs. If disabled, the box completes its 90-bar window before refreshing.
🟣 Ichimoku Settings
TenkanSen Period : Defines the period for the Conversion Line (Tenkan-sen). Default = 9.
KijunSen Period : Sets the standard Ichimoku baseline (not the timing line). Default = 26.
Span B Period : Defines the period for Senkou Span B, the slower cloud boundary. Default = 52.
Shift Lines : Offsets cloud projection into the future. Default = 26.
🟣 Display Settings
Users can show or hide all Ichimoku lines Tenkan-sen, Kijun-sen, Chikou Span, Span A, and Span B as well as the Ichimoku Cloud.
They can also customize the color of each element to match personal chart preferences and improve visibility.
🔵 Conclusion
This analytical approach transforms Ichimoku’s time philosophy into a visual and measurable framework. A flat Kijun-sen represents a moment of market equilibrium; when its slope shifts, a new temporal cycle begins.
The purpose is not to forecast price direction but to highlight periods when meaningful fluctuations are more likely to develop.
Through this perspective, traders can observe the hidden rhythm of market time and expand their analysis beyond price into a broader time-cycle dimension.
Ultimately, the method revives Ichimoku’s original principle: the market can only be truly understood through the simultaneous harmony of price, time, and balance.
Timetheory

Ichimoku Theories [LuxAlgo]The Ichimoku Theories indicator is the most complete Ichimoku tool you will ever need. Four tools combined into one to harness all the power of Ichimoku Kinkō Hyō.
This tool features the following concepts based on the work of Goichi Hosoda:
Ichimoku Kinkō Hyō: Original Ichimoku indicator with its five main lines and kumo.
Time Theory: automatic time cycle identification and forecasting to understand market timing.
Wave Theory: automatic wave identification to understand market structure.
Price Theory: automatic identification of developing N waves and possible price targets to understand future price behavior.
🔶 ICHIMOKU KINKŌ HYŌ
Ichimoku with lines only, Kumo only and both together
Let us start with the basics: the Ichimoku original indicator is a tool to understand the market, not to predict it, it is a trend-following tool, so it is best used in trending markets.
Ichimoku tells us what is happening in the market and what may happen next, the aim of the tool is to provide market understanding, not trading signals.
The tool is based on calculating the mid-point between the high and low of three pre-defined ranges as the equilibrium price for short (9 periods), medium (26 periods), and long (52 periods) time horizons:
Tenkan sen: middle point of the range of the last 9 candles
Kinjun sen: middle point of the range of the last 26 candles
Senkou span A: middle point between Tankan Sen and Kijun Sen, plotted 26 candles into the future
Senkou span B: midpoint of the range of the last 52 candles, plotted 26 candles into the future
Chikou span: closing price plotted 26 candles into the past
Kumo: area between Senkou pans A and B (kumo means cloud in Japanese)
The most basic use of the tool is to use the Kumo as an area of possible support or resistance.
🔶 TIME THEORY
Current cycles and forecast
Time theory is a critical concept used to identify historical and current market cycles, and use these to forecast the next ones. This concept is based on the Kihon Suchi (translating to "Basic Numbers" in Japanese), these are 9 and 26, and from their combinations we obtain the following sequence:
9, 17, 26, 33, 42, 51, 65, 76, 129, 172, 200, 257
The main idea is that the market moves in cycles with periods set by the Kihon Suchi sequence.
When the cycle has the same exact periods, we obtain the Taito Suchi (translating to "Same Number" in Japanese).
This tool allows traders to identify historical and current market cycles and forecast the next one.
🔹 Time Cycle Identification
Presentation of 4 different modes: SWINGS, HIGHS, KINJUN, and WAVES .
The tool draws a horizontal line at the bottom of the chart showing the cycles detected and their size.
The following settings are used:
Time Cycle Mode: up to 7 different modes
Wave Cycle: Which wave to use when WAVE mode is selected, only active waves in the Wave Theory settings will be used.
Show Time Cycles: keep a cleaner chart by disabling cycles visualisation
Show last X time cycles: how many cycles to display
🔹 Time Cycle Forecast
Showcasing the two forecasting patterns: Kihon Suchi and Taito Suchi
The tool plots horizontal lines, a solid anchor line, and several dotted forecast lines.
The following settings are used:
Show time cycle forecast: to keep things clean
Forecast Pattern: comes in two flavors
Kihon Suchi plots a line from the anchor at each number in the Kihon Suchi sequence.
Taito Suchi plot lines from the anchor with the same size detected in the anchored cycle
Anchor forecast on last X time cycle: traders can place the anchor in any detected cycle
🔶 WAVE THEORY
All waves activated with overlapping
The main idea behind this theory is that markets move like waves in the sea, back and forth (making swing lows and highs). Understanding the current market structure is key to having realistic expectations of what the market may do next. The waves are divided into Simple and Complex.
The following settings are used:
Basic Waves: allows traders to activate waves I, V and N
Complex Waves: allows traders to activate waves P, Y and W
Overlapping waves: to avoid missing out on any of the waves activated
Show last X waves: how many waves will be displayed
🔹 Basic Waves
The three basic waves
The basic waves from which all waves are made are I, V, and N
I wave: one leg moves
V wave: two legs move, one against the other
N wave: Three legs move, push, pull back, and another push
🔹 Complex Waves
Three complex waves
There are other waves like
P wave: contracting market
Y wave: expanding market
W wave: double top or double bottom
🔶 PRICE THEORY
All targets for the current N wave with their calculations
This theory is based on identifying developing N waves and predicting potential price targets based on that developing wave.
The tool displays 4 basic targets (V, E, N, and NT) and 3 extended targets (2E and 3E) according to the calculations shown in the chart above. Traders can enable or disable each target in the settings panel.
🔶 USING EVERYTHING TOGETHER
Please DON'T do this. This is not how you use it
Now the real example:
Daily chart of Nasdaq 100 futures (NQ1!) with our Ichimoku analysis
Time, waves, and price theories go together as one:
First, we identify the current time cycles and wave structure.
Then we forecast the next cycle and possible key price levels.
We identify a Taito Suchi with both legs of exactly 41 candles on each I wave, both together forming a V wave, the last two I waves are part of a developing N wave, and the time cycle of the first one is 191 candles. We forecast this cycle into the future and get 22nd April as a key date, so in 6 trading days (as of this writing) the market would have completed another Taito Suchi pattern if a new wave and time cycle starts. As we have a developing N wave we can see the potential price targets, the price is actually between the NT and V targets. We have a bullish Kumo and the price is touching it, if this Kumo provides enough support for the price to go further, the market could reach N or E targets.
So we have identified the cycle and wave, our expectations are that the current cycle is another Taito Suchi and the current wave is an N wave, the first I wave went for 191 candles, and we expect the second and third I waves together to amount to 191 candles, so in theory the N wave would complete in the next 6 trading days making a swing high. If this is indeed the case, the price could reach the V target (it is almost there) or even the N target if the bulls have the necessary strength.
We do not predict the future, we can only aim to understand the current market conditions and have future expectations of when (time), how (wave), and where (price) the market will make the next turning point where one side of the market overcomes the other (bulls vs bears).
To generate this chart, we change the following settings from the default ones:
Swing length: 64
Show lines: disabled
Forecast pattern: TAITO SUCHI
Anchor forecast: 2
Show last time cycles: 5
I WAVE: enabled
N WAVE: disabled
Show last waves: 5
🔶 SETTINGS
Show Swing Highs & Lows: Enable/Disable points on swing highs and swing lows.
Swing Length: Number of candles to confirm a swing high or swing low. A higher number detects larger swings.
🔹 Ichimoku Kinkō Hyō
Show Lines: Enable/Disable the 5 Ichimoku lines: Kijun sen, Tenkan sen, Senkou span A & B and Chikou Span.
Show Kumo: Enable/Disable the Kumo (cloud). The Kumo is formed by 2 lines: Senkou Span A and Senkou Span B.
Tenkan Sen Length: Number of candles for Tenkan Sen calculation.
Kinjun Sen Length: Number of candles for the Kijun Sen calculation.
Senkou Span B Length: Number of candles for Senkou Span B calculation.
Chikou & Senkou Offset: Number of candles for Chikou and Senkou Span calculation. Chikou Span is plotted in the past, and Senkou Span A & B in the future.
🔹 Time Theory
Show Time Cycle Forecast: Enable/Disable time cycle forecast vertical lines. Disable for better performance.
Forecast Pattern: Choose between two patterns: Kihon Suchi (basic numbers) or Taito Suchi (equal numbers).
Anchor forecast on last X time cycle: Number of time cycles in the past to anchor the time cycle forecast. The larger the number, the deeper in the past the anchor will be.
Time Cycle Mode: Choose from 7 time cycle detection modes: Tenkan Sen cross, Kijun Sen cross, Kumo change between bullish & bearish, swing highs only, swing lows only, both swing highs & lows and wave detection.
Wave Cycle: Choose which type of wave to detect from 6 different wave types when the time cycle mode is set to WAVES.
Show Time Cycles: Enable/Disable time cycle horizontal lines. Disable for better performance.
how last X time cycles: Maximum number of time cycles to display.
🔹 Wave Theory
Basic Waves: Enable/Disable the display of basic waves, all at once or one at a time. Disable for better performance.
Complex Waves: Enable/Disable complex wave display, all at once or one by one. Disable for better performance.
Overlapping Waves: Enable/Disable the display of waves ending on the same swing point.
Show last X waves: 'Maximum number of waves to display.
🔹 Price Theory
Basic Targets: Enable/Disable horizontal price target lines. Disable for better performance.
Extended Targets: Enable/Disable extended price target horizontal lines. Disable for better performance.

Timeframe Marker - know when timeframes start/end
When you're on a lower timeframe, it's important to know which timeframes are starting/ending.
Timeframe Marker will display a bars that stack notifying you of your chosen timeframes.
For example, if you're on the one minute chart or another low timeframe, you'll be aware of the larger timeframes are about to begin or start.
It's always good to select the lowest timeframe first in ascending order so that the lowest bar is the lowest timeframe and bars that stack on top are larger timeframes.
The default timeframes are:
• 5 minutes (green)
• 15 minutes (yellow)
• 1 hour (orange)
• 4 hour (red)
• daily (blue)
• weekly (purple)
• monthly (gray)
If your chart's timeframe is higher than the timeframe marker you've selected, then it won't display a bar stack for that timeframe as it would normally display on every bar (this is to avoid clutter).
The future timeframe marks basically will offset to future timeframes. Set how many bars forward you'd like to see.

Forex Sessions by CryptoforForex Sessions Boxes
Killzones are the period of greatest volatility, and volatility is one of the main factors for finding the optimal trade time (OTT/Optimal Trade Time). That is, in a period of high volatility, we as traders have the most chances to open a good position, and at the same time not to sit on the charts for too long waiting for its closing.
Sessions:
1. Asian Session:
2. Frankfurt Session:
3. London Session:
3. New York Session:
Features:
Time zone change
Session time change
Show/hide Historical Data
Show/hide Pips
Show/hide Previous Day High/Low
Show/hide New York Midnight/True Daily Open
Text size and align customization
Borders style
Line and border sizes
Full customization of colors: borders, price lines, text, background
ICT EverythingVersion 1.0
Global Settings
• Timezone Selection
• Hide Indicator Above Specified Time
Thematic Override
• Override Colors For Dark Theme ( Colors Set for White Theme by Default )
• Override Session Highlighting Color
Session Options
• Show Historical Sessions
• Enable/Disable Session Highlighting
• Session Specific Visibility
• Session's Crucial Time Vertical Lines w/ Options
NY Midnight Line Options
• Show Historical NY Midnight Vertical Lines
• Midnight Verticle Line Options
• Show Historical NY Midnight Price Lines
• Midnight Price Line Options
Opening Price Line Options
• New York 8:30 AM Price Line Settings
• Equities Open 9:30 AM Price Line Settings
• Option to Display Historical Price Lines
HTF Levels
• Weekly Open
• Monthly Open
label Settings
• Show/Hide Label Text
• Show/Hide Label
Day of Week
• Show Day of Week at the bottom of chart w/ Time Co-ordinates Selection
••• Message Me For Link to Frequently Updated Version of This Indicator •••

Kill ZonesSo over the passed year or so i have been noticing a phenomonon that the HIGH or LOW of the day will almost ALWAYS be posted during the first 2 hours of NYC open
Thus this indicator was born to help with the visual when NYC open session begins and also when NYC closes
I also listed LONDON session as it does provide some context but IMO just focus on NYC
DM me here or on twitter for access!

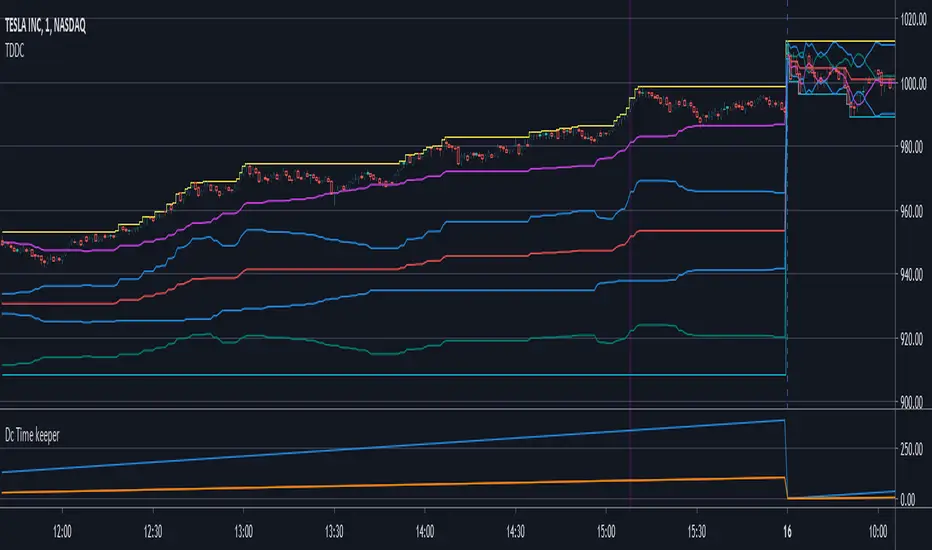
DC Time KeeperBefore anything, take notes of the script limitations :
1) This script doesn't give trading information on itself.
It is intended has additional value to my other script named : Time Dilated Donchian Channel
Blue line = Normal time of the day
Orange line = Observed time of the day
Red line = What if time travel was allowed... Which time would I observe?
More information about this script :
2) The script has the setting : "Max_bars_back" set to 390. This is required to use dynamic length and an "internal clock"
*390 is the normal number of bars in a typical stock trading day.
3) The script requires volume data to work correctly
* I use a way to represent volatility that requires ( volume + price movement + time, no sma , no stdev)
Why ? Because:
HIGH-LOW = Fail to get gap information, fail to get volume information
TR /ATR = Fail to get volume information
STDEV = Not very good with dynamic length as it use SMA and fails when length <2
SMA = SMA give very strange results when using non-integer numbers.
So a good idea is to use the 1 minute timeframe for this indicator.
Conclusion: this script is basically limited to stock trading.
If I could set Max_bars_back to 23 400 this would even work better with a 1 second time frame as more data would be entered in the system.
The idea behind the script is that volatility exists in two different formats depending on how you observe the situation.
Remember your physics class? Light can be a wave or a particle depending of the situation.
Volatility seems to share a strange similar property.
If volatility share similarities with light, then time dilation effect could be applied to stock movement.
Time Dilation formula
Time observed = (Last time - First time) / sqrt(1-(pow(v,2)/pow(c,2))
I've tried a lot of ways to use this formula as is.
Problem is : C.
C is the speed of light and I haven't found the equivalent stock market constant yet.
In order to keep the law of physics like they actually work, when a new time is set, I had to "Protect its value".
protected_new_time = highest_(observed time , normal time)
No time travel is allowed. *yet.
For more information about time dilation:
en.wikipedia.org

Time Dilated Donchian ChannelBefore anything, take notes of the script limitations :
1) The script has the setting : "Max_bars_back" set to 390. This is required to use dynamic length and an "internal clock"
*390 is the normal number of bars in a typical stock trading day.
2) The script requires volume data to work correctly
* I use a way to represent volatility that requires ( volume + price movement + time, no sma , no stdev)
Why ? Because:
HIGH-LOW = Fail to get gap information, fail to get volume information
TR /ATR = Fail to get volume information
STDEV = Not very good with dynamic length as it use SMA and fails when length <2
SMA = SMA give very strange results when using non-integer numbers.
So a good idea is to use the 1 minute timeframe for this indicator.
Conclusion: this script is basically limited to stock trading.
If I could set Max_bars_back to 23 400 this would even work better with a 1 second time frame as more data would be entered in the system.
The idea behind the script is that volatility exists in two different formats depending on how you observe the situation.
Remember your physics class? Light can be a wave or a particle depending of the situation.
Volatility seems to share a strange similar property.
If volatility share similarities with light, then time dilation effect could be applied to stock movement.
Time Dilation formula
Time observed = (Last time - First time) / sqrt(1-(pow(v,2)/pow(c,2))
I've tried a lot of ways to use this formula as is.
Problem is : C.
C is the speed of light and I haven't found the equivalent stock market constant yet.
So I had to tweak the time dilation formula to make it compatible with my volatility. The result is not perfect but it's interesting.
Sometime my volatility gets over that "unknown C stock market constant" which cause "Time travel"
In order to keep the law of physics like they actually work, when a new time is set, I had to "Protect its value".
protected_new_time = highest_(observed time , normal time)
No time travel is allowed. *yet.
I've "speculated" more signal lines by using mathematical geometry.
(Reflective & Inverted)
I've also created another Script that show you the effect volatility over time named : DC Time Keeper.
The script has no other use in itself. It's really only a way to represent how time gets slowed by speed.
For more information about time dilation:
en.wikipedia.org
⚛WPZO - Wave Period Zone Oscillator by Cryptorhythms⚛WPZO - Wave Period Zone Oscillator by Cryptorhythms
Intro
Based upon Akram El Sherbini's article "Time Cycle Oscillators" published in IFTA journal 2018.
Companion indicator to the Wave Period Oscillator, this is simply a transformation to display in a familiar manner like an RSI. Occasionally WPO can exceed the upper and lower boundary lines in strong moves. With WPZO, it will never go below -80 or above +80.
Description
In the Authors words....
"The wave period zone oscillator (WPZO) is a bounded oscillator for the wave period oscillator (WPO) and calculates the period of the market’s cycle. In other words, the wave period refers to the time taken by buyers or sellers to complete one cycle. The oscillator moves within a range of -100 to 100 percent.
The WPZO has overbought and oversold levels at +40 and -40 respectively. At extreme periods, the oscillator may reach the levels of +60 and -60. The zero level demonstrates an equilibrium between the periods of bulls and bears. The WPZO oscillates between +40 and -40. The crossover at those levels creates buy and sell signals. In an uptrend, the WPZO fluctuates between 0 and +40 where the bulls are controlling the market.
On the contrary, the WPZO fluctuates between 0 and -40 during downtrends where the bears control the market. Reaching the extreme level of -60 in an uptrend is a sign of weakness. Mostly, the oscillator will retrace from its centerline rather than the upper boundary of +40. On the other hand, reaching +60 in a downtrend is a sign of strength, and the oscillator will not be able to reach its lower boundary of -40.
During an ideal uptrend, the WPZO does not reach the lower boundary of -40 and usually rebounds from a higher level than -40. This means that the bulls have taken control earlier. Hence, a zeroline crossover generates a buy signal. The WPZO crosses the upper boundary at +40, then pulls back again below +40 to generate a sell signal. During sideways, the WPZO fluctuates between the lower and upper boundaries of -40 and +40. This tactic is also used in an uptrend where corrections are strong enough to drive the WPZO line below the lower boundary. During downtrends, the WPZO fails to reach the upper boundary and oscillates between the 0 and -40 levels.
The bears enter early, indicating an obvious weakness in the market. Therefore, crossing the zero level generates a sell signal. The exit at weakness tactic is used during uptrend reversals and downtrends. The WPZO oscillates between the centerline and the lower boundary of -40. The bears are controlling the market and move in wide cycle periods, while the bull’s strength is almost absent. An exit signal is triggered once the WPZO crosses -40. When prices decline, the WPZO may cross its extreme lower boundary at -60. Therefore, a swift exit signal is triggered once the WPZO crosses -40.
The WPZO gives an insight about the relation between time and price movements. In this article, we used the oscillator to differentiate between the time taken by bulls and bears to complete one cycle. Due to the boundaries effect, the WPZO may diverge less than the WPO with prices."
TL:DR
More strategy discussed above, but heres the short version:
Bullish signals are generated when WPZO crosses over 0
Bearish signals are generated when WPZO crosses under 0
OverBought level is 40
OverSold level is -40
ExtremeOB level is 60
ExtremeOS level is -60
👍 Enjoying this indicator or find it useful? Please give me a like and follow! I post crypto analysis, price action strategies and free indicators regularly.
💬 Questions? Comments? Want to get access to an entire suite of proven trading indicators? Come visit us on telegram and chat, or just soak up some knowledge. We make timely posts about the market, news, and strategy everyday. Our community isn't open only to subscribers - everyone is welcome to join.
For Trialers & Chat: t.me

⚛SHO - Simple Harmonic Oscillator by Cryptorhythms⚛SHO - Simple Harmonic Oscillator by Cryptorhythms
Intro
SHO – Simple Harmonic Oscillator - A Time Cycle Oscillator. Published in IFTA Journal 2018 by Akram El Sherbini.
Description
Bullish signals are generated when SHO crosses over 0
Bearish signals are generated when SHO crosses under 0
OverBought level is 40
OverSold level is -40
ExtremeOB level is 60
ExtremeOS level is -60
As with most oscillators, divergences can be taken advantage of.
Zero line represent the point of control between bears and bulls. A companion indicator to the Simple Harmonic Index ()
👍 Enjoying this indicator or find it useful? Please give me a like and follow! I post crypto analysis, price action strategies and free indicators regularly.
💬 Questions? Comments? Want to get access to an entire suite of proven trading indicators? Come visit us on telegram and chat, or just soak up some knowledge. We make timely posts about the market, news, and strategy everyday. Our community isn't open only to subscribers - everyone is welcome to join.
For Trialers & Chat: t.me

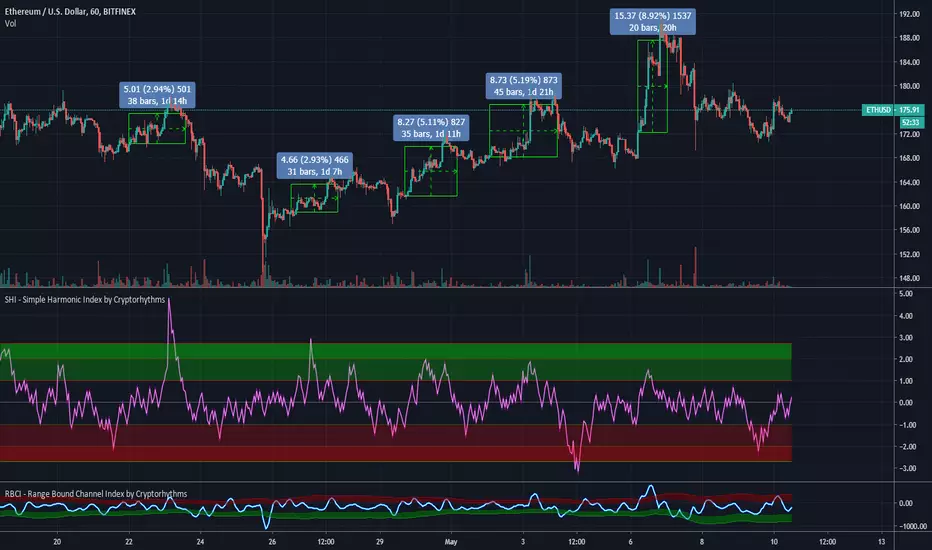
🆓 SHI - Simple Harmonic Index by Cryptorhythms🆓 SHI - Simple Harmonic Index by Cryptorhythms
Intro
The indicator is based on Akram El Sherbini's article "Time Cycle Oscillators" published in IFTA journal 2018.
The simple harmonic index (SHI) is based on the derivations of the simple harmonic equation.
Description
The trading tactic used for the simple harmonic index is merely the centerline crossover. A buy signal is generated when the SHI line moves above the zero level to turn positive. The period of the bull cycle rises, leading to an increase in price displacement. A sell signal is generated when the SHI line crosses down the centerline to turn negative.
Alternately I provided overbought and oversold zones. With these you can use the signal line reentry to the channel as an entry or exit signal. Just keep in mind if you enter a position based on this rules and the signal line goes back into OB/OS area, you should exit as it maybe a false entry.
What I would recommend is using the 0 crossover strategy, and the OB/OS zones as potential turnaround areas.
TL:DR
Bullish signals are generated when SHI crosses over 0
Bearish signals are generated when SHI crosses under 0
I put a few example trades up on the chart.
👍 Enjoying this indicator or find it useful? Please give me a like and follow! I post crypto analysis, price action strategies and free indicators regularly.
💬 Questions? Comments? Want to get access to an entire suite of proven trading indicators? Come visit us on telegram and chat, or just soak up some knowledge. We make timely posts about the market, news, and strategy everyday. Our community isn't open only to subscribers - everyone is welcome to join.
For Trialers & Chat: t.me