Market Sentiment Index US Top 40 [Pt]▮Overview
Market Sentiment Index US Top 40 [Pt} shows how the largest US stocks behave together. You pick one simple measure—High Low breakouts, Above Below moving average, or RSI overbought/oversold—and see how many of your chosen top 10/20/30/40 NYSE or NASDAQ names are bullish, neutral, or bearish.
This tool gives you a quick view of broad-market strength or weakness so you can time trades, confirm trends, and spot hidden shifts in market sentiment.
▮Key Features
► Three Simple Modes
High Low Index: counts stocks making new highs or lows over your lookback period
Above Below MA: flags stocks trading above or below their moving average
RSI Sentiment: marks overbought or oversold stocks and plots a small histogram
► Universe Selection
Top 10, 20, 30, or 40 symbols from NYSE or NASDAQ
Option to weight by market cap or treat all symbols equally
► Timeframe Choice
Use your chart’s timeframe or any intraday, daily, weekly, or monthly resolution
► Histogram Smoothing
Two optional moving averages on the sentiment bars
Markers show when the faster average crosses above or below the slower one
► Ticker Table
Optional on-chart table showing each ticker’s state in color
Grid or single-row layout with adjustable text size and color settings
▮Inputs
► Mode and Lookback
Pick High Low, Above Below MA, or RSI Sentiment
Set lookback length (for example 10 bars)
If using Above Below MA, choose the moving average type (EMA, SMA, etc.)
► Universe Setup
Market: NYSE or NASDAQ
Number of symbols: 10, 20, 30, or 40
Weights: on or off
Timeframe: blank to match chart or pick any other
► Moving Averages on Histogram
Enable fast and slow averages
Set their lengths and types
Choose colors for averages and markers
► Table Options
Show or hide the symbol table
Select text size: tiny, small, or normal
Choose layout: grid or one-row
Pick colors for bullish, neutral, and bearish cells
Show or hide exchange prefixes
▮How to Read It
► Sentiment Bars
Green means bullish
Red means bearish
Near zero means neutral
► Zero Line
Separates bullish from bearish readings
► High Low Line (High Low mode only)
Smooth ratio of highs versus lows over your lookback
► MA Crosses
Fast MA above slow MA hints rising breadth
Fast MA below slow MA hints falling breadth
► Ticker Table
Each cell colored green, gray, or red for bull, neutral, or bear
▮Use Cases
► Confirm Market Trends
Early warning when price makes highs but breadth is weak
Catch rallies when breadth turns strong while price is flat
► Spot Sector Rotation
Switch between NYSE and NASDAQ to see which group leads
Watch tech versus industrial breadth to track money flow
► Filter Trade Signals
Enter longs only when breadth is bullish
Consider shorts when breadth turns negative
► Combine with Other Indicators
Use RSI Sentiment with trend tools to spot overextended moves
Add volume indicators in High Low mode for breakout confirmation
► Timeframe Analysis
Daily for big-picture bias
Intraday (15-min) for precise entries and exits
Top40

Volume Stack US Top 40 [Pt]█ Overview
Volume Stack US Top 40 is a versatile TradingView indicator designed to give you an at-a-glance view of market sentiment and volume dynamics across the top 40 U.S. large-cap stocks. Inspired by the popular Saty Volume Stack, this enhanced version aggregates essential volume and price strength data from major tickers on both the NYSE and NASDAQ, and works seamlessly on all timeframes.
█ Key Features
Dynamic Buy / Sell Volume Stack: This indicator dynamically stacks the volume bars so that the side with higher volume appears on top. For example, green over red signals more buy-side volume, while red over green indicates greater sell-side volume.
Cross-Market Analysis: Easily toggle between NYSE and NASDAQ to analyze the most influential U.S. stocks. The indicator automatically loads the correct set of tickers based on your selection.
Flexible Coverage: Choose from Top 10, Top 20, Top 30, or Top 40 tickers to tailor the tool to your desired scope of analysis.
Dynamic Table Display: A neat on-chart table lists the selected ticker symbols along with visual cues that reflect each stock’s strength. You can even remove exchange prefixes for a cleaner look.
█ Inputs & Settings
Market Selector: Choose whether to view data from the NYSE or NASDAQ; the indicator automatically loads the corresponding list of top tickers.
Number of Tickers: Select from ‘Top 10’, ‘Top 20’, ‘Top 30’, or ‘Top 40’ stocks to define the breadth of your analysis.
Color Options: Customize the colors for bullish and bearish histogram bars to suit your personal style.
Table Preferences: Adjust the on-chart table’s display style (grid or one row), text size, and decide whether to show exchange information alongside ticker symbols.
█ Usage & Benefits
Volume Stack US Top 40 is ideal for traders and investors who need a clear yet powerful tool to gauge overall market strength. By combining volume and price action data across multiple major stocks, it helps you:
Quickly assess whether the market sentiment is bullish or bearish.
Confirm trends by comparing volume patterns against intraday price movements.
Enhance your trading decisions with a visual representation of market breadth and dynamic buy/sell volume stacking.
Its intuitive design means you spend less time adjusting complex settings and more time making confident, informed decisions.

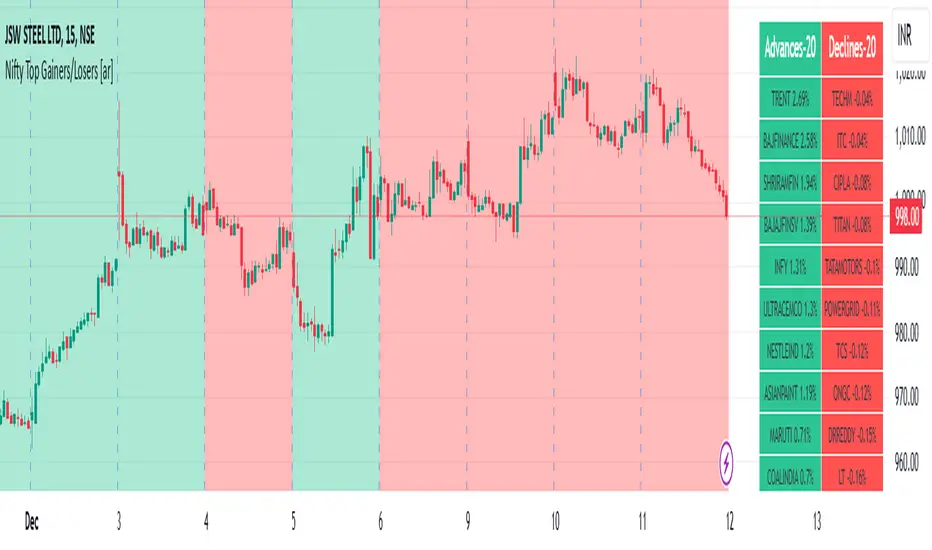
Nifty Top Gainers/Losers [ar]Nifty Top Gainers/Losers - Real-time Market Performance Tracker
A powerful indicator that monitors and displays real-time performance of 40 major Nifty stocks in a clean, organized table format. Perfect for traders seeking instant market breadth insights.
Key Features:
• Dynamic advances/declines counter at the top
• Real-time percentage change calculations
• Color-coded display (green for gainers, red for losers)
• Customizable reference points (Previous Day Close/Today's Open)
• Optional background color based on market breadth
• Flexible top gainers/losers limit setting
Customization Options:
- Adjust colors for gainers and losers
- Set transparency for background
- Modify the number of top performers to display
- Add/remove symbols from the watchlist
- Choose calculation reference (Previous Day Close/Today's Open)
Ideal for:
- Day traders monitoring market momentum
- Investors tracking sector rotation
- Analysts studying market breadth
- Portfolio managers seeking quick market overview
This indicator helps identify market leaders and laggards at a glance, making it an essential tool for informed trading decisions.