End Of MooveINDICATOR: END OF MOOVE (EOM)
1. Overview
The EndOfMoove (EOM) is a specialized volatility analysis tool designed to detect market exhaustion and potential price reversals. By utilizing a modified Williams Vix Fix (WVF) logic, it identifies when fear or selling pressure has reached a statistical extreme relative to recent history.
---
2. Core Logic & Calculation
The script functions by measuring the "synthetic" volatility created during sharp price drops and momentum shifts.
* Williams Vix Fix (WVF) Logic: It calculates the distance between the current low and the highest close over a specific lookback period ( 20 bars by default ). This creates a volatility spike during market bottoms or rapid corrections.
* Dynamic Normalization: The indicator continuously tracks the Historical Maximum of this volatility over a long window ( 250 bars ).
* Statistical Thresholding: It sets a "Danger Zone" at a specific percentage ( 75% ) of that historical maximum to filter out noise and isolate significant exhaustion events.
---
3. Adaptive Intelligence (Detection & Smoothing)
The EOM adapts to different market conditions through its detection engine:
1. Spike Confirmation: To avoid premature entries, the script uses a confirmation window ( 3 bars ). A signal is only "confirmed" if the current volatility spike is the highest within this local window.
2. Variable Smoothing: Traders can apply an internal SMA smoothing to the raw volatility data to filter out erratic price action on lower timeframes.
---
4. Visual Anatomy
The interface uses a high-contrast design to highlight institutional exhaustion:
* The Histogram:
* Faded Gray: Represents standard market volatility. The transparency is dynamic ; it darkens as volatility rises, signaling a buildup in pressure.
* Bright White: Activates when the volatility crosses the Dynamic Threshold , marking a high-probability exhaustion zone.
* The Threshold Line: A continuous horizontal boundary that represents the 75% of historical max , acting as the "Trigger Line."
* Signal Triangles: A small white triangle appears at the top of the indicator when a Volatility Spike is statistically confirmed.
---
5. How to Trade with EndOfMoove
* Spotting Bottoms: Large white columns often coincide with "capitulation" phases. When the histogram reaches these levels, the current downward move is likely overextended.
* Divergence Watch: If price makes a new low but the EOM histogram shows a lower spike than the previous one, it indicates that selling pressure is drying up.
* Volatility Breakouts: A sudden transition from faded gray to bright white suggests an impulse move that is reaching its peak velocity.
---
6. Technical Parameters
* WVF Period: Controls the sensitivity of the raw volatility calculation.
* Historical Max Period: Determines the depth of the statistical database (50 to 500 bars).
* Threshold %: Allows the trader to tighten or loosen the "Extreme" zone (set to 75% for balanced results).
Trading-strategy

Phase Cross Strategy with Zone### Introduction to the Strategy
Welcome to the **Phase Cross Strategy with Zone and EMA Analysis**. This strategy is designed to help traders identify potential buy and sell opportunities based on the crossover of smoothed oscillators (referred to as "phases") and exponential moving averages (EMAs). By combining these two methods, the strategy offers a versatile tool for both trend-following and short-term trading setups.
### Key Features
1. **Phase Cross Signals**:
- The strategy uses two smoothed oscillators:
- **Leading Phase**: A simple moving average (SMA) with an upward offset.
- **Lagging Phase**: An exponential moving average (EMA) with a downward offset.
- Buy and sell signals are generated when these phases cross over or under each other, visually represented on the chart with green (buy) and red (sell) labels.
2. **Phase Zone Visualization**:
- The area between the two phases is filled with a green or red zone, indicating bullish or bearish conditions:
- Green zone: Leading phase is above the lagging phase (potential uptrend).
- Red zone: Leading phase is below the lagging phase (potential downtrend).
3. **EMA Analysis**:
- Includes five commonly used EMAs (13, 26, 50, 100, and 200) for additional trend analysis.
- Crossovers of the EMA 13 and EMA 26 act as secondary buy/sell signals to confirm or enhance the phase-based signals.
4. **Customizable Parameters**:
- You can adjust the smoothing length, source (price data), and offset to fine-tune the strategy for your preferred trading style.
### What to Pay Attention To
1. **Phases and Zones**:
- Use the green/red phase zone as an overall trend guide.
- Avoid taking trades when the phases are too close or choppy, as it may indicate a ranging market.
2. **EMA Trends**:
- Align your trades with the longer-term trend shown by the EMAs. For example:
- In an uptrend (price above EMA 50 or EMA 200), prioritize buy signals.
- In a downtrend (price below EMA 50 or EMA 200), prioritize sell signals.
3. **Signal Confirmation**:
- Consider combining phase cross signals with EMA crossovers for higher-confidence trades.
- Look for confluence between the phase signals and EMA trends.
4. **Risk Management**:
- Always set stop-loss and take-profit levels to manage risk.
- Use the phase and EMA zones to estimate potential support/resistance areas for exits.
5. **Whipsaws and False Signals**:
- Be cautious in low-volatility or sideways markets, as the strategy may generate false signals.
- Use additional indicators or filters to avoid entering trades during unclear market conditions.
### How to Use
1. Add the strategy to your chart in TradingView.
2. Adjust the input settings (e.g., smoothing length, offsets) to suit your trading preferences.
3. Enable the strategy tester to evaluate its performance on historical data.
4. Combine the signals with your own analysis and risk management plan for best results.
This strategy is a versatile tool, but like any trading method, it requires proper understanding and discretion. Always backtest thoroughly and trade with discipline. Let me know if you need further assistance or adjustments to the strategy!

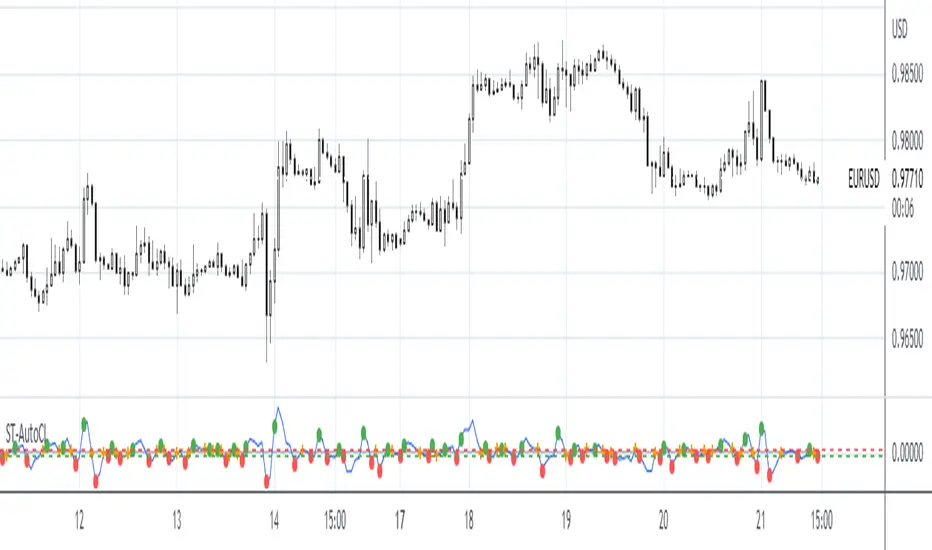
GP - SRSI ChannelGP - SRSI Channel Indicator
The GP - SRSI Channel is a channel indicator derived from the Stochastic RSI (SRSI) oscillator. It combines SRSI data from multiple timeframes to analyze minimum, maximum, and closing values, forming a channel based on these calculations. The goal is to identify overbought and oversold zones with color coding and highlight potential trading opportunities by indicating trend reversal points.
How It Works
SRSI Calculation: The indicator calculates the Stochastic RSI values using open, high, low, and close prices from the selected timeframes.
Channel Creation: Minimum and maximum values derived from these calculations are combined across multiple timeframes. The midpoint is calculated as the average of these values.
Color Coding: Zones within the channel are color-coded with a gradient from red to green based on the ratios. Green zones typically indicate selling opportunities, while red zones suggest buying opportunities.
Visual Elements:
The channel boundaries (min/max) are displayed as lines.
Overbought/oversold regions (95-100 and 0-5) are highlighted with shaded areas.
Additional explanatory labels are placed on key levels to guide users.
How to Use
Trading Strategy: This indicator can be used for both trend following and identifying reversal points. Selling opportunities can be evaluated when the channel reaches the upper green zone, while buying opportunities can be considered in the lower red zone.
Timeframe Selection: Users can analyze multiple timeframes simultaneously to gain a broader perspective.
Customization: RSI and Stochastic RSI parameters are adjustable, allowing users to tailor the indicator to their trading strategies.
Important Note
This indicator is for informational purposes only and should not be used as a sole basis for trading decisions. Please validate the results of the indicator with your own analysis.

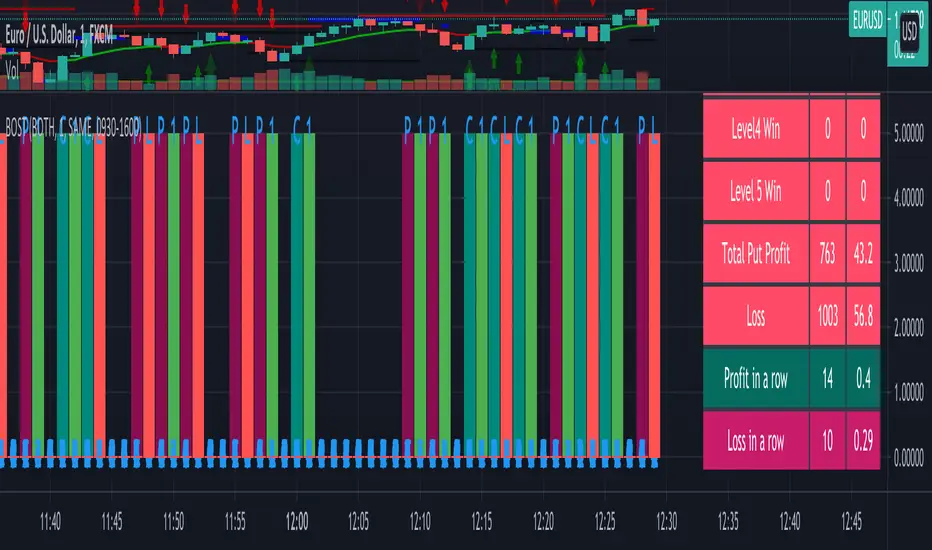
Binary Option Strategy Tester with Martingale-Basic V.2In Binary options, strategy testing is a bit different. The strategy result depends upon expiry intervals and payout ratio.
My previous script was a try to resolve this but has some bugs in specific choices. The new version overcame those and added some new features useful for binary option strategy testing.
Assumption:
We are opening position at next candle after signal come
Chart interval is option expiry time.
We are taking the position at opening price
Our call will be profitable if we get a green candle and put will be profitable if we get a red candle
We can open only one trade at a time. So if we are in trade, subsequent signals will be ignored.
All Input Options:
Test Call/Put individually or both. Default BOTH
Select up to 5 Martingale levels. Default 2
Type of Martingale Trade. Default “SAME”
“SAME”: If you are trading CALL and incur a loss, you are taking CALL in subsequent Martingale levels.
“OPSITE”: if you are trading CALL and incur a loss, you are taking PUT in subsequent Martingale levels.
“FOLLOW CANDLE COLOR”: You are following candle color in Martingale levels, i.e if the loss candle is RED, you are taking PUT in subsequent candles.
“OPPOSITE CANDLE COLOR”: You are taking opposite candle color trade, i.e if the loss candle is RED, you are taking CALL in subsequent candle.
Select Specific Trading Session. Please select “USE SPECIFIC SESSION”. Default: TRUE
Put the investment amount per option. Default: 10
Payout ratio. Default: 80%
The strategy is taken from Vdub Binary Options SniperVX v1 (by @vdubus). I have deleted extra parts and kept only the necessary parts.
Result Table
Signal and Win Levels:
Signal and Loss:
Please note that Binary options trading is very risky. You must be aware of the risk and be willing to accept them in order to invest in binary options. Only invest what you can afford to lose. The past performance of any trading system, strategy, or methodology is not necessarily indicative of future results.

SpreadTrade - Auto-Cointegration (ps5)Decsription: Auto-Cointegration-Based Pair Trading Strategy (revised version)
To review, there are three popular styles of Pair trading: distance-based pair trading, correlation-based pair trading and cointegration-based pair trading. Typically, they require preliminary statistical estimation of the viability of the corresponding strategy.
Basically a pair trade strategy boils down to shorting the outperforming instrument and going long on the underperforming instrument whenever the temporary correlation weakens which means one instrument is going up and another is going down. Apart from the typical cointegration strategy which employs two cointegrated instruments, this script uses just one instrument, in base timeframe and in lagged timeframe, actually making it an auto-cointegration, or better still, an auto-correlation strategy.
Notice that each moving average function may require different Threshold settings.The orange cross symbol indicates the exit points. To filter out the signals use higher values for the LongWindow and the Threshold parameters. Also pay attention that in some cases with some moving averages the color of the signals has to be inverted.
Binary Option Strategy Tester with MartingaleIn Binary options, strategy testing is a bit different. The script is just a try to test Binary options strategies.
Assumption:
We are opening position at next candle after signal come
We are taking the position at opening price
Our call will be profitable if we get a green candle and put will be profitable if we get a red candle
We can open only one trade at a time. So if we are in trade, subsequent signals will be ignored.
The script is not counting your profit or loss, it just counting the winning and losing trades.
Input Options:
Choose long only or short only test. Default is both.
You can continue your trade with Martingale Level, up to 5. Default is 1 (no Martingale)
You can choose Martingale trade type
SAME: if call subsequent trade will be call only and vice versa
OPPOSITE: if call subsequent trade will be put
FOLLOW CANDLE COLOR: Subsequent trade will follow previous candle color
OPPOSITE CANDLE COLOR: Subsequent trade will opposite of previous candle color
You can choose trading session to test. Default is false.
The strategy is taken from Vdub Binary Options SniperVX v1 (by @vdubus) . I have deleted extra parts and kept only the necessary part.
Without Martingale
Result Table
With Martingale
I am very new to Pine script, so waiting for your comments and review.
eha Moving Averages StrategyMoving Average based strategies are very popular ones among both long-term investors and short-term traders as they can be tailored to any time frame. One of the main moving average strategies are crossovers. The very simple type is a price crossover , which is when the price crosses above or below a moving average to signal a potential change in trend.
Another strategy is to apply two moving averages to a chart: one longer (or slow) and one shorter (or fast). When the shorter-term MA crosses above the longer-term MA, it's a buy signal, as it indicates that the trend is shifting up (also known as “ Golden Cross ”). Meanwhile, when the shorter-term MA crosses below the longer-term MA, it's a sell signal, as it indicates that the trend is shifting down (which is also known as “ Dead/Death Cross ”).
This is a study to find a suitable trading strategy for 4-6 hour time frames. As you can see the performance is currently very poor. It has just generated almost 90 trades in a very long period from January 2017 to the time of publishing the study for the first time.
Moving averages work quite well in strong trending conditions but poorly in choppy or ranging conditions. Adjusting the time frame can correct this problem temporarily, although, at some point, these issues are likely to occur regardless of the time frame chosen for the moving average(s).
I am working on this basic strategy to make its performance better and I will update the post in the future. So keep in touch by following the post.
Why have I republished my study?
It sounds like TradingView stores and indexes scripts based on the title of the post rather than the actual title of the scripts and if one chose general terms as the title of the post, the TradingView script search engine may be unable to find it. So I decided to repost the strategy with a more searchable and unique prefix of " eha ".
Please provide me with your precious feedback.

Simple BTC trading strategy based on yesterday's trading rangeOnce market opens, the strategy calculates the price to send a stop buy order
The order is calculated as the sum of yesterday's range multiplied by a special number and today's open price
System has no stops yet
System closes the position on session close
The performance is quite good
Feel free to use it and trade it
Good luck and good trading

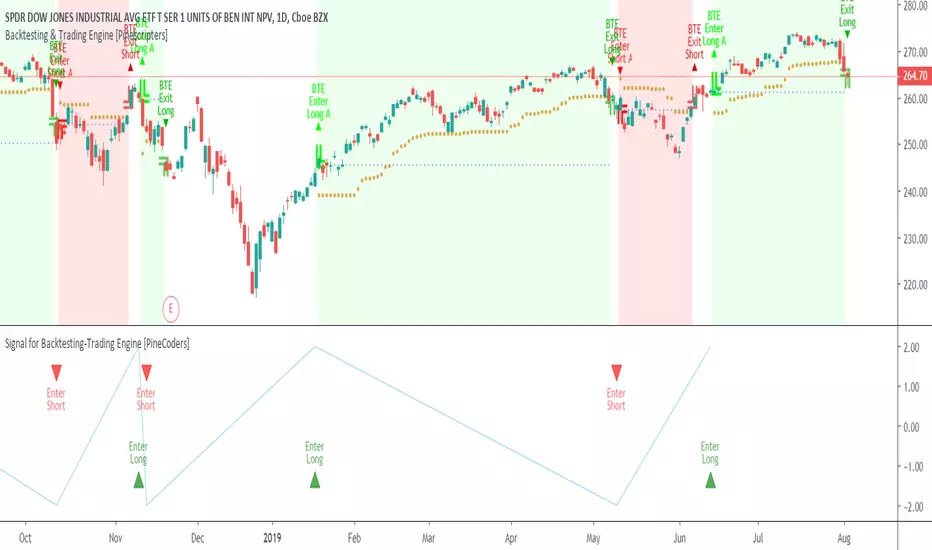
Signal for Backtesting-Trading Engine [PineCoders]This is a companion script to the PineCoders Backtesting-Trading Engine. It illustrates how to build a signal plot in another script, which can in turn be fed in the Engine to provide entry, exit, filter and stop information.
Connection to the Engine is done through its “External Indicator” input field at the very bottom of the Engine’s Settings/Inputs.
The Engine must be operating in study mode to be able to connect an external indicator to it.
The way this script builds the signal is straightforward, as you will see in the code. Two aspects are worth mentioning:
The “FudgeStop()” function used to fudge the stop value by one tick for the rare cases where it will match one of the protocol reserved values, i.e. 1, 2 or 3.
The priority and exclusivity given to the different types of signals in the signal-building “Signal = …” line. No two signals can be sent simultaneously through the signal plot, except for the entry and stop combination.
You can determine in this script’s Settings/Inputs the type of signals that will go through the signal plot.
This script respects the following protocol:
EXTERNAL SIGNAL PROTOCOL
Only one external indicator can be connected to a script; in order to leverage its use to the fullest, the engine provides options to use it as either an entry signal, an entry/exit signal or a filter. When used as an entry signal, you can also use the signal to provide the entry’s stop. Here’s how this works:
For filter state: supply +1 for bull (long entries allowed), -1 for bear (short entries allowed).
For entry signals: supply +2 for long, -2 for short.
For exit signals: supply +3 for exit from long, -3 for exit from short.
To send an entry stop level with an entry signal: Send positive stop level for long entry (e.g. 103.33 to enter a long with a stop at 103.33), negative stop level for short entry (e.g. -103.33 to enter a short with a stop at 103.33). If you use this feature, your indicator will have to check for exact stop levels of 1.0, 2.0 or 3.0 and their negative counterparts, and fudge them with a tick in order to avoid confusion with other signals in the protocol.
Remember that mere generation of the values by your indicator will have no effect until you explicitly allow their use in the appropriate sections of the Engine’s Settings/Inputs.
Look first. Then leap.