ATLAS_COREShared utility library for the ATLAS Trading Intelligence Suite. Provides brand colors, math utilities, candle analysis, grading system, visual helpers, and more.
Tradingtools

V-Max: Tactical Clock & Price (Master Fit)Overview
The V-Max Tactical Clock & Price is a high-visibility utility dashboard engineered for precision execution in global financial markets. It serves as a "Physical Timezone Navigator," providing real-time price tracking and synchronized local time display directly on the chart. This ensures traders can align their execution with specific market openings and closing volatility regardless of the exchange's default timezone.
Core Technical Logic & Features
This script focuses on the physics of time-alignment and visual stability:
Physical Time Calibration Engine: Unlike standard UI clocks, this script employs a millisecond-level compensation engine using the formula: $timenow + (tz\_offset \times 60 \times 60 \times 1000)$. This allows for precise synchronization with any global market (e.g., London, New York, or Asia sessions).
Momentum-Driven Price Rendering: The price display utilizes conditional coloring logic ($close \ge open ? up\_col : dn\_col$) to provide immediate visual feedback on the current bar's momentum.
High-Identifiability UI (Master Fit): Leverages the table.new titan rendering engine with size.huge font specifications for the price. This ensures critical data remains readable even on small mobile screens or high-density multi-chart layouts.
Anti-Flicker Monospaced Formatting: Employs font.family_monospace to ensure strict numerical alignment, preventing visual flickering or "jumping" during periods of extreme market volatility.
How to Use
Timezone Setup: Enter your local GMT offset (e.g., +8 for Taiwan/Singapore, -5 for New York) in the settings.
Visual Customization: Adjust the dashboard position (default: Bottom Left) and background aesthetics to fit your professional trading workspace.
產品概述
V-Max 戰術時鐘與價格顯示器是一款為全球市場設計的高辨識度工具。它作為一個實時的「全球時區導航儀」,在圖表上直接提供實時價格追蹤與同步化的本地時間顯示,確保交易者能精確對齊各國市場開盤瞬間的波動。
核心技術邏輯與功能物理時間校準引擎:採用毫秒級時間補償運算,公式為:$timenow + (tz\_offset \times 60 \times 60 \times 1000)$。這讓交易者能精確校準全球任一交易所的本地時間。
動能價格渲染:價格顯示具備即時漲跌變色邏輯,提供直觀的即時盤感反饋。
特大字體 UI (Master Fit):採用 size.huge 字體規格顯示價格,確保在移動端或複雜多圖表布局下依然清晰易讀。
防閃爍等寬格式:使用等寬字體確保數字在劇烈波動時不會產生視覺跳動,維持高度的讀數穩定性。
Access & Support
This script is published as a Free Public Utility in the TradingView Library. Disclaimer: For educational purposes only. Past performance does not guarantee future results.
Disclaimer: This script is for technical analysis and educational purposes only. It does not provide financial advice.

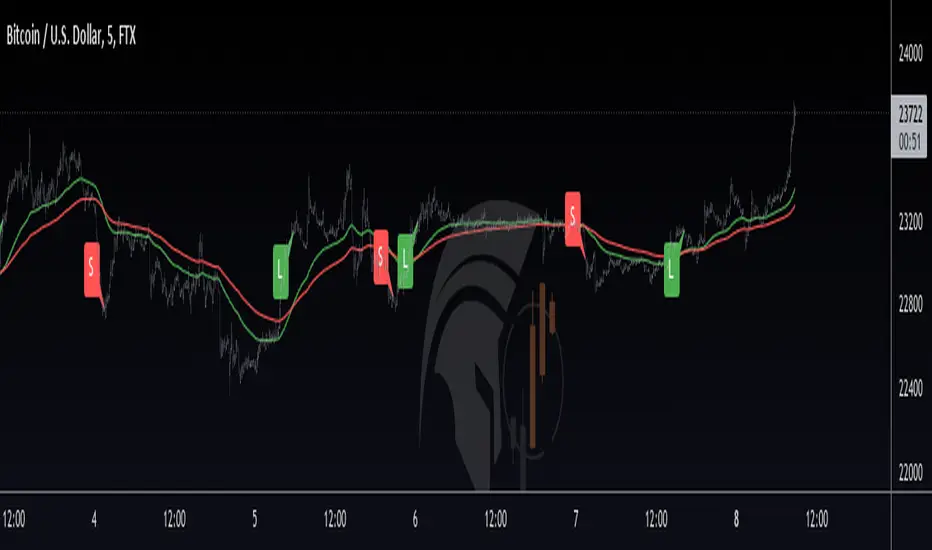
VWAP TrendSignalVWAP TrendSignal
VWAP (Volume-Weighted Average Price) is the market’s true fair value — the benchmark institutions use to see when price is balanced, extended, or trending with real intent.
Price often snaps back when it moves too far (mean reversion), and only shows genuine strength when it holds above or below VWAP.
VWAP TrendSignal makes this insight effortless by color-coding VWAP direction:
Yellow = VWAP rising → bullish pressure
Red = VWAP falling → bearish pressure
No bands. No noise. Just pure directional clarity.
Anchor VWAP to the Session, Week, Month, Quarter, or Year, and tailor the Slope Smoothing Filter to your timeframe:
1–2 smoothing → fast & reactive (1–5m scalping)
3–5 smoothing → clean & stable (5–15m intraday)
6–10 smoothing → slow flips (1H–4H swings)
10–15 smoothing → macro bias only (Daily/Weekly)
The line adapts to how you trade.
How to Use It
Mean Reversion
When price stretches far from VWAP, expect pullbacks or snapbacks.
Trend Direction
Yellow supports long bias, red supports short bias.
Simple, reliable, instantly visible.
Balance Zones
Price sitting near VWAP = compression, buildup, or chop.
A perfect signal to wait or prepare for a breakout.
Why It Works
VWAP TrendSignal distills institutional logic into a clean, single-line tool.
It shows fair value, trend slope, and balance all at once — making your chart clearer and your decisions faster.
Once you get used to reading it, trading without it feels blind.

ATR Dynamic Stop (Table + Plot + ATR %)📊 This script displays dynamic stop levels based on ATR, designed for active traders.
Features:
- Shows long and short stop levels (price ± ATR × multiplier).
- Displays values as a floating table on the top-right corner.
- Optional plot lines directly on the chart.
- Option to calculate based on realtime price or last close.
- Displays the ATR value both in price units and as a percentage of the selected price.
- Fully customizable table: text size, text color, background color.
Inputs:
- ATR Multiplier and Length.
- Show/hide stop lines on the chart.
- Select price source (realtime or last close).
- Table appearance options.
Ideal for:
- Traders who want a clear visual stop guide.
- Combining volatility with risk management.

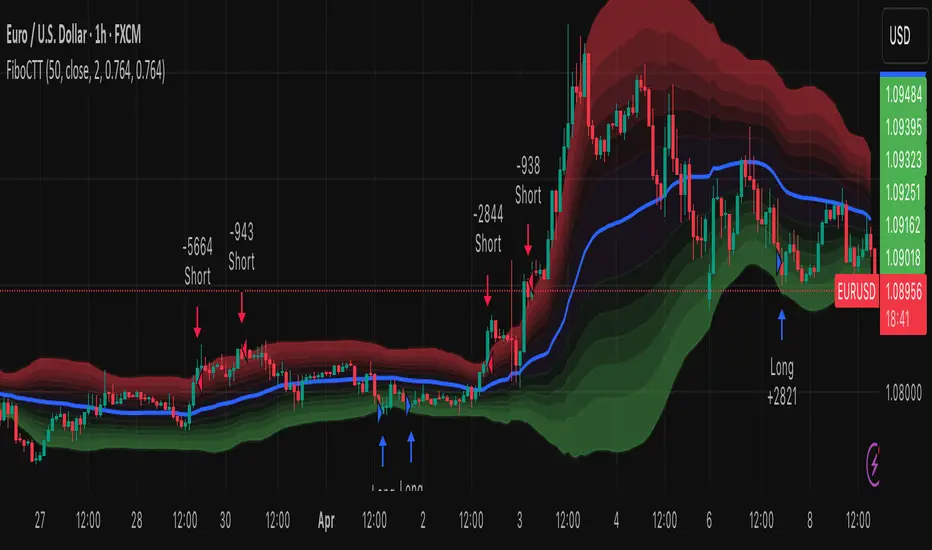
Fibonacci Counter-Trend TradingOverview:
The Fibonacci Counter-Trend Trading strategy is designed to capitalize on price reversals by utilizing Fibonacci levels calculated from the standard deviation of price movements. This strategy opens a sell order when the closing price crosses above a specified upper Fibonacci level and a buy order when the closing price crosses below a specified lower Fibonacci level. By leveraging the principles of Fibonacci retracement and volatility, this strategy aims to identify potential reversal points in the market.
How It Works:
Fibonacci Levels Calculation:
The strategy calculates upper and lower Fibonacci levels based on the standard deviation of the price over a specified moving average length. These levels are derived from the Fibonacci sequence, which is widely used in technical analysis to identify potential support and resistance levels.
The upper levels are calculated by adding specific Fibonacci ratios (0.236, 0.382, 0.5, 0.618, 0.764, and 1.0) multiplied by the standard deviation to the basis (the volume-weighted moving average).
The lower levels are calculated by subtracting the same Fibonacci ratios multiplied by the standard deviation from the basis.
Trade Entry Rules:
Sell Order: A sell order is triggered when the closing price crosses above the selected upper Fibonacci level. This indicates a potential reversal point where the price may start to decline.
Buy Order: A buy order is initiated when the closing price crosses below the selected lower Fibonacci level. This suggests a potential reversal point where the price may begin to rise.
Trade Management:
The strategy includes stop-losses based on the Fibonacci levels to protect against adverse price movements.
How to Use:
Users can customize the moving average length and the multiplier for the standard deviation to suit their trading preferences and market conditions.
The strategy can be applied to various financial instruments, including stocks, forex, and cryptocurrencies, making it versatile for different trading environments.
Pros:
The Fibonacci Counter-Trend Trading strategy combines the mathematical principles of the Fibonacci sequence with the statistical measure of standard deviation, providing a unique approach to identifying potential market reversals.
This strategy is particularly useful in volatile markets where price swings can lead to significant trading opportunities.
The use of Fibonacci levels can help traders identify key support and resistance areas, enhancing decision-making.
Cons:
The strategy may generate false signals in choppy or sideways markets, leading to potential losses if the price does not reverse as anticipated.
Relying solely on Fibonacci levels without considering other technical indicators or market conditions may result in missed opportunities or increased risk.
The effectiveness of the strategy can vary depending on the chosen parameters (e.g., moving average length and standard deviation multiplier), requiring users to spend time optimizing these settings for different market conditions.
As with any counter-trend strategy, there is a risk of significant drawdowns during strong trending markets, where the price continues to move in one direction without reversing.
By understanding the mechanics of the Fibonacci Counter-Trend Trading strategy, along with its pros and cons, traders can effectively implement it in their trading routines and potentially enhance their trading performance.
Metatrader CalculatorThe “ Metatrader Calculator ” indicator calculates the position size, risk, and potential gain of a trade, taking into account the account balance, risk percentage, entry price, stop loss price, and risk/reward ratio. It supports the XAUUSD, XAGUSD, and BTCUSD pairs, automatically calculating the position size (in lots) based on these parameters. The calculation is displayed in a table on the chart, showing the lot size, loss in dollars, and potential gain based on the defined risk.

Strategy Stats [presentTrading]Hello! it's another weekend. This tool is a strategy performance analysis tool. Looking at the TradingView community, it seems few creators focus on this aspect. I've intentionally created a shared version. Welcome to share your idea or question on this.
█ Introduction and How it is Different
Strategy Stats is a comprehensive performance analytics framework designed specifically for trading strategies. Unlike standard strategy backtesting tools that simply show cumulative profits, this analytics suite provides real-time, multi-timeframe statistical analysis of your trading performance.
Multi-timeframe analysis: Automatically tracks performance metrics across the most recent time periods (last 7 days, 30 days, 90 days, 1 year, and 4 years)
Advanced statistical measures: Goes beyond basic metrics to include Information Coefficient (IC) and Sortino Ratio
Real-time feedback: Updates performance statistics with each new trade
Visual analytics: Color-coded performance table provides instant visual feedback on strategy health
Integrated risk management: Implements sophisticated take profit mechanisms with 3-step ATR and percentage-based exits
BTCUSD Performance
The table in the upper right corner is a comprehensive performance dashboard showing trading strategy statistics.
Note: While this presentation uses Vegas SuperTrend as the underlying strategy, this is merely an example. The Stats framework can be applied to any trading strategy. The Vegas SuperTrend implementation is included solely to demonstrate how the analytics module integrates with a trading strategy.
⚠️ Timeframe Limitations
Important: TradingView's backtesting engine has a maximum storage limit of 10,000 bars. When using this strategy stats framework on smaller timeframes such as 1-hour or 2-hour charts, you may encounter errors if your backtesting period is too long.
Recommended Timeframe Usage:
Ideal for: 4H, 6H, 8H, Daily charts and above
May cause errors on: 1H, 2H charts spanning multiple years
Not recommended for: Timeframes below 1H with long history
█ Strategy, How it Works: Detailed Explanation
The Strategy Stats framework consists of three primary components: statistical data collection, performance analysis, and visualization.
🔶 Statistical Data Collection
The system maintains several critical data arrays:
equityHistory: Tracks equity curve over time
tradeHistory: Records profit/loss of each trade
predictionSignals: Stores trade direction signals (1 for long, -1 for short)
actualReturns: Records corresponding actual returns from each trade
For each closed trade, the system captures:
float tradePnL = strategy.closedtrades.profit(tradeIndex)
float tradeReturn = strategy.closedtrades.profit_percent(tradeIndex)
int tradeType = entryPrice < exitPrice ? 1 : -1 // Direction
🔶 Performance Metrics Calculation
The framework calculates several key performance metrics:
Information Coefficient (IC):
The correlation between prediction signals and actual returns, measuring forecast skill.
IC = Correlation(predictionSignals, actualReturns)
Where Correlation is the Pearson correlation coefficient:
Correlation(X,Y) = (nΣXY - ΣXY) / √
Sortino Ratio:
Measures risk-adjusted return focusing only on downside risk:
Sortino = (Avg_Return - Risk_Free_Rate) / Downside_Deviation
Where Downside Deviation is:
Downside_Deviation = √
R_i represents individual returns, T is the target return (typically the risk-free rate), and n is the number of observations.
Maximum Drawdown:
Tracks the largest percentage drop from peak to trough:
DD = (Peak_Equity - Trough_Equity) / Peak_Equity * 100
🔶 Time Period Calculation
The system automatically determines the appropriate number of bars to analyze for each timeframe based on the current chart timeframe:
bars_7d = math.max(1, math.round(7 * barsPerDay))
bars_30d = math.max(1, math.round(30 * barsPerDay))
bars_90d = math.max(1, math.round(90 * barsPerDay))
bars_365d = math.max(1, math.round(365 * barsPerDay))
bars_4y = math.max(1, math.round(365 * 4 * barsPerDay))
Where barsPerDay is calculated based on the chart timeframe:
barsPerDay = timeframe.isintraday ?
24 * 60 / math.max(1, (timeframe.in_seconds() / 60)) :
timeframe.isdaily ? 1 :
timeframe.isweekly ? 1/7 :
timeframe.ismonthly ? 1/30 : 0.01
🔶 Visual Representation
The system presents performance data in a color-coded table with intuitive visual indicators:
Green: Excellent performance
Lime: Good performance
Gray: Neutral performance
Orange: Mediocre performance
Red: Poor performance
█ Trade Direction
The Strategy Stats framework supports three trading directions:
Long Only: Only takes long positions when entry conditions are met
Short Only: Only takes short positions when entry conditions are met
Both: Takes both long and short positions depending on market conditions
█ Usage
To effectively use the Strategy Stats framework:
Apply to existing strategies: Add the performance tracking code to any strategy to gain advanced analytics
Monitor multiple timeframes: Use the multi-timeframe analysis to identify performance trends
Evaluate strategy health: Review IC and Sortino ratios to assess predictive power and risk-adjusted returns
Optimize parameters: Use performance data to refine strategy parameters
Compare strategies: Apply the framework to multiple strategies to identify the most effective approach
For best results, allow the strategy to generate sufficient trade history for meaningful statistical analysis (at least 20-30 trades).
█ Default Settings
The default settings have been carefully calibrated for cryptocurrency markets:
Performance Tracking:
Time periods: 7D, 30D, 90D, 1Y, 4Y
Statistical measures: Return, Win%, MaxDD, IC, Sortino Ratio
IC color thresholds: >0.3 (green), >0.1 (lime), <-0.1 (orange), <-0.3 (red)
Sortino color thresholds: >1.0 (green), >0.5 (lime), <0 (red)
Multi-Step Take Profit:
ATR multipliers: 2.618, 5.0, 10.0
Percentage levels: 3%, 8%, 17%
Short multiplier: 1.5x (makes short take profits more aggressive)
Stop loss: 20%

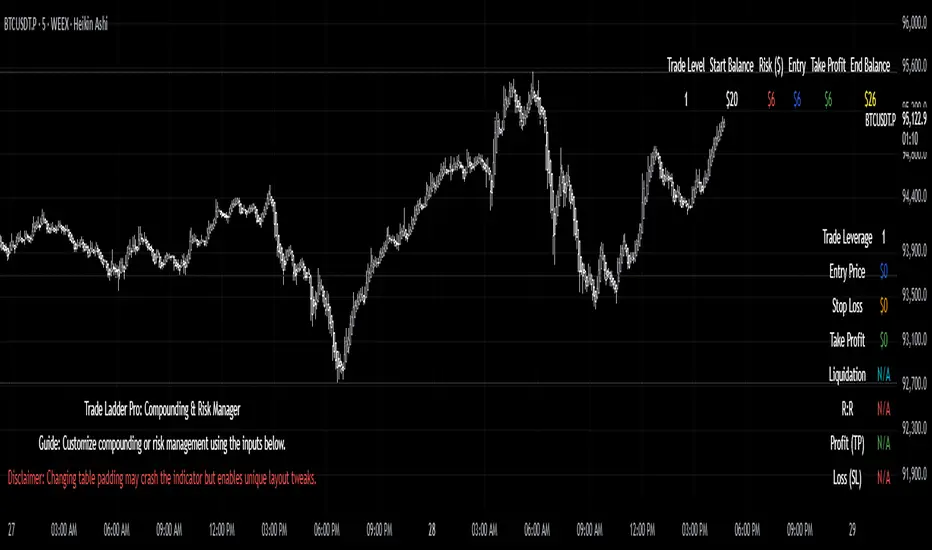
Trade Ladder Pro: Compounding & Risk ManagerTrade Ladder Pro: Compounding & Risk Manager
Inspired by the popular $20 to $52,000 trading challenge, this tool is designed to help you scale your trading account using systematic compounding and enhanced risk management techniques. Whether you’re aiming for disciplined growth or fine-tuning your risk/reward, Trade Ladder Pro offers a flexible approach to visualizing your trade levels.
How to Use:
Inputs:
Compounding Mode:
Set your starting balance, final balance goal, number of trades, and current trade level. You can move to the next trade after a successful trade in settings. The entries are not signals. They are there to help manage risk.
The script calculates the necessary compounding factor to grow your balance across the defined trades.
Risk Management Mode:
In addition to the above, specify a risk percentage and risk/reward ratio.
Input an entry price (or leave it at 0 to use the current price) to automatically compute the stop loss and take profit levels.
Display Options:
Choose the table’s position on the chart (e.g., Top Right, Top Left, Bottom Right, Bottom Left).
Pick between a vertical or horizontal layout for a display that suits your workflow.
Results:
The table will display the trade level, starting balance, risk amount, entry price, take profit, and (if in Risk Management mode) stop loss along with the projected ending balance.
Community & Feedback:
Your feedback is invaluable! Please share any tips or report any errors you encounter so we can continue to improve this tool. Happy trading!
StatPivot- Dynamic Range Analyzer - indicator [PresentTrading]Hello everyone! In the following few open scripts, I would like to share various statistical tools that benefit trading. For this time, it is a powerful indicator called StatPivot- Dynamic Range Analyzer that brings a whole new dimension to your technical analysis toolkit.
This tool goes beyond traditional pivot point analysis by providing comprehensive statistical insights about price movements, helping you identify high-probability trading opportunities based on historical data patterns rather than subjective interpretations. Whether you're a day trader, swing trader, or position trader, StatPivot's real-time percentile rankings give you a statistical edge in understanding exactly where current price action stands within historical contexts.
Welcome to share your opinions! Looking forward to sharing the next tool soon!
█ Introduction and How it is Different
StatPivot is an advanced technical analysis tool that revolutionizes retracement analysis. Unlike traditional pivot indicators that only show static support/resistance levels, StatPivot delivers dynamic statistical insights based on historical pivot patterns.
Its key innovation is real-time percentile calculation - while conventional tools require new pivot formations before updating (often too late for trading decisions), StatPivot continuously analyzes where current price stands within historical retracement distributions.
Furthermore, StatPivot provides comprehensive statistical metrics including mean, median, standard deviation, and percentile distributions of price movements, giving traders a probabilistic edge by revealing which price levels represent statistically significant zones for potential reversals or continuations. By transforming raw price data into statistical insights, StatPivot helps traders move beyond subjective price analysis to evidence-based decision making.
█ Strategy, How it Works: Detailed Explanation
🔶 Pivot Point Detection and Analysis
The core of StatPivot's functionality begins with identifying significant pivot points in the price structure. Using the parameters left and right, the indicator locates pivot highs and lows by examining a specified number of bars to the left and right of each potential pivot point:
Copyp_low = ta.pivotlow(low, left, right)
p_high = ta.pivothigh(high, left, right)
For a point to qualify as a pivot low, it must have left higher lows to its left and right higher lows to its right. Similarly, a pivot high must have left lower highs to its left and right lower highs to its right. This approach ensures that only significant turning points are recognized.
🔶 Percentage Change Calculation
Once pivot points are identified, StatPivot calculates the percentage changes between consecutive pivot points:
For drops (when a pivot low is lower than the previous pivot low):
CopydropPercent = (previous_pivot_low - current_pivot_low) / previous_pivot_low * 100
For rises (when a pivot high is higher than the previous pivot high):
CopyrisePercent = (current_pivot_high - previous_pivot_high) / previous_pivot_high * 100
These calculations quantify the magnitude of each market swing, allowing for statistical analysis of historical price movements.
🔶 Statistical Distribution Analysis
StatPivot computes comprehensive statistics on the historical distribution of drops and rises:
Average (Mean): The arithmetic mean of all recorded percentage changes
CopyavgDrop = array.avg(dropValues)
Median: The middle value when all percentage changes are arranged in order
CopymedianDrop = array.median(dropValues)
Standard Deviation: Measures the dispersion of percentage changes from the average
CopystdDevDrop = array.stdev(dropValues)
Percentiles (25th, 75th): Values below which 25% and 75% of observations fall
Copyq1 = array.get(sorted, math.floor(cnt * 0.25))
q3 = array.get(sorted, math.floor(cnt * 0.75))
VaR95: The maximum expected percentage drop with 95% confidence
Copyvar95D = array.get(sortedD, math.floor(nD * 0.95))
Coefficient of Variation (CV): Measures relative variability
CopycvD = stdDevDrop / avgDrop
These statistics provide a comprehensive view of market behavior, enabling traders to understand the typical ranges and extreme moves.
🔶 Real-time Percentile Ranking
StatPivot's most innovative feature is its real-time percentile calculation. For each current price, it calculates:
The percentage drop from the latest pivot high:
CopycurrentDropPct = (latestPivotHigh - close) / latestPivotHigh * 100
The percentage rise from the latest pivot low:
CopycurrentRisePct = (close - latestPivotLow) / latestPivotLow * 100
The percentile ranks of these values within the historical distribution:
CopyrealtimeDropRank = (count of historical drops <= currentDropPct) / total drops * 100
This calculation reveals exactly where the current price movement stands in relation to all historical movements, providing crucial context for decision-making.
🔶 Cluster Analysis
To identify the most common retracement zones, StatPivot performs a cluster analysis by dividing the range of historical drops into five equal intervals:
CopyrangeSize = maxVal - minVal
For each interval boundary:
Copyboundaries = minVal + rangeSize * i / 5
By counting the number of observations in each interval, the indicator identifies the most frequently occurring retracement zones, which often serve as significant support or resistance areas.
🔶 Expected Price Targets
Using the statistical data, StatPivot calculates expected price targets:
CopytargetBuyPrice = close * (1 - avgDrop / 100)
targetSellPrice = close * (1 + avgRise / 100)
These targets represent statistically probable price levels for potential entries and exits based on the average historical behavior of the market.
█ Trade Direction
StatPivot functions as an analytical tool rather than a direct trading signal generator, providing statistical insights that can be applied to various trading strategies. However, the data it generates can be interpreted for different trade directions:
For Long Trades:
Entry considerations: Look for price drops that reach the 70-80th percentile range in the historical distribution, suggesting a statistically significant retracement
Target setting: Use the Expected Sell price or consider the average rise percentage as a reasonable target
Risk management: Set stop losses below recent pivot lows or at a distance related to the statistical volatility (standard deviation)
For Short Trades:
Entry considerations: Look for price rises that reach the 70-80th percentile range, indicating an unusual extension
Target setting: Use the Expected Buy price or average drop percentage as a target
Risk management: Set stop losses above recent pivot highs or based on statistical measures of volatility
For Range Trading:
Use the most common drop and rise clusters to identify probable reversal zones
Trade bounces between these statistically significant levels
For Trend Following:
Confirm trend strength by analyzing consecutive higher pivot lows (uptrend) or lower pivot highs (downtrend)
Use lower percentile retracements (20-30th percentile) as entry opportunities in established trends
█ Usage
StatPivot offers multiple ways to integrate its statistical insights into your trading workflow:
Statistical Table Analysis: Review the comprehensive statistics displayed in the data table to understand the market's behavior. Pay particular attention to:
Average drop and rise percentages to set reasonable expectations
Standard deviation to gauge volatility
VaR95 for risk assessment
Real-time Percentile Monitoring: Watch the real-time percentile display to see where the current price movement stands within the historical distribution. This can help identify:
Extreme movements (90th+ percentile) that might indicate reversal opportunities
Typical retracements (40-60th percentile) that might continue further
Shallow pullbacks (10-30th percentile) that might represent continuation opportunities in trends
Support and Resistance Identification: Utilize the plotted pivot points as key support and resistance levels, especially when they align with statistically significant percentile ranges.
Target Price Setting: Use the expected buy and sell prices calculated from historical averages as initial targets for your trades.
Risk Management: Apply the statistical measurements like standard deviation and VaR95 to set appropriate stop loss levels that account for the market's historical volatility.
Pattern Recognition: Over time, learn to recognize when certain percentile levels consistently lead to reversals or continuations in your specific market, and develop personalized strategies based on these observations.
█ Default Settings
The default settings of StatPivot have been carefully calibrated to provide reliable statistical analysis across a variety of markets and timeframes, but understanding their effects allows for optimal customization:
Left Bars (30) and Right Bars (30): These parameters determine how pivot points are identified. With both set to 30 by default:
A pivot low must be the lowest point among 30 bars to its left and 30 bars to its right
A pivot high must be the highest point among 30 bars to its left and 30 bars to its right
Effect on performance: Larger values create fewer but more significant pivot points, reducing noise but potentially missing important market structures. Smaller values generate more pivot points, capturing more nuanced movements but potentially including noise.
Table Position (Top Right): Determines where the statistical data table appears on the chart.
Effect on performance: No impact on analytical performance, purely a visual preference.
Show Distribution Histogram (False): Controls whether the distribution histogram of drop percentages is displayed.
Effect on performance: Enabling this provides visual insight into the distribution of retracements but can clutter the chart.
Show Real-time Percentile (True): Toggles the display of real-time percentile rankings.
Effect on performance: A critical setting that enables the dynamic analysis of current price movements. Disabling this removes one of the key advantages of the indicator.
Real-time Percentile Display Mode (Label): Chooses between label display or indicator line for percentile rankings.
Effect on performance: Labels provide precise information at the current price point, while indicator lines show the evolution of percentile rankings over time.
Advanced Considerations for Settings Optimization:
Timeframe Adjustment: Higher timeframes generally benefit from larger Left/Right values to identify truly significant pivots, while lower timeframes may require smaller values to capture shorter-term swings.
Volatility-Based Tuning: In highly volatile markets, consider increasing the Left/Right values to filter out noise. In less volatile conditions, lower values can help identify more potential entry and exit points.
Market-Specific Optimization: Different markets (forex, stocks, commodities) display different retracement patterns. Monitor the statistics table to see if your market typically shows larger or smaller retracements than the current settings are optimized for.
Trading Style Alignment: Adjust the settings to match your trading timeframe. Day traders might prefer settings that identify shorter-term pivots (smaller Left/Right values), while swing traders benefit from more significant pivots (larger Left/Right values).
By understanding how these settings affect the analysis and customizing them to your specific market and trading style, you can maximize the effectiveness of StatPivot as a powerful statistical tool for identifying high-probability trading opportunities.

EMA Cross (data chaining template)Hello Traders! This is the source code for a simple EMA Cross indicator that can be chained to other indicators or another instance of itself as a filter.
The code is fully commented to guide you in building your own chain of indicators based on your ideas and trading plans.
All the best,
Val - Protervus Trading
Makuchaku's Trade Tools - Pivots/Fractals & CrossoversPivots/Fractals are at minimum a 3 candlestick pattern.
Bearish pivot/fractal is formed when a candle is flanked by 2 lower candles on either side
Bullish pivot/fractal is formed when a candle is flanked by 2 higher candles on either side
They are great to determine market structure.
This indicator also prints boxes when those pivots/fractals are crossed over, printing bearish & bullish boxes.

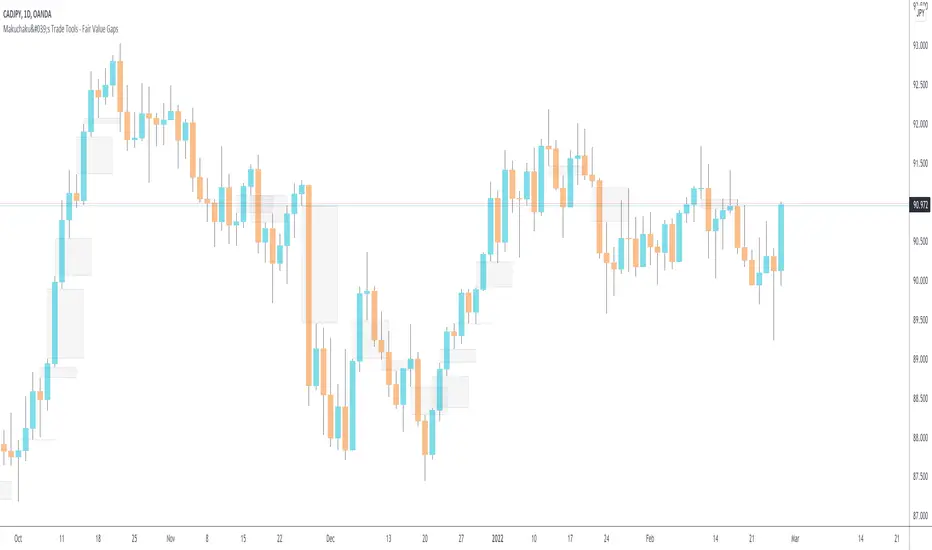
Makuchaku's Trade Tools - Fair Value GapsFair Value Gaps are a 3 candlesticks patterns, formed when the 3rd candle does not fully overlaps the 1st candle, leaving a gap in the 2nd candle.
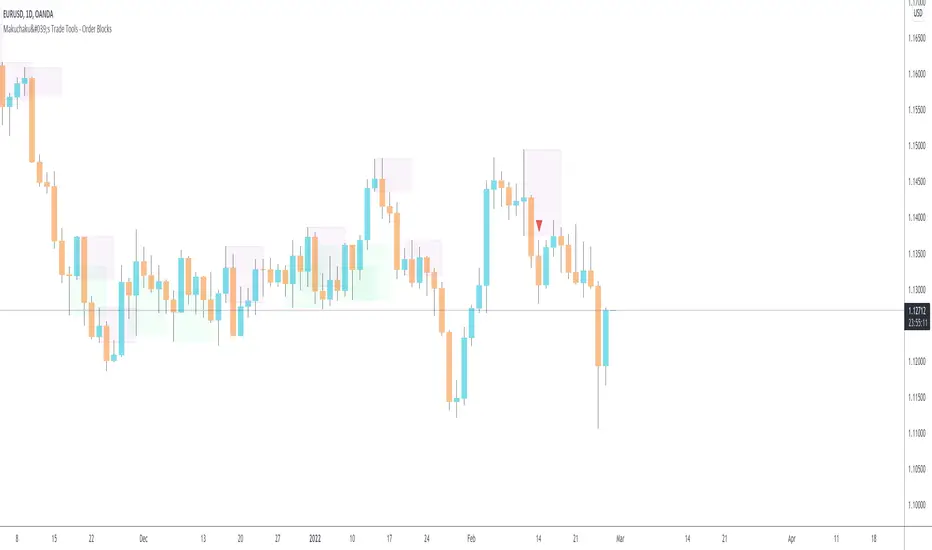
Makuchaku's Trade Tools - Order BlocksOrder blocks are a 2 candlestick pattern
Bullish order block : down candle getting engulfed by an up candle
Bearish order block : up candle getting engulfed by a down candle