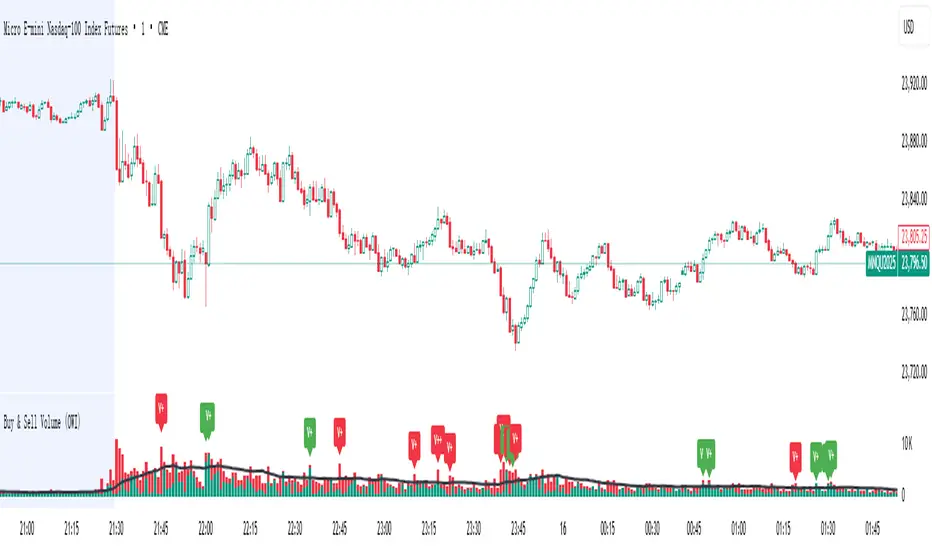
Buy & Sell Volume (OWI)📊 Buy & Sell Volume (OWI) Indicator Guide
The Buy & Sell Volume (OWI) indicator is designed to provide a visual breakdown of buying and selling pressure in each candle, helping traders identify volume surges and potential market moves. It also includes a time filter to focus analysis during key trading hours.
⚙️ Setup & Inputs
When adding the indicator to your chart, you'll see several configurable inputs:
SMA Length : Sets the period for the Simple Moving Average (SMA) of total volume.
Enable Time Filter : Toggles whether to restrict analysis to US market hours (Eastern Time). |
Start Hour/Minute : Defines the beginning of the time filter window (default: 9:45 ET). |
End Hour/Minute : Defines the end of the time filter window (default: 16:15 ET). |
📈 How It Works
🔍 Volume Breakdown
Buy Volume: Estimated volume attributed to buyers, calculated based on candle position.
Sell Volume: Estimated volume attributed to sellers.
Total Volume SMA: A moving average of total volume to benchmark current activity.
⏰ Time Filter (Optional)
When enabled, the indicator only highlights volume spikes during the specified US market hours. This helps filter out noise from pre-market or after-hours trading.
🚨 Highlight Conditions
The indicator flags significant volume spikes with labels above the volume bars:
| Label | Condition |
| V+ | Volume is between 1.5× and 2× the SMA, during market hours (if enabled). |
| V++ | Volume exceeds 2× the SMA, during market hours (if enabled). |
💡 Tips
- Use shorter SMA lengths for more reactive volume analysis.
- Change the time filter if you're trading outside US market hours.
- Combine with candlestick patttern to confirm breakout or reversal signals.
Tradingvolume
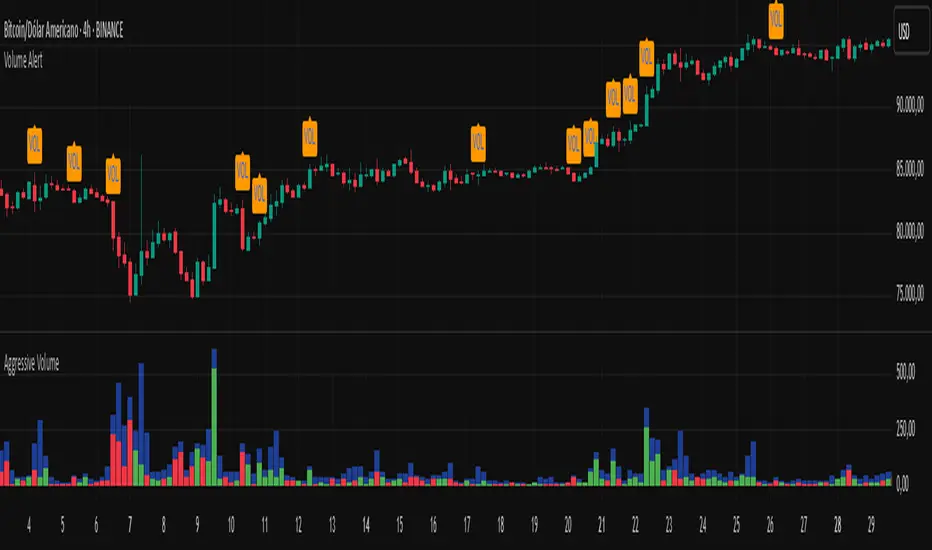
Volume AlertVolume increase alert: triggers an icon and alert when the current volume is X times greater than the previous one. The multiplier value can be adjusted as needed.
Português:
Alerta de aumento de volume: dispara um ícone e alerta quando o volume atual é X vezes maior que o anterior. O valor do multiplicador pode ser ajustado conforme sua necessidade.
WhaleTrackBITGET:BTCUSDT.P
WhaleTrack – Volume Heatmap to Uncover Institutional Trading Activity
Overview
WhaleTrack is a volume-based heatmap indicator designed to reveal areas of high institutional trading activity. The indicator helps traders identify hidden support and resistance levels, analyze trend sustainability, and optimize stop-loss placements by displaying where significant market participants (whales) have historically traded in large volumes.
Institutions and large traders often push price into areas of historical liquidity to trigger retail stop-losses and fill their own large orders at optimal prices. WhaleTrack visualizes these critical areas, allowing traders to anticipate future price movements based on past institutional behavior.
How WhaleTrack Works
WhaleTrack analyzes historical trading volume and calculates a normalized volume intensity relative to the moving average (SMA). This data is then mapped onto a heatmap that highlights key liquidity zones.
1. Volume Normalization & SMA-Based Calculation
The script calculates the ratio of current volume to its SMA-based average.
Zones with significantly high volume spikes are identified as key liquidity areas where large traders may have accumulated or distributed assets.
The volume is quantized into different levels, ranging from Low to Extreme, creating a clear heatmap gradient.
2. Why Do Whales Manipulate Liquidity?
Large traders (whales) need liquidity to execute their orders.
They push price into historical high-volume areas to trigger stop-losses and force retail traders into selling.
This behavior allows them to accumulate at lower prices or distribute at higher prices before a major move.
Whale zones often act as support/resistance because institutions tend to protect their previous accumulation or distribution levels.
3. Heatmap Color Model & Zone Classification
WhaleTrack assigns volume intensity levels based on historical market participation:
Low → Minimal volume, weak interest
Low-Mid → Slightly increased volume
Mid → Standard trading activity, no major anomalies
Mid-High → Significant increase in volume, possible whale activity
High → Strong liquidity pool, institutional interest
Extreme → Highly concentrated volume, key reversal area
By observing these zones, traders can determine whether a price level is likely to hold as support or resistance , or if a breakout has the strength to sustain.
Trading Applications of WhaleTrack
WhaleTrack can be used to identify trade setups based on liquidity behavior:
1. Identifying Hidden Reversal Points (Support & Resistance)
Large Whale Zones below price → Likely strong support.
Large Whale Zones above price → Likely strong resistance.
These zones often lead to reversals, as large traders defend their previous positions.
2. Evaluating Trend Sustainability
A strong uptrend should leave multiple high-volume zones behind.
If no new high-volume zones form, the trend may be unsustainable.
High volume clusters in trend direction? → Likely trend continuation.
3. Optimizing Stop-Loss Placement
Placing stops inside whale zones increases stop-out risk.
Setting stops below whale buy zones protects against premature liquidation.
Stops above whale sell zones help avoid fake breakouts.
Customization & Settings
WhaleTrack is designed with flexibility in mind, offering multiple customization options:
1. Layout & Color Models
WhaleTrack Default – optimized for whale volume tracking
Model 1 & Model 2 – alternative heatmap color schemes
Contrast Mode – high visibility
White-Black & Black-White – for different chart backgrounds
Custom 1 & Custom 2 – user-defined color configurations
2. Advanced Options
Draw Full Candle Boxes – display full candle height or a partial range
Legend Visibility & Positioning – control placement of the heatmap legend
Exponential Color Model – choose between logarithmic and linear volume representation
Max Transparency Settings – adjust visibility of older zones
Number of Heatmap Colors – set the gradient sensitivity
3. Data Optimization Settings
Lookback Period – define how many bars are analyzed for volume normalization
Max Box Display – limit the number of displayed volume zones
Data Saver Mode – increase range at the expense of detail
Minimum Volume Threshold – filter out insignificant volume clusters
Disclaimer
This indicator is for educational and informational purposes only. It does not provide financial advice or guarantee future performance. Trading is risky—conduct your own research before making any investment decisions.

[AlbaTherium] Volume Venturius Premium Volume Venturius Premium
Introduction
The Volume Venturius Premium is an advanced market analysis tool designed to deeply investigate the behavior of active market participants. By focusing exclusively on executed market orders, Volume Venturius offers traders a unique perspective on buy and sell volumes. Unlike traditional order books that track passive orders, this indicator isolates active orders, shedding light on real market dynamics.
Chapter 1: Understanding Market Participants
1.1 Categories of Market Participants
Market participants can be classified into several categories based on their:
Size : The volume of trades executed.
Influence : Their ability to initiate bull or bear campaigns.
Strategy : The trading methods employed, such as scalping, swing trading, or high-frequency trading.
Objectives : Whether their focus is on speculation, hedging, or arbitrage.
Time Horizon : Short-term versus long-term goals.
Behavioral Patterns : Their reaction to liquidity levels or price movements.
1.2 Objectives of Market Participants
Each category pursues specific objectives, such as profit-making or risk management. Regulatory reports like the Commitment of Traders (COT) provide weekly insights into the positions and intentions of major players.
Chapter 2: The Philosophy of Volume Analysis
2.1 Active Orders vs. Passive Orders
Unlike passive orders waiting to be filled at specific prices, active orders directly impact market prices. By focusing on these executed orders, Volume Venturius Premium provides traders with actionable insights into market trends and momentum.
2.2 Wyckoff’s Market Dynamics
According to Wyckoff, markets operate in two primary phases:
Manipulation: Where large participants accumulate or distribute positions to prepare for a move.
Expansion: The phase where price trends begin to unfold, either in a bullish or bearish direction.
Wyckoff’s theory emphasizes understanding how major players manipulate the market to identify accumulation or distribution zones. Volume Venturius Premium aids in pinpointing these manipulative actions by analyzing volume and order flow data.
Chapter 3: The Secrets of Order Flow and Volume
3.1 Unveiling Market Control
By studying the positioning and execution volumes of large players, traders can discern who holds control in the market. Volume Venturius Premium identifies the balance of power and tracks shifts that signal potential trend reversals.
3.2 Behavioral Patterns in Volume
Key metrics tracked by Volume Venturius Premium include:
Volume Clusters : Areas of concentrated buying or selling activity.
Directional Bias : Whether market participants are net buyers or sellers.
Momentum Shifts : Changes in execution speed and volume that may precede major moves.
3.2.1 Volume Clusters, Directional Bias and Directional Bias: Areas of Concentrated Buying or Selling Activity
Volume clusters play a crucial role in understanding market dynamics by highlighting areas where aggressive buying or selling activity is most concentrated. These clusters often serve as key decision zones, providing insights into potential reversals, breakouts, or continuations. To better visualize and interpret these zones, a distinct color-coding system has been implemented. Each color represents a specific market condition or level of activity, allowing for a more intuitive analysis of volume behavior and its influence on price movement.
Below is a detailed explanation of the color logic used to represent these clusters and their significance within the trading framework.
Color Interpretation and Meaning :
Extra Extreme Zones
These zones highlight areas where clusters of aggressive buyers or sellers are most heavily concentrated. They represent critical levels for identifying potential reversals or strong continuations.
Bright Red (#ff003c) : Represents extra-extreme sell zones, where aggressive sellers dominate.
Meaning: Indicates extreme selling pressure, often signaling potential exhaustion of sellers.
Bright Blue (#001eff) : Represents extra-extreme buy zones, where aggressive buyers are most active.
Meaning: Shows extreme buying pressure, possibly marking a saturation point for buyers.
Main Zones
These zones help identify key levels based on volume activity and well-defined clusters.
Dark Red (#d60033) : Represents strong selling pressure.
Orange (#ff8000) : Indicates significant selling pressure that begins to fade.
Yellow (#ffff00) : Represents moderate selling pressure, signaling a potential slowdown.
White (#ffffff) : Marks transition zones, which are interesting entry points for potential reversals or continuations.
Transition Zones (Frontier Zones)
These zones indicate intermediate movements and potential shifts in momentum.
Transparent Black (#000000, 50) : Represents transition areas, where the market tests boundaries between buyers and sellers.
Meaning: These are critical decision points.
Neutral Zone (Sea Zone)- Trend Zones
These zones represent more balanced market activity, where neither buyers nor sellers dominate clearly.
Transparent Green (#00e040, 25) : Indicates slight bullish activity in a neutral zone.
Transparent Red (#e01a00, 25) : Indicates slight bearish activity in a neutral zone.
This color logic allows you to pinpoint areas where volume clusters show a clear dominance, exhaustion, or optimal entry opportunities.
3.3 Divergences Between Price and Volume
Divergences between price and volume are critical for identifying key shifts in market sentiment. Volume Venturius Premium distinguishes two main types of divergences: Lack of Participation and Absorption, each offering valuable signals for potential reversals or continuations.
Lack of Participation
This divergence occurs when price movements are not supported by corresponding volume dynamics, signaling a reduction in activity from significant market participants.
1. Bullish Lack of Participation:
Characteristics : Price is making lower lows, but volume is making higher lows.
This indicates waning selling pressure as prices drop.
Inference : A potential bullish reversal may occur. Traders could consider looking for opportunities to go long.
2.Bearish Lack of Participation:
Characteristics : Price is making higher highs, but volume is making lower highs. This suggests diminishing buying pressure even as prices rise.
Inference : A potential bearish reversal might follow. Traders might position to go short.
Absorption
Absorption occurs when larger market participants neutralize the pressure from smaller participants, often leading to significant market moves.
1.Bullish Absorption:
Characteristics : Price is making higher bottoms, but volume is making lower bottoms.
This reflects sellers being trapped as their selling efforts are absorbed by larger buyers.
Inference : A potential upward breakout is likely. Traders may look for opportunities to go long.
2.Bearish Absorption:
Characteristics : Price is making lower tops, but volume is making higher tops. This indicates buyers being trapped as larger sellers absorb their buying activity.
Inference : A downward breakout is probable. Traders may consider positioning to go short.
Chapter 4: Practical Application and Trading Strategies
4.1 Leveraging Active Order Insights
Learn how to use Volume Venturius Premium to detect hidden accumulation or distribution phases. Strategies include identifying spikes in active volume that signal institutional participation.
4.2 Confirming Bull and Bear Campaigns
Gain confidence in detecting the early stages of bullish or bearish campaigns by analyzing the interplay between active orders and volume flow.
Chapter 5: Real-World Examples
5.1 Analyzing Market Manipulation
See how Volume Venturius Premium can reveal manipulation tactics employed by large players to trigger liquidity events.
5.2 Spotting Trends with Active Orders
Real-life scenarios demonstrate how the tool can be used to identify and ride the market’s dominant trend.
Conclusion
The Volume Venturius Premium is an indispensable tool for traders who seek to understand the underlying mechanics of market movement. By focusing on active order flows and drawing on Wyckoff’s principles, it provides unique insights into market manipulation and expansion phases. Whether you’re an intraday trader or a long-term strategist, this tool empowers you to anticipate market shifts and trade with confidence.
Stay tuned for updates as we continue to refine Volume Venturius Premium to further enhance your trading journey.
