Precision Trendlines - Relevant Current TFPrecision Structural Trendlines (Current TF)
Overview
The Precision Structural Trendlines indicator is a high-performance price action tool designed for traders who rely on market structure and trend convergence. Unlike standard trendline scripts that clutter the chart with every possible connection, this indicator strictly follows professional structural rules—connecting Lower Highs for resistance and Higher Lows for support.
Key Features
Structural Integrity: The engine ensures that resistance lines are only drawn during bearish sequences (Lower Highs) and support lines during bullish sequences (Higher Lows), aligning with core Price Action principles.
Dynamic Relevance Filter: Solve the "web of lines" problem. By default, the script only shows trendlines that are currently relevant to price. As price moves away from old trends, they fade out, keeping your workspace clean.
Zero Drift Synchronization: Built using absolute time-anchoring (xloc.bar_time), ensuring that trendlines stay perfectly "glued" to the candle wicks regardless of how much you scroll or zoom.
Customizable Aesthetics: Choose between Random Dark Colors to easily distinguish overlapping trends or a Static Color for a unified look. Global width controls allow for instant visibility adjustments.
How to Use
Trend Confirmation: Use the Minimum Points setting. Set it to 2 for aggressive, early trend detection, or 3 to only see lines that have been validated by multiple touches.
Major vs. Minor Swings: Adjust the Pivot Strength. A value of 30 (default) captures significant intraday turns, while 20+ is ideal for identifying major swing structure.
Relevance Buffer: Tune the Price Buffer % to determine how close price must be to a historical trendline before it reappears on your chart.
Settings Breakdown
Minimum Points: Number of pivot points required to anchor a line.
Pivot Strength: The "look-left/look-right" requirement to confirm a peak or valley.
Validation Tolerance: The vertical buffer allowed for a 3rd point to "hit" the trendline.
Show Relevant Only: Toggles the visibility filter (highly recommended for high-volume traders).
Trandanalysis

Scalp Boost LONG✦ Overview
Scalp Boost LONG is a visual tool designed to highlight potential short-term upward impulses.
A signal is generated only when multiple market conditions align at the candle close, combining momentum dynamics, local probability shifts, and abnormal volume behavior.
The indicator does not repaint.
✦ Concept
The tool focuses on selective situations where the market shows signs of micro-breakout potential.
If all internal conditions are confirmed — a LONG event is displayed.
If not — the chart remains clean.
This builds a low-noise signal model, prioritizing quality over frequency.
✦ Signal Logic
The LONG signal requires confirmation of all core conditions:
• Local impulse dynamics
Identifies short-term acceleration suggesting a breakout from a compressed price structure.
• Probability beyond a statistical zone
Uses relative breakout probability instead of fixed levels, checking whether price exceeds expected local ranges.
• Abnormal volume activity
Highlights candles with monetary flow above a custom threshold, signaling increased market interest.
• Anti-overheat filter
Conditions avoiding exhausted or low-momentum phases where continuation is less likely.
Only when all filters are aligned a LONG marker appears.
✦ Visual Structure
The chart display is intentionally minimal:
• ROC Curve
Subdued line, showing short-term momentum without distraction.
• LONG Marker
Green triangle below the candle on confirmed events.
• Candle Highlight
Soft background highlight on the signal bar.
• Volume Marker
Small red dot at the bottom of candles with abnormal monetary flow.
All visual elements appear only on candle close.
✦ Alerts
A clean event structure is available for notifications:
LONG Signal
This allows receiving alerts during chart analysis or in automated workflows while keeping full control over decision-making.
✦ Notes & Guidelines
This tool:
is not a trading system,
does not provide targets or stops,
may trigger against the dominant trend,
should be combined with the user’s own methodology.
Signals are rare by design.
Do not interpret each event as a trend continuation — it highlights conditions, not outcomes.
✦ Suggested Use
-(Non-mandatory ideas for advanced users)
-identifying potential micro-breakouts,
-timing entries around volume spikes,
-adding context to scalping models,
-filtering impulsive moves from noise.
-suitable for a 5-minute timeframe
The indicator can be helpful as a confirmation layer, not a standalone decision tool.

Swing Trades Validator - The One TraderThis swing trading strategy validator is built on the original strategy taught in my bootcamp for swing traders.
The strategy is simple and follows a trend trading pattern on prices reacting to Exponential Moving Averages over a multiple time-frame analysis.
The details of the strategy are as follows:
- Holding Period : Upto a couple of months
- Time-frames to be analysed : Month - Week - Day
- Trade Execution : Daily Time-frame
Analysis Details:
Step 1 : On the Monthly time-frame, the candle needs to be bullish with the latest close being higher than the opening price of the month.
Step 2 : The price needs to be above the 8ema on the Monthly time-frame.
Step 3 : The 8ema must be above the 20ema on the Monthly time-frame.
The above steps indicate a bullish strength in the instrument on the Monthly time-frame.
Step 4 : On the Weekly time-frame, the candle needs to be bullish with the latest close being higher than the opening price of the week.
Step 5 : The price needs to be above the 8ema on the Weekly time-frame.
Step 6 : The 8ema must be above the 20ema on the Weekly time-frame.
The above steps indicate a bullish strength in the instrument on the Weekly time-frame.
Step 7 : On the Daily time-frame, the candle needs to be bullish with the latest close being higher than the opening price of the day.
Step 8 : The price needs to be above the 8ema on the Daily time-frame.
Step 9 : The 8ema must be above the 20ema on the Daily time-frame.
The above steps indicate a bullish strength in the instrument on the Daily time-frame.
Step 10 : While the 8ema is above the 20ema on the Daily time-frame, the price must be allowed to rise before a pullback is seen towards the moving averages, indicating a bearish move trying to change the trend.
Step 11 : These pullback candles need to form a pattern called the Ring Low with the second pullback candle having a lower high and lower low and the low of the last pullback candle being lesser than or equal to the fat ema on the Daily time-frame.
Step 12 : If the stock is still bullish and the trend is displaying a strength in the underlying bullish direction, then there will be a resumption candle that will have a closing price higher than the previous day's high price.
This trend continuation signal is a confirmation that the instrument will continue in the underlying trend direction and we will be able to enter if this condition is satisfied.
The profit and loss percentages are set at a default 10% as this can be a minimum risk : reward for swing trades on average, but the inputs have been made available to the users in order to adjust the risk : reward to find the most optimum breathing room for each individual stock or instrument. This will give the user a highly custom overview of the strategy on individual instruments based on their volatility and price movements.
The strategy tester will auto back-test this strategy historically and find all the trades that were taken based on this strategy and populate a performance summary.
The most important data in V1.0 of this script are as follows:
1. No. of Trades Taken : We want to see many trades being taken on this strategy in that particular instrument. This shows us a healthy report on the number of winning vs. losing trades.
2. Percentage Profitable : We want to see that this strategy has worked out in the past and is giving us a high probability of return. This in no way an indication that the strategy will definitely work out in the future as well, but gives us an idea of whether or not we should enter this trade.
3. No. of Winning Trades vs. Losing Trades : We would like to see a significantly higher number of winning trades.
4. Avg. # of bars in a trade : This gives us an idea of how long on average we might have to wait to see the results of this strategy either in favor of our reward or against our desired direction. Some trades can be completed in around 15-20 bars on average and some trades have shown to take upto 45 days to reach desired reward. This is in line with our planned holding period, but gives the trader a sense of time and increased level of patience.
The future updates will have more utility of the various elements of the strategy tester and the entire exit strategy will be integrated into the script.
This script is not to be used as a standalone method and must be studied well in order to execute trades. I have not hidden visibility on other time-frames, but since order execution is done on the Daily time-frame, the script must run on the Daily time-frame only.
There are many other factors to be taken into consideration before entering a trade and proper risk management and position sizing rules must be followed.
Our bootcamp participants will use this strategy tester in conjunction with the invite-only Trading Toolkit assigned to them.
The development of this script will be ongoing and all comments and feedback are welcome.

Better Trader Super PredictThis is a free trading assistant that combines 4 types of trading signals and useful tools.
Four types of trading signals:
1. Trending signals. KAMA and Awesome oscillator(5,34) and (3,25) are used to confirm trend.
2. Knifes. This is a SOT detector with volume and spread filtering. The algorythm takes into account the volatility.
3. Predict. The distance from VWAP and BB stdev 2 and 3 is used. Signals usually appear when RSI/MACD/AO divergence is detected.
4. High risk signals. These are SOT and high volume signals without hard filtering.
All signals use distance from SMMA and volatility.
Filters use LL and HH events.
Each signals has entry zone, recommended stop-loss and a number of take-profits.
Recommended entry points and usually located in the body of higher timeframe candles.
Recommended stop-loss zones are using ATR(10) with multiplier that depends on the timeframe.
Take-profit points and arranged within daily and week levels using pivots and VWAP.
The useful tools are:
- Autofibo
- Ichimoku clouds
- VWAP
Disclaimer:
Your trading is fully your responsibility.
Sell and Buy markers are not a financial advice.
Do not take too much risk.
Almost all signals are NOT repainted. There some rare trend signals that can be repainted.

Aqua Flow ChartAqua Flow Chart by Angel Algo
Aqua flow chart (AFC) is a new chart type that not only displays price in an efficient way but also performs statistical analysis of price moves. It filters out noise and shows buy and sell signals.
Signals generated by AFC often are leading ones. This means they allow to forecast future movement of the price before it begins.
How does it work?
AFC does not show open and close for each bar, it only shows the price range of the bar i.e. its diapason between the high and the low. The reason is, that most types of orders including SL and TP are being executed on price touch. So, in terms of triggering orders the price range of the bar is the only thing that matters.
For each bar AFC measures the price move within this bar (current close minus previous close) and compares it to the mean price movement within one bar for this time frame. If it is significantly higher than the mean movement and exceeds it by a certain number of standard deviations specified in the Threshold parameter, then the range of this bar is being colored as red or green, depending on the direction of the price movement in this bar. If the movement of the price is less than the threshold value the bar’s range is colored in blue.
Financial analysts call bars in which the price movement is higher than the mean price movement for this time frame by N standard deviations N-sigma moves. You can see 1-2-sigma moves quite often. More than 5-sigma moves are extremely rare and correspond to market shocks caused by some unexpected news and events.
In terms of this financial jargon you can think of Threshold parameter of AFC as of number of sigma that a price move of a bar should exceed for this bar to be colored in green or red.
Higher sigma moves in most cases carry some information cause they statistically can not be described by a some sort of market noise. There are evidences that if a high sigma move occurs it may be a leading predictor for the future trend.
If you set Threshold parameter to be equal or more than 1.5 then you can consider the red and green colored bars to be buy and sell signals. The greater value you set for the Threshold parameter the stronger will these signals be, but at the same time they will occur more rarely.
The default value for the Threshold parameter is 1.5 which works good for many markets. You can adjust the value of this parameter to find the optimal sensitivity for the signals. You can set the values from the range 1-7. The less the value is the more colored bars you get, but the less strong are the signals given by these bars.
Please drop a comment if you have any questions and a like if you find this useful!

Dual EMA Cloud 1MIN Trading SystemDual EMA Cloud 1MIN Trading System + EMA 200 + VWAP
The Script Show Dual EMA With Color Line And Cloud And Change Color And EMA 200 And VWAP Line Color.
█ FEATURES
Study Is Based In Exponential Moving Average And EMA 200 And VWAP.
1) EMA 72 And EMA 89.
2) 1 Minute Timeframe.
3) Exponential Moving Average 72.
4) Exponential Moving Average 89.
5) Exponential Moving Average 200.
6) VWAP Line Candle Above VWAP Line Color Change To Green.
7) VWAP Line Candle Above VWAP Line Color Change To Red.
8) Color Line.
9) Color Cloud.
10) Alert.
█ HOW TO USE THE STUDY
((Up Trend))
A.1) Green Cloud Mean Up Trend Signal.
A.2) Candle Above EMA Cloud Buy Signal .
A.3) Blue Line Mean EMA 200.
((Down Trend))
B.1) Red Cloud Mean Down Trend Signal.
B.2) Candle Blow EMA Cloud Buy Signal.
B.3) Blue Line Mean EMA 200.
█ Access To Script Add It To Your Chart For Free.
█ For Script Source Code Contact me
█ I Used This Script For Measure Exponential Moving Average EMA For Short And Long

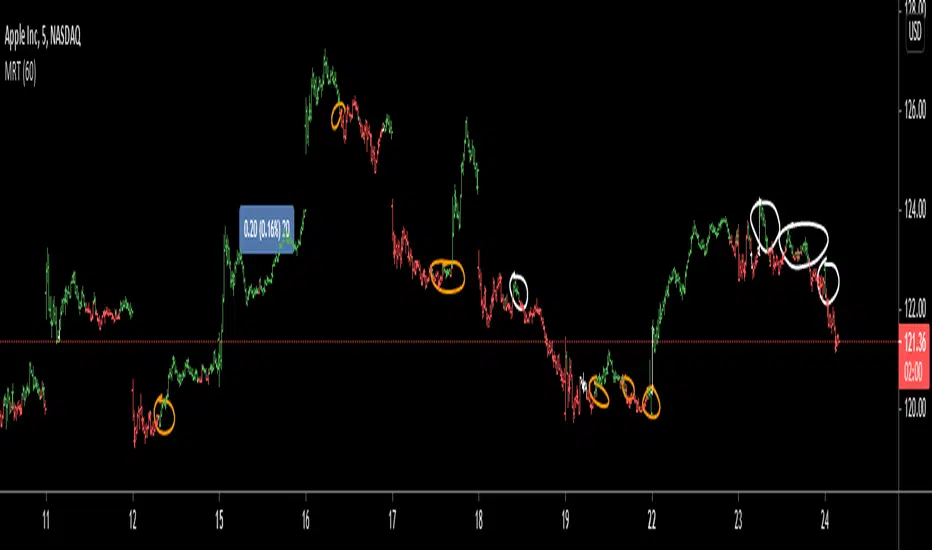
MRT, Barcolor for Trend Direction This is an indicator that I use to identify trend.
1- This is $AAPL five minutes chart
A-Yellow Circles on the chart: Green is a Buy ,Red is a Sell
B-The white bars are transition to to the opposite color (red to green or vic versa ) it can serve as a warning of trend change.
C-As with any signal , sometimes it is a false signal (the white circles you see there). However, I would stick to the signal each time it changes.
2-The indicator uses previous highs and lows based on different time frames that you select. and calculate the winners and losers.
3-
A-I personally choose shorter time frame ( Hour, 30 minutes, even 1 minute) because I want faster signals to trade short term.
B-However, you can use it for longer term if you trade on longer time frames.
c-Whatever timeframe you use , choose lower for the candle; For example, if you use the One-Hour for the indicator then apply it to the five minutes chart. I use the 30 seconds chart.
4-This indicator will not guarantee any returns.
comment if you have any question.
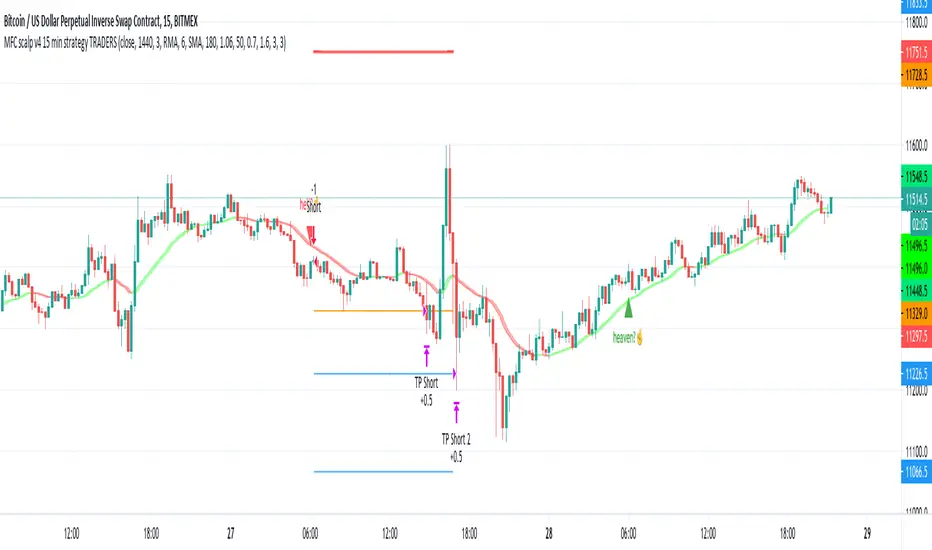
MFC scalp v4 15 min strategy TRADERSthis indicator to trade for a short time in a TF of 15 minutes.
We have created takeprofit zones for you so that you can understand where we can get to and take your profit. these points are mostly very helpful.
There are basic settings that allow you to adjust the indicator individually for each situation; because of this, this indicator can be used for any exchange and any currency pair.
For Scalp trading, we use 4 different strategies available to our clients. If you enter them correctly, you can never see the minus sign.
Use the link below to obtain access to this indicator.
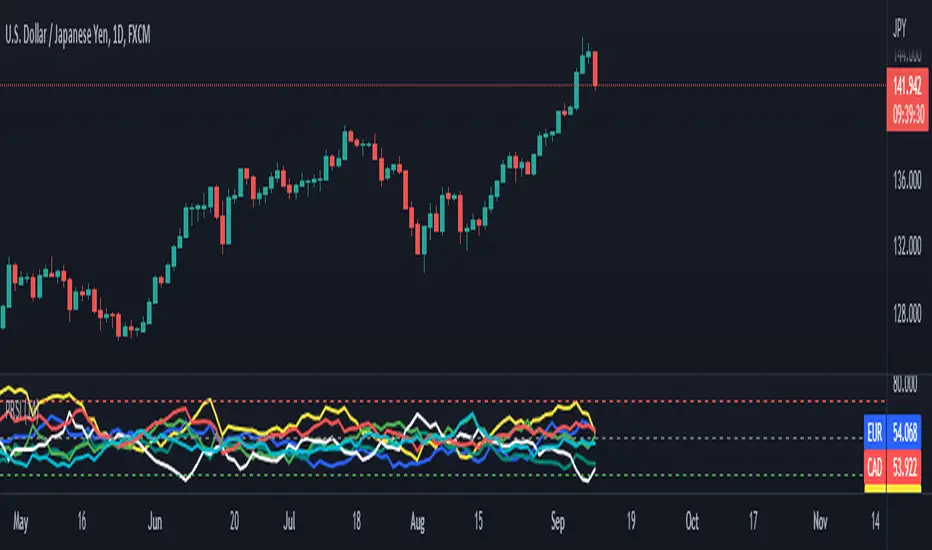
pooya AVG RSIThis is an RSI range for the most popular index in FOREX:
EUR
USD
GBP
JPY
AUD
CAD
CHF
NZD
comment your opinion