Improved G-Trend DetectionIt is the Improved version of G trend channel detection.
The Umair Trend Detection Indicator is a powerful tool designed to help traders identify potential buy and sell opportunities by combining dynamic price channels with RSI-based confirmation. This indicator is suitable for all types of financial markets, including stocks, forex, and cryptocurrencies.
Key Features:
Dynamic G-Channels
Calculates upper, lower, and average price channels based on the "G-Channel" methodology.
Helps identify market extremes and potential reversal points.
RSI Confirmation
Integrates RSI (Relative Strength Index) to filter buy and sell signals.
Avoids false signals by ensuring market momentum aligns with trend direction.
Buy/Sell Signals
Generates "Buy" signals when bullish conditions align with oversold RSI levels.
Generates "Sell" signals when bearish conditions align with overbought RSI levels.
Exit Signals
Provides optional exit points for both long and short positions using a buffer for confirmation.
Visual Clarity
Displays clearly plotted channels and average lines to help visualize price trends.
Buy and sell signals are marked with arrows for easy identification on the chart.
Custom Alerts
Offers customizable alerts for buy, sell, and exit conditions, ensuring traders never miss an opportunity.
Input Parameters:
Channel Length: Controls the sensitivity of the G-Channels.
Multiplier: Adjusts the width of the channels to suit different market conditions.
RSI Settings: Customize RSI length and thresholds for overbought/oversold conditions.
Exit Signal Buffer: Adds flexibility to the exit strategy by delaying signals for confirmation.
How It Helps:
The Umair Trend Detection Indicator is perfect for traders looking for an easy-to-use trend-following system with strong confirmation. By combining dynamic channels with RSI, it provides accurate and reliable signals to enter and exit trades, minimizing risks associated with false breakouts or trend reversals.
Use Cases:
Trend Trading: Identify and follow long-term trends with confidence.
Swing Trading: Spot reversals and capitalize on medium-term price movements.
Risk Management: Use exit signals to lock in profits or limit losses effectively.
This indicator is a versatile tool for both novice and experienced traders. Fine-tune its settings to align with your trading style and improve your decision-making in any market.
Trend-detection

LordPepe Stochastic SignalsThis is the Lord Pepe. Howdy. Basic buy/sell indicator to accumulate along a downtrend and release your stack during the uptrend and oversold levels of the stochastic. The buys should be used to stack, and sells indicate levels of profit taking, they do not signal a long term reversal, only < 25% of stack should be released on "OB" signals.
OB - overbought (sell)
OS - oversold (buy)
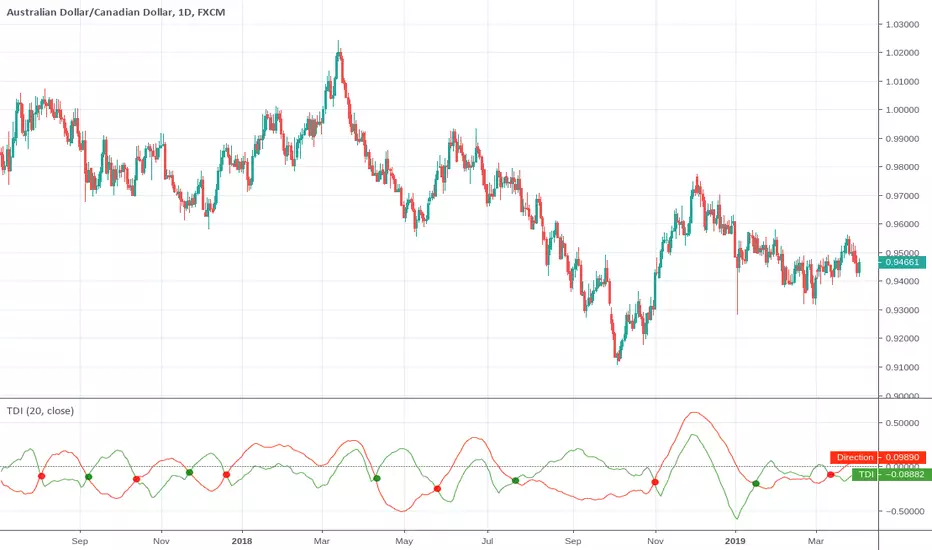
Trend Detection IndexTrend Detection Index indicator script.
This indicator was originally developed by M.H. Pee (Stocks & Commodities V. 19:10 (54-61): Trend Detection Index).
FREE INDICATOR: POLARIZED FRACTAL EFFICIENCYLooking for something other than a moving average to help determine not only a trend's strength, but also it's direction? Try PFE!
PFE was developed by Hans Hannula that was invented to determine price efficiency over a user-defined time period.
The Polarized Fractal Efficiency indicator is, in the essence, an exponentially smoothed ratio of the length of two lines: (1) of a straight line between today’s close and the close Period days ago, and (2) of a broken line connecting all Close points between today and Period days ago. The indicator output varies between -100 and 100. The theory behind this indicator is that if it is >50 (or <-50) then the market is likely to reverse its trend from positive to negative (or from negative to positive).
Other usage:
Securities with a PFE greater than zero are deemed to be trending up, while a reading of less than zero indicates the trend is down. The strengh of the trend is measured by the position of the PFE relative to the zero line. As a general rule, the further the PFE value is away from zero, the stronger and more efficient the given trend is. A PFE value that fluctuates around the zero line could indicate that the supply and demand for the security are in balance and price may trade sideways.
As with all indicators, finding something that works well along side this would be the most beneficial way to use it.
Perhaps something like the Choppiness Index (related idea below) could do the trick.
Grab the source code here: pastebin.com
Installation video by @ChrisMoody here : blog.tradingview.com
