Balance of Power Heikin Ashi Investing Strategy Balance of Power Heikin Ashi Investing Strategy
This is a swing strategy designed for investment help.
Its made around the Balace of Power indicator, but has been adapted on using the Monthly Heikin Ashi candle from the SPY asset in order to be used with correlation for US Stock/ETF/Index Markets.
The BOP acts as an oscilallator showing the power of a bull trend when its positive and a bearish trend when its in negative. At the same time we can spot reversals, based on the percentiles ( 99/1)
The rules for entry :
For long : The 99 percentile is ascending, and we are either in a positive value (>0), or we crossed the bottom place ( -0.35)
For short : the 99 and 1 percentile are descending, and we are either in a negative value(<0), or we crossed down the top place ( 0.6)
If you have any questions please let me know !
Analisi trend

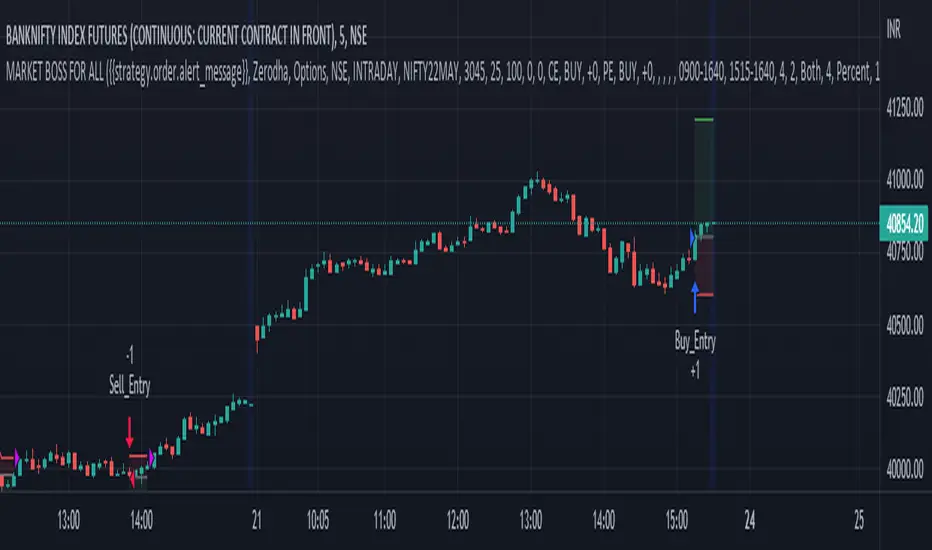
MARKET BOSS FOR ALLTHIS STRATEGY USE FOR ANY TYPE OF MARKET INDIAN,COMMODITY,FOREX ,CRYPTO...This strategy used to determine and anticipate potential changes in market price and reversals. The Highs referred to in the title are created based on the number of bars that exhibit lower highs on either side of a High, whereas the Lows are created based on the number of bars that exhibit higher lows on either side Low.it also analyzing price changes and reversals, a trader has more of an ability to determine and predict price patterns and general price trends...
The backtest results are based on BANKNIFTY last year's data. It has an initial capital of 10000 and the size of the lot is 1. The commission paid is 50 RS cash per trade and the slippage is 5 ticks per trade. Some of the Indian broker's commission is only 10 cash per trade. Adjust the commission as per your broker. Trades are conducted based on the intraday time in India set from 9.20 am to 3:20 pm. All positions will get square off at 3.20 pm. All other parameters are suitable for Robo trading with Indian stock brokers.
Also added Quantity feature it automatically double the quantity on losing trade
reasons why to use strategy
1) human psychology never focus on one thing... We never follow one strategy for long time... Bcs we hve greed... If some one says indicator give u 95% than we chnge our strategy which on we r working but indicator didn't give u back testing... Our strategy gives back testing... On 5 min chart of banknifty future... Tv on premium membership give one year back testing... And on crypto it gives 2month backtesing on 5min chart
2) we hve sufficient back testing trades... On 1year back testing minimum 700 trade should be done for back testing bcs thn we know how our strategy work on all market conditions.... For crypto in 2 month back testing more thn 300 trade needed to know it's performance... Our strategy produce suffiend trades... So we know how it works on all market conditions
3) we provide banknifty strategy for intraday... So it's open trade after 9 20 and close all position on 15: 20...so it's backtesing is sure shot perfect
4) for banknifty option strategy... We have made it to book profit or loss in 5 to 15 min... So no time factor effect... So vry profitable for option buyers
5) for banknifty option we had made it fully auto it's automatically buy at auto strike price.. So no tension to select strike price
6) u can also choose weekly or monthly expirey
7) we hve provided table for monthly proprofits... So we know how it's work on every month
8) last but not least...key of 🔑Sucess in stock market and crypto is following the right path for long time... With non biased strategy with positive backtesting result... And all the best
Coral Trend Pullback Strategy (TradeIQ)Description:
Strategy is taken from the TradeIQ YouTube video called "I Finally Found 80% Win Rate Trading Strategy For Crypto".
Check out the full video for further details/clarification on strategy entry/exit conditions.
The default settings are exactly as TradeIQ described in his video.
However I found some better results by some tweaking settings, increasing R:R ratio and by turning off confirmation indicators.
This would suggest that perhaps the current confirmation indicators are not the best options. I'm happy to try add some other optional confirmation indicators if they look to be more effective.
Recommended timeframe: 1H
Strategy incorporates the following features:
Risk management:
Configurable X% loss per stop loss
Configurable R:R ratio
Trade entry:
Based on strategy conditions below
Trade exit:
Based on strategy conditions below
Backtesting:
Configurable backtesting range by date
Trade drawings:
Each entry condition indicator can be turned on and off
TP/SL boxes drawn for all trades. Can be turned on and off
Trade exit information labels. Can be turned on and off
NOTE: Trade drawings will only be applicable when using overlay strategies
Alerting:
Alerts on LONG and SHORT trade entries
Debugging:
Includes section with useful debugging techniques
Strategy conditions
Trade entry:
LONG
C1: Coral Trend is bullish
C2: At least 1 candle where low is above Coral Trend since last cross above Coral Trend
C3: Pullback happens and price closes below Coral Trend
C4: Coral Trend colour remains bullish for duration of pullback
C5: After valid pullback, price then closes above Coral Trend
C6: Optional confirmation indicators (choose either C6.1 or C6.2 or NONE):
C6.1: ADX and DI (Single indicator)
C6.1.1: Green line is above red line
C6.1.2: Blue line > 20
C6.1.3: Blue trending up over last 1 candle
C6.2: Absolute Strengeh Histogram + HawkEye Volume Indicator (Two indicators combined)
C6.2.1: Absolute Strengeh Histogram colour is blue
C6.2.2: HawkEye Volume Indicator colour is green
SHORT
C1: Coral Trend is bearish
C2: At least 1 candle where high is below Coral Trend since last cross below Coral Trend
C3: Pullback happens and price closes above Coral Trend
C4: Coral Trend colour remains bearish for duration of pullback
C5: After valid pullback, price then closes below Coral Trend
C6: Optional confirmation indicators (choose either C6.1 or C6.2 or NONE):
C6.1: ADX and DI (Single indicator)
C6.1.1: Red line is above green line
C6.1.2: Blue line > 20
C6.1.3: Blue trending up over last 1 candle
C6.2: Absolute Strengeh Histogram + HawkEye Volume Indicator (Two indicators combined)
C6.2.1: Absolute Strengeh Histogram colour is red
C6.2.2: HawkEye Volume Indicator colour is red
NOTE: All the optional confirmation indicators cannot be overlayed with Coral Trend so feel free to add each separately to the chart for visual purposes
Trade exit:
Stop Loss: Calculated by recent swing low over previous X candles (configurable with "Local High/Low Lookback")
Take Profit: Calculated from R:R multiplier * Stop Loss size
Credits
Strategy origin: TradeIQ's YouTube video called "I Finally Found 80% Win Rate Trading Strategy For Crypto"
It combines the following indicators for trade entry conditions:
Coral Trend Indicator by @LazyBear (Main indicator)
Absolute Strength Histogram | jh by @jiehonglim (Optional confirmation indicator)
Indicator: HawkEye Volume Indicator by @LazyBear (Optional confirmation indicator)
ADX and DI by @BeikabuOyaji (Optional confirmation indicator)

SUPPORT RESISTANCE STRATEGY [5MIN TF]A SUPPORT RESISTANCE BREAKOUT STRATEGY for 5 minute Time-Frame , that has the time condition for Indian Markets
The Timing can be changed to fit other markets, scroll down to "TIME CONDITION" to know more.
The commission is also included in the strategy .
The basic idea is when ,
1) Price crosses above Resistance Level ,indicated by Red Line, is a Long condition.
2) Price crosses below Support Level ,indicated by Green Line , is a Short condition.
3) Candle high crosses above ema1, is a part of the Long condition .
4) Candle low crosses below ema1, is a part of the Short condition .
5) Volume Threshold is an added confirmation for long/short positions.
6) Maximum Risk per trade for the intraday trade can be changed .
7) Default qty size is set to 50 contracts , which can be changed under settings → properties → order size.
8) ATR is used for trailing after entry, as mentioned in the inputs below.
// ═════════════════════════//
// ————————> INPUTS <————————— //
// ═════════════════════════//
→ L_Bars ———————————> Length of Resistance / Support Levels.
→ R_Bars ———————————> Length of Resistance / Support Levels.
→ Volume Break ———————> Volume Breakout from range to confirm Long/Short position.
→ Price Cross Ema —————> Added condition as explained above (3) and (4).
→ ATR LONG —————————> ATR stoploss trail for Long positions.
→ ATR SHORT ————————> ATR stoploss trail for Short positions.
→ RISK ————————————> Maximum Risk per trade intraday.
The strategy was back-tested on TCS ,the input values and the results are mentioned under "BACKTEST RESULTS" below.
// ═════════════════════════ //
// ————————> PROPERTIES<——————— //
// ═════════════════════════ //
Default_qty_size ————> 50 contracts , which can be changed under
Settings
↓
Properties
↓
Order size
// ═══════════════════════════════//
// ————————> TIME CONDITION <————————— //
// ═══════════════════════════════//
The time can be changed in the script , Add it → click on ' { } ' → Pine editor→ making it a copy [right top corner} → Edit the line 27.
The Indian Markets open at 9:15am and closes at 3:30pm.
The 'time_cond' specifies the time at which Entries should happen .
"Close All" function closes all the trades at 3pm , at the open of the next candle.
To change the time to close all trades , Go to Pine Editor → Edit the line 92 .
All open trades get closed at 3pm , because some brokers don't allow you to place fresh intraday orders after 3pm .
// ═══════════════════════════════════════════════ //
// ————————> BACKTEST RESULTS ( 100 CLOSED TRADES )<————————— //
// ═══════════════════════════════════════════════ //
INPUTS can be changed for better Back-Test results.
The strategy applied to NSE:TCS ( 5 min Time-Frame and contract size 50) gives us 60% profitability , as shown below
It was tested for a period a 6 months with a Profit Factor of 1.8 ,net Profit of 30,000 Rs profit .
Sharpe Ratio : 0.49
Sortino Ratio : 1.4
The graph has a Linear Curve with Consistent Profits.
The INPUTS are as follows,
1) L_Bars —————————> 4
2) R_Bars —————————> 4
3) Volume Break ————> 5
4) Price Cross Ema ——> 100
5) ATR LONG ——————> 2.4
6) ATR SHORT —————> 2.6
7) RISK —————————> 2000
8) Default qty size ——> 50
NSE:TCS
Save it to favorites.
Apply it to your charts Now !!
Thank You ☺ NSE:TCS

Stock Gaps SPY Correlation StrategyThis is daytrade stock strategy, designed to take the best out of the daily gaps that are forming between the close of previous day and opening of present day.
At the same time its logic has been adapted for SPY chart, in order to use correlation with the other stocks/assets/ etf which are linked with SP500 movement.
Lastly it has been added 2 new confirmation logics, based on the USI: advance/decline chart and percentage above vwap among all US stocks.
The rules for entry are simple :
We are at the opening daily candle, we have a long/short gap based on where the opening is happening and at the same time we are checking to see that the current different between the current difference between low and previous high (or viceversa) is higher than an established parameter(minimal deviation )
For exit, we exit based on time/clock parameter, in this case by default I selected 1h and half before close of the US session.
For testing purposes I have used 10% of the available capital, with a 0.0035$ comission per each share bought ( IBKR comissions)
If there are any questions, please let me know either here or in private !

MTF Supertrend [Trading Nerd]Trend Trading Strategy using Supertrends
Backtesting Script that uses a multitimeframeanalysis of the Supertrend Indicator. The trend direction is determind by a higher Timeframe (TF) Supertrend. The entry Signals are given by the Supertrend of the current TF. The script is NOT repainting (the script takes the previous value of the higher TF Supertrend, if the higher TF candle is not confirmed yet).
Strategy Conditions
Longs:
The higher TF Supertrend has to be green
The current TF Supertrend change from red to green
Shorts:
The higher TF Supertrend has to be red
The current TF Supertrend change from green to red
Optional:
Option: If enabled also a trend chage of the higher TF Supertrend is a valid Entry Signal
If enabled Signals are discarded if the ADX is below the value
Take Profit
On default there is no Take Profit. You can activate a Risk Reward Based Take Profit target trough the option. Also a Partial Take Profit is possible.
Stop Loss
The default Stop Loss Strategy is a Trailing Stoploss. As trailing Price the current TF Supertrend is used.
Additional
Time Filter: Only opens trade in the defined Session. Open trades are still being closed outside of the Session.
Start Date/End Date: Limits the backtest for the defined Date Range
Trading Days: Only open Trades on the checked Days
Risk % per Trade: If enabled the Strategy uses X% of the capital (defined in Settings -> Properties -> Initial Capital)
Use Compound Interest: If enabled Capital is recalculated for every trade (initial capital + net Profit)
IMPORTANT: For low Timeframes and Markets with tight SL (like Forex) it requires a lower Margin Percent than default. Go to Settings->Properties and lower the required Long/Short Margin. Otherwise Trades might not be considered because of too less capital/marign. Margins can e.g. set to: 2% (Forex), 10% (Stocks), 20% (Crypto).

Pro Trading Art Open Range Breakout StrategyThis strategy is based on Selected Candle High Low Breakout with buffer point.
You can select specific candle from input tab by giving time of that candle.
Default Settings:
Start Hour : Hour of starting candle means from this input you can specify opening candle. Default is 9.
Start Minute: Minute of starting candle. Default is 15. Means Default opening candle is 9:15
Stop Hour : Means After this time no new trade will execute.
End Hour & End Minute & Close All Trade : Means when you specify End Hour and Minute and Close all trade is true then strategy will close all trade on specified time.
Buffer : With the help of this option you can add some point in High and low of Opening Candle
Trade Mode : You can specify Target and Stop Loss in point or Percent
Stop Loss Point or Percent : This will work according to Trade Mode
Target Point Or Percent : This will work according to Trade Mode

Accumulation Stage Identifier and Strategy around for TradingIn the psychology of trading at any market condition, there are four stage usually occurs on any tickers.
Stage 1 -> Neglect phase or consolidation phase
It occurs when the company does not produce the expected result and waiting for next result.
It can extend for days, weeks, months and years. Never give entry at this stage though that blue-chip told to be cheaper in price.
Stage 2 -> Accumulation
It occurs when the company's earning and sales consistently grows.
It can extend for days, weeks, months but should not expect the continues increase in price, as there will be potential pull-back which can be considered as opportunity to accumulate.
If the company fundamental is good, just give some space at the time of pullback.
Most of the time, the pullback volume will be low to compare to volume at the time of increase.
Usually, the stock that is going through accumulation stage will definitely trade above 200SMA and short term MA will be greater than long term moving average.
Continues the highest high and highest low along with volume.
Stage 3 -> Distribution
It occurs when the company's earning and sales stagnated due to certain reason.
It can extend for days, weeks while the price and volume highly volatile.
High volume while the price low
Typically, the stock that is going through distribution stage will certainly trade below 200SMA and short term MA will be lesser than long term moving average.
Continues the lowest high and lowest low along with volume.
Stage 4 -> Capitalization
Price reaches the 52W low while volume spikes on big down.
In each stage, the price & volume are perfect indicator to highlight the situation and the trader with proper discipline and patients can certainly reap the fruitful outcome of accumulation stage.
Based on this explanation, here is the strategy that is created with 50,90 & 200 Simple moving average and price volume trends (PVT) indicator applied on MACD to signal whenever the PVT convergence and divergence.
Note:
As the indicator designed to signal on the ticker that trade above 200 moving average, it is good to use this strategy on companies that are fundamental strong.
Whenever, there is pull back happens, the strategy might signal for exit, however, here comes the traders patient based on the conviction on the particular chosen stocks.
White being patient is good, disciplinary in following the strategy also important. Hence, consider the action when the stock goes opposite direction from your expectation.
Hope this strategy would help you find the profit.
Happy investing.

EMA + Bullish Engulfing Candle Pattern StrategyHello Guys! Nice to meet you all!
This is my first open source script!
### Long Condition
1. Bullish Engulfing Candle
2. No doge Candle
3. Present volume should be bigger than the previous volume (20%)
4. Trend filter (with 2 EMAs)
### Close Condition
1. When trend Changes
2. When Bearish Engulfing Candle appears
###
No stop loss and take profit.

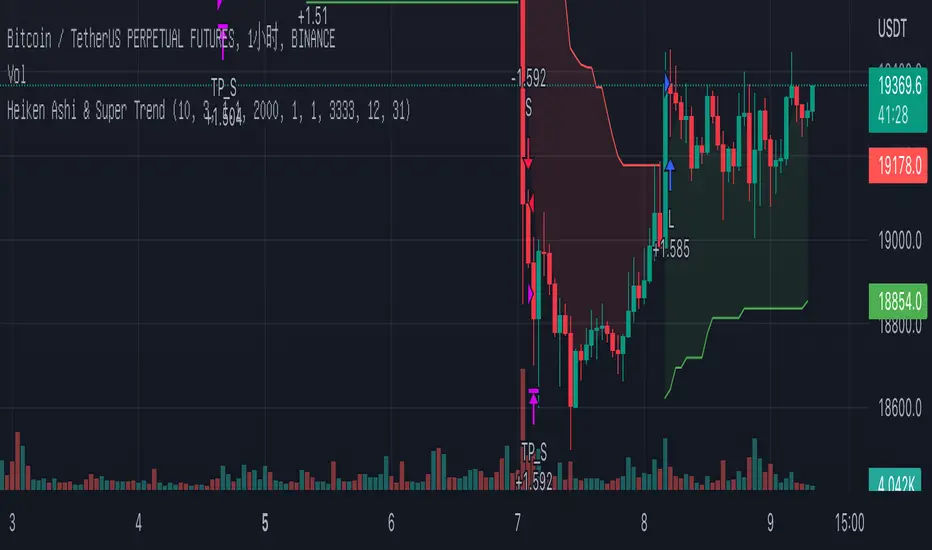
Heiken Ashi & Super TrendThis is one of my open source 1h strategies
It works on Binance: BTCUSDTPERP charts
This strategy involves two indicators
1. Heiken Ashi - a typical technical indicator to help highlight and clarify the current trend. This somehow allows the chart to ignore unnecessary fluctuations and make the trend more visible.
2.Super Trend - - One of the most common ATR-based indicators, the SuperTrend indicator is useful to help you catch big trends.
Buy entry conditions are as follows.
1. The Super Trend indicator running on the Heiken Ashi chart gives a buy signal.
2. Buy at the current market price and take profit at 1% of the normal k-line at this time.
Take profit
TP - 1%
Stop Loss
None
Candles - The WhaleThe strategy is based on candle patterns, with confluence indicators. Note some of the candles are rare, they can be found only a specific timeframe, or within specific stocks.
The added patterns are as follows:
- Bullish Engulfing
It is formed by two candles, the second candlestick engulfing the first candlestick. The first candle is a bearish candle that indicates the continuation of the downtrend.
The second candlestick is a long bullish candle that completely engulfs the first candle and shows that the bulls are back in the market.
- Bullish Harami
It consists of two candlestick charts, the first candlestick being a tall bearish candle, and the second, being a small bullish candle which should be in the range of the first candlestick.
The first bearish candle shows the continuation of the bearish trend and the second candle shows that the bulls are back in the market.
- Piercing Line
Two candles from it, the first candle being a bearish candle which indicates the continuation of the downtrend.
The second candle is a bullish candle that opens the gap down but closes more than 50% of the real body of the previous candle, which shows that the bulls are back in the market and a bullish reversal is going to take place.
- Bullish Belt
A Bullish Belt Hold, known as “yorikiri” in Japanese, is a single Japanese candlestick pattern that suggests a possible reversal of the current downtrend.
- Bullish Kicker
A bullish kicker is a two candlestick pattern that’s usually formed after a significant downtrend, but could also appear after an uptrend.
- Abandoned Baby
The abandoned baby candlestick pattern is a three-bar reversal pattern. It is similar to the morning and evening star formations and is a very reliable reversal signal when it occurs after a sharp rise or drop.
- Homing Pigeon
The bullish homing pigeon is a two-candle bullish reversal pattern that occurs at the end of a bearish trend. Both candles are negative, but the second candle is confined within the range of the previous candle.
- Breakaway
Breakaway patterns are multi-candle formations found on Japanese candlestick charts that suggest a market reversal may be in the offing. An actual breakaway is a five candlestick formation that occurs in either an upward or downward trend.
- Concealing Baby Swallow
The Concealing Baby Swallow candlestick pattern is a four-candlestick pattern that can signal a bullish reversal price movement or a bearish continuation move, depending on where it occurs in the overall market structure. However, the pattern is quite rare, and you may not encounter it in your trading.
- Doji Dragonfly
A dragonfly doji can be an indicator of a reversal in price. When the price of a security has shown a downward trend, it might signal an upcoming price increase.
- Doji Gravestone
The Gravestone Doji forms when the price closes at relatively the same level where it opened, providing that the open coincides with the low or at least the two are very close
- Doji Star
Consists of a long bullish candle, followed by a Doji that gaps up, then a third bearish candle that gaps down and closes well within the body of the first candle. An Evening Doji Star is a three-candle bearish reversal pattern similar to the Evening Star.
- Kicker
A kicker pattern is a two-bar candlestick pattern that predicts a change in the direction of an asset's price trend. This pattern is characterized by a sharp reversal in price over the span of two candlesticks. Traders use it to determine which group of market participants is in control of the direction.
- Ladder Bottom
Is a five-candle bullish reversal pattern that occurs at the end of a bullish trend. The four first candles are bearish and followed by a positive candle that starts with a positive gap.
- MatHold
A bullish pattern begins with a large bullish candle followed by a gap higher and three smaller candles which move lower.
- Matching Low
A matching low is a bullish two-candle reversal pattern that forms in an ongoing downtrend. As to its appearance, a matching low consists of two candlesticks that are negative, but the close at or around the same price.
- Meeting Lines
Bullish meeting lines are a two-candle bullish reversal pattern that occurs in a downtrend and signals a reversal of the trend. The first candle of the bullish meeting lines is bearish, and followed by a positive candle that closes very near the close of the previous candle.
- Morning Doji Star
It is made of 3 candlesticks, the first being a bearish candle, the second, a Doji, and the third being a bullish candle.
The first candle shows the continuation of the downtrend. The second candle being a doji indicates indecision in the market. The third bullish candle shows that the bulls are back in the market and a reversal will take place. The second candle should be completely out of the real bodies of the first and third candles.
- Rising Three Method1
Rising three methods is a bullish continuation pattern that appears in an ongoing uptrend. The Rising three methods pattern consists of five candles. where the first and last candles are long and bullish, with three small bearish candles in between.
- Rising Three Method2
It is the same as "Rising Three Method1" but with a different calculation
- Upside Tasuki Gap1
Is a bullish continuation candlestick pattern that forms in an ongoing uptrend. It consists of three candles, where the two first are bullish with a positive gap in-between, and followed by a negative candle that closes in the gap formed between the first two candles.
- Upside Tasuki Gap2
It is the same as "Upside Tasuki Gap1" but with a different calculation
- Three Line Strike1
Is a four-candle bullish continuation candlestick pattern. It forms a bullish trend and is believed to signal the continuation of the bullish trend.
- Three Line Strike2
It is the same as "Three Line Strike2" but with a different calculation
The confluence indicators:
Movement Averages: multi options checks, you can select what to check to open a position, and the description of each open is in the strategy.
Volume Oscillator: positive signal if the volume is above zero.
EMA: positive signal if the candle source is above EMA.
VWAP: positive signal if the candle source is above VWAP.
BTC Trend: it is an equation to track the BTC price movement
The profit is based on TSL, while the stop loss is based on ATR, or lowest candle.
The recommended time frame is 4 hours.

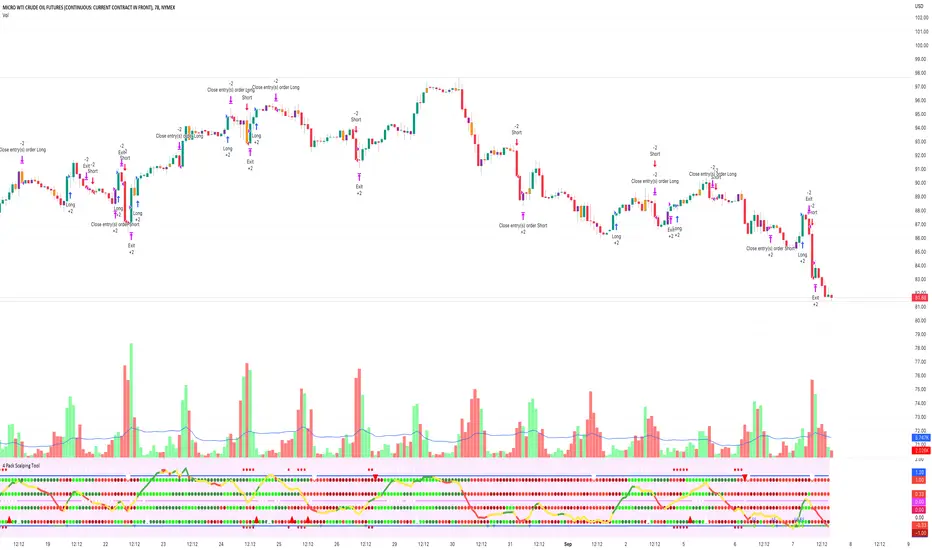
4 Pack Scalping ToolThe 4 Squeeze Scalp tool is a tool that I have developed over the past few years. I was always fascinated by the fact that most people don’t know where price is heading. While Fibonacci and other linear type methods work it never gelled with me. I started by going deep into the fundamentals of momentum with an understanding that an object in motion heading in a particular direction tends to stay heading in that direction (until something derails it). Price, in my opinion, is no different.
Price can move up, down and sideways. And it moves in a wave, getting stronger over time until eventually pulling back and starting over again. In my mind, the compression of price and the relationship of that pressure to various lengths of time as well as RSI, ADX and DMI across these same time frames gives you a view on how the underlying price momentum is building up and releasing. For trading you want to be building a trade when pressure starts to build and you want to take profits when the wave starts to pull back and build for the next cycle.
Each dot represents a length of the momentum indicator and the line inside the oscillator is a weighted composite of the underlying momentum structure for each of the lengths selected. A trade follows the directional alignment of the line (red = down, yellow = neutral / chop, green = up) and the dots should be aligned from the bottom to the top (bright green = very bullish, dark green = neutral / bullish, dark red = neutral / bearish, bright red = very bearish). When the line and the dots are aligned you will have a high probability trade.
The backtest results below are based on 2 years of backtesting, using a 2 contract trade on a 100K account. While the absolute return is not meaningful the win rate and PF are great for a trade on CL on this timeframe. The tool can be used on any asset over any timeframe in a multitude of combinations.
To get access to the tool, please contact the author.
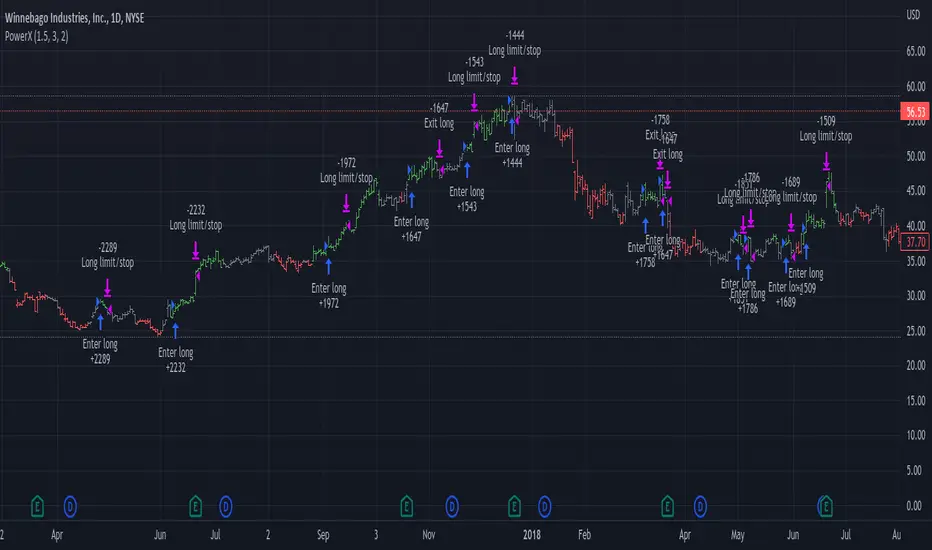
PowerX by jwitt98This strategy attempts to replicate the PowerX strategy as described in the book by by Markus Heitkoetter
Three indicators are used:
RSI (7) - An RSI above 50 indicates and uptrend. An RSI below 50 indicates a downtrend.
Slow Stochastics (14, 3, 3) - A %K above 50 indicates an uptrend. A %K below 50 indicates a downtrend.
MACD (12, 26, 9) - A MACD above the signal line indicates an uptrend. A MACD below the signal line indicates a downtrend
In addition, multiples of ADR (7) is used for setting the stops and profit targets
Setup:
When all 3 indicators are indicating an uptrend, the OHLC bar is green.
When all 3 indicators are indicating a downtrend, the OHLC bar is red.
When one or more indicators are conflicting, the OHLC bar is black
The basic rules are:
When the OHLC bar is green and the preceding bar is black or Red, enter a long stop-limit order .01 above the high of the first green bar
When the OHLC bar is red and the preceding bar is black or green, enter a short stop-limit order .01 below the low of the first red bar
If a red or black bar is encountered while in a long trade, or a green or black bar for a short trade, exit the trade at the close of that bar with a market order.
Stop losses are set by default at a multiple of 1.5 times the ADR.
Profit targets are set by default at a multiple of 3 times the ADR.
Options:
You can adjust the start and end dates for the trading range
You can configure this strategy for long only, short only, or both long and short.
You can adjust the multiples used to set the stop losses and profit targets.
There is an option to use a money management system very similar to the one described in the PowerX book. Some assumptions had to be made for cases where the equity is underwater as those cases are not clearly defined in the book. There is an option to override this behavior and keep the risk at or above the set point (2% by default), rather than further reduce the risk when equity is underwater. Position sizing is limited when using money management so as not to exceed the current strategy equity. The starting risk can be adjusted from the default of 2%.
Final notes: If you find any errors, have any questions, or have suggestions for improvements, please leave your message in the comments.
Happy trading!
AlphaTrend Strategy with Trailing SL %this is a modified version of AlphaTrend Strategy with added trailing Stop Loss
this is my first script that I have added to tradingview community
the trailing SL makes it very effective to lower the losses and can improve the overall return

[Crypto] Supertrend - ADX - Reversal Candle* Commission: 0.06% = Binance future fee.
1. ADX INDICATOR: 1h & 4h timeframe have a strong strength for open trade.
- ADX smoothing: 14.
- DI length: 14.
- ADX STRONG > 25.
2. SUPERTREND INDICATOR:
- Long trend when closes candle is above the green line.
- Short trend when closes candle is below the red line.
3. REVERSAL CANDLES DETECT:
- Cancels the Short trend if occurs 5 bullish reversal candles.
- Cancels the Long trend if occurs 5 bearish reversal candles.
- Cancels the Short trend if occurs bullish Engulfing reversal candles.
- Cancels the Long trend if occurs bearish Engulfing reversal candles.
4. OPEN POSITION RULE:
- BUY/LONG: reject to Supertrend at current timeframe.
- SELL/SHORT: reject to Supertrend at current timeframe.
5. Autotrade with Money management: requires Pro, Pro +, Premium Tradingview & Webhook service.
6. Winrate of 129 coin pairs of Binance future
7. DEEP BACKTEST:
- BITCOIN ALL TIME HISTORY INDEX
- ETHEREUM ALL TIME HISTORY INDEX
- LITECOIN BINANCE FUTURE
- BINANCE COIN BINANCE FUTURE
- XRP BINANCE FUTURE

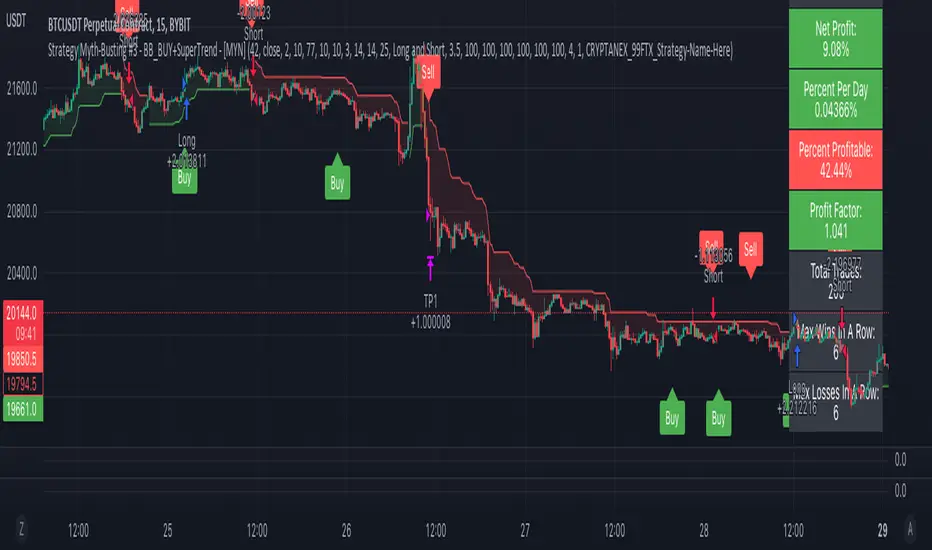
Strategy Myth-Busting #3 - BB_BUY+SuperTrend - [MYN]This is part of a new series we are calling "Strategy Myth-Busting" where we take open public manual trading strategies and automate them. The goal is to not only validate the authenticity of the claims but to provide an automated version for traders who wish to trade autonomously.
Our third one we are automating is one of the strategies from "The Best 3 Buy And Sell Indicators on Tradingview + Confirmation Indicators ( The Golden Ones ))" from "Online Trading Signals (Scalping Channel)". No formal backtesting was done by them so wanted to validate their claims.
If you know of or have a strategy you want to see myth-busted or just have an idea for one, please feel free to message me.
This strategy uses a combination of 2 open-source public indicators:
BB_Buy and Sell by guikroth (default settings)
SuperTrend from TradingView's Technicals (default settings)
Trading Rules
15 min candles
Long
Long condition when BB_BUY indicates buy signal and SuperTrend is green
Short
Short condition when BB_BUY indicates Sell signal and SuperTrend is red
V Bottom & V Top Pattern [Misu]█ This indicator shows V bottom & V top patterns as well as potential V bottom & V top.
These V bottom & V top are chart powerful reversal patterns.
They appear in all markets and time-frames, but due to the nature of the aggressive moves that take place when a market reverses direction, it can be difficult to identify this pattern in real-time.
To address this problem, I added potential V pattern as well as the confirmed one.
█ Usages:
You can use V top & V bottoms for reversal zones.
You can use it for scalping strategies, as a main buy & sell signal.
Potential V patterns can be used to anticipate the market, in addition to volatility or momentum indicators, for example.
█ How it works?
This indicator uses pivot points to determine potential V patterns and confirm them.
Paramaters are available to filter breakouts of varying strengths.
Patterns also have a "max number bars" to be validated.
█ Why a Strategy type indicator?
Due to the many different parameters, this indicator is a strategy type.
This way you can overview the best settings depending on your pair & timeframe.
Parameters are available to filter.
█ Parameters:
Deviation: Parameter used to calculate parameters.
Depth: Parameter used to calculate parameters.
Confirmation Type: Type of signal used to confirme the pattern.
> Mid Pivot: pattern will confirm on mid pivot breakout.
> Opposit Pivot: pattern will confirm on opposit pivot breakout.
> No confirmation: no confirmation.
Lenght Avg Body: Lenght used to calculate the average body size.
First Breakout Factor: This factor multiplied by the "body avg" filters out the non-significant breakout of potential V pattern.
Confirmation Breakout Factor: This factor multiplied by the "body avg" filters out the non-significant breakout for the confirmation.
Max Bars Confirmation: The maximum number of bars needed to validate the pattern.

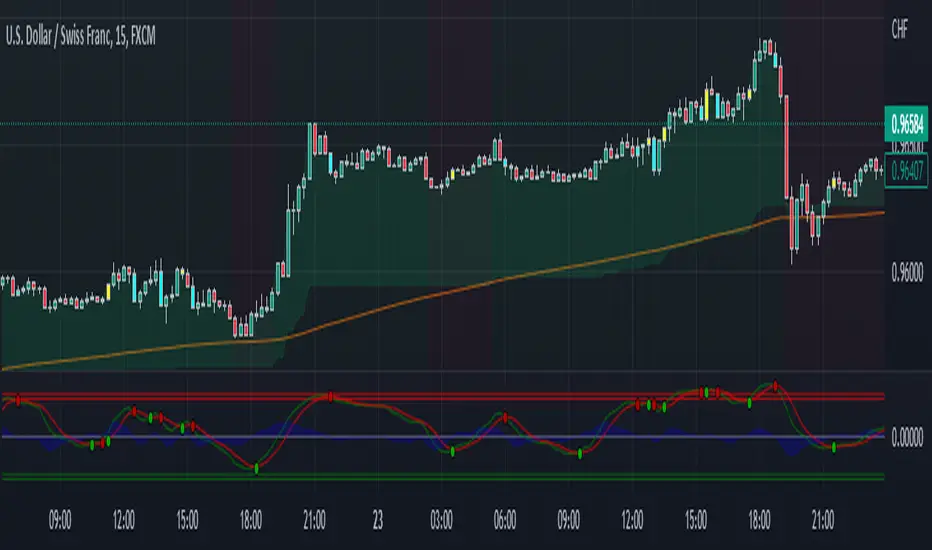
QG-Trend Pullback StrategyI wanted to test the pullback strategy shown by TradePro and 5 minute scalping channels on the YT.
So here it is, worked on USDCHF pair best and not so much on other forex pairs on 15 min or 5 min charts as shown in strategy.
Entry rules for Long:
Price above EMA200 or G channel as trend filter
Donchian trend ribbon in retracement or red in color
Wavetrend cross below a threshold level below zeroline.
Opposite rules for Shorts.
The SL and TP based on the ATR multiplier and a TP as RR ratio to SL.
Attaching the equity curve on USDCHF 15 min chart where it worked best.
Bitfinex Shorts StratOverview
This strat applies the data from BITFINEX:USDSHORTS to the RSI indicator in order to provide SHORT/LONG entries as the number of contracts goes up and down. Although Bitfinex has lost relevance over the years its generally considered an exchange dominated by smart money rather than retail. I'd like to see if any insights can be gained by following their trading behaviour.
How to use
Select the underlying security you wish to trade and load the indicator. Select the appropriate short security by searching in the Bitfinex Short Symbol. RSI settings apply to short symbol not the actual asset. Strategy shorts the underlying asset when shorts rise and longs when they drop. The shorts symbol will follow the value of the loaded chart. Works best on 4 hour chart.
Why use shorts only rather than both long/shorts?
Bitfinex longs seem to be on a long-term uptrend accounting for 25x the number of shorts. Might be enormous confidence on part of the whales, but more likely reflects selling spot and buying perp. Given the size disparity and price action I don't think longs info is adding much.
Problems with script:
a) We don't really know the intentions of short players (e.g. speculation or hedging spot)
b) The script uses a decline in shorts as a long signal
c) RSI is a blunt tool there are probably better options for calculating high/lows in shorts
d) Shorts are accumulated both at highs and also when BTC price is already heavily trending down. This suggests some are speculative (at the highs) or protective/hedging during a decline
Takeaways:
Based on this strat Bitfinex whales are more wrong than right.
Results don't carry across well into altcoins using the accompanying short symbol. However, what is interesting is that applying the BITFINEX:BTCUSDSHORTS to altcoin charts does work pretty well.
Strat needs some refinement to control for entries under different circumstances.
Probably not a great idea to use this as a strategy in isolation, but highlights how Bitfinex whale behaviour is a good gauge to follow.

Monthly Returns of a Strategy in a ChartIt's a simple example of how you can present your strategy's monthly performance in a chart.
You maybe know that there is no support of these kind of charts in TradingView so this chart is actually a table object under the hood.
Table visual appearance is customizable, you can change:
Location
Bar Width / High
Colors
Thanks to @MUQWISHI for hard work, for helping me coding it.
It's not about the strategy itself but the way you display returns on your chart. So pls don't critique my choice of the strategy and its performance 🙂
Disclaimer
Please remember that past performance may not be indicative of future results.
Due to various factors, including changing market conditions, the strategy may no longer perform as well as in historical backtesting.
This post and the script don’t provide any financial advice.

WAE TrendA trend follower based on Waddah Attar Explosion, a day trading system based on MACD and BB combined. This also has filters based on RSI, EMA and ADX, and stop losses and ADX for exits.
This approach seems to work well for scalping, in 5m to 1h candles. Possibly could be used for swing as well, but haven't tried it.

Oscillating SSL Channel Strategy - 3m & 5m Time FramesThis script is pretty self-explanatory. I will suggest trying some different exits to get that win rate above 20% (I'd start with Take Profit and Stop Loss percentages).
Enjoy!
Trend Identifier StrategyTrend Identifier Strategy for 1D BTC.USD
The indicator smoothens a closely following moving average into a polynomial like plot and assumes 4 staged cycles based on the first and the second derivatives. This is an optimized strategy for long term buying and selling with a Sortino Ratio above 3. It is designed to be a more profitable alternative to HODLing. It can be combined with 'Accumulation/Distribution Bands & Signals' and 'Exponential Top and Bottom Finder'.
