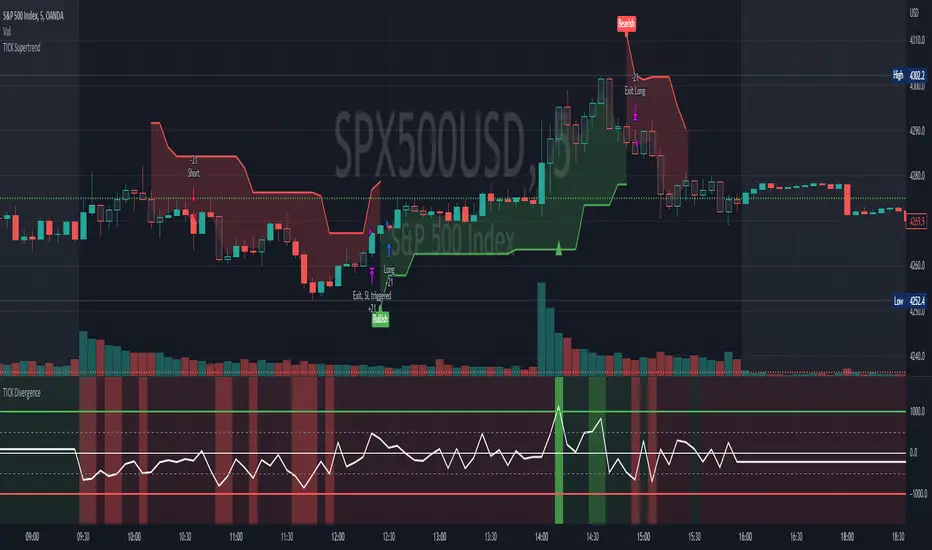
[Pt] TICK Supertrend Strategy, 5 minBackground:
It is well known that the indices such as SPY and QQQ follow/represent market sentiment. The TICK index literally represents the market sentiment as it compares the number of stocks that are rising and falling on the NYSE. By default, the TICK index is a short term indicator. Therefore it isn't reliable for swing trading or long term strategies. However, it is perfect for scalping.
Although TICK is well known, many does not know how to use it effectively. As part of the background mechanism of this script, I’ve divided TICK into 5 major zones based on the close of each candle: Overbought (neutral with bearish bias), Bullish, Neutral, Bearish, and Oversold (neutral with bullish bias). Along with the use of Heikin Ashi technique, RSI, moving averages and candle analysis, this strategy aims to provide accurate representation of market sentiment and profitable entry and exit points. *** At the time of publication, this strategy has proved to be consistently profitable. HOWEVER, this DOES NOT guarantee future profitability. So use at your own risk! ***
What is it showing?
This strategy is an intraday scalping strategy that uses TICK data to predict market directions for optimal entry and exit points. It is displayed similarly to the famous Supertrend indicator, which is one of the most common ATR based trailing stop indicators, so visually it is easy to read. This strategy is suitable for trading indices such as SPX , SPY , SPX500USD , QQQ , DJI and any other tickers that have high positive correlation with TICK.
Script is proprietary, but as mentioned it incorporates the following elements with additional candlestick analysis, pattern recognition, stop-loss and profit taking strategy:
- NYSE TICK data
- Heikin Ashi candle technique
- ATR
- RSI
- Moving Averages
Bullish trend is determined by a confluence of said indicators and analyses, and is displayed as a green line under the price action. The distance is defined by an adjustable value that is based on a percentage of the previous daily ATR value. When a long order is in play, that line also acts as the stop-loss level. Bearish trend is the opposite and is displayed in red, by default.
What's unique?
Detecting a ranging market structure and avoiding overtrading in a choppy market has always proven to be difficult, even for the most professional traders. This strategy has built-in “choppiness” and volatility filtering scripts that attempts to help reduce the number of false entries. These elements are what makes this strategy unique and different from other indictors mashup strategies.
In addition, this strategy takes previous trades into account and “learn” from past trades when determining the optimal stop-loss level to maximize profitability. This allows this strategy to better adapts to changing and evolving market conditions.
Strategy statistics
All parameters are designed for 5min time frame.
At the time of publication, this strategy has proved to be consistently profitable through limited back testing data.
Initial capital = $10000
Pyramiding = 1
Slippage = 3 ticks to account for spread
Default leverage shown = 9x
Quantity per trade = 100% of account
Back testing period at time of publication = Apr 11, 2022 - July 22, 2022
Trading Session = 1000 - 1530 Mon-Fri
Timeframe = 5 min
Gain = 1338.48%
Total trades = 253
% Profitable = 45.85%
Profit Factor = 2.506
Max Drawdown = 19.36%
Extras
This release includes default AutoView alerts for trading SPX500USD on Oanda. It includes both long and short order entry alerts, and trailing stop-loss alerts.
Please DM for free trial.
Analisi trend
3C QFL Mean reversalWhat is QFL trading strategy?
QFL stands for Quickfingersluc, and sometimes it is referred to as the Base Strategy or Mean Reversals. Its main idea is about identifying the moment of panic selling and buying below the base level and utilizing Safety orders.
What is Base level or Support Level?
Base level or Support Level refers to the lowest price level that was reached before the moment the price started increasing again. At that level, you can notice that buyers of some cryptocurrencies make a strong reaction.
In this strategy we can also reverse the strategy and go short. But i must warn you that that is alot riskier.
QFL is meant to be used on higher TF's like 1hr, 2hr and 4hr. But this strategy also work well on lower Timeframes.
The script also simulates DCA strategy with parameters used in 3commas DCA bots for futures trading.
Experiment with parameters to find your trading setup.
Beware how large your total leveraged position is and how far can market go before you get liquidated!
Do that with the help of futures liquidation calculators you can find online!
Included:
An internal average price and profit calculating, instead of TV`s native one, which is subject to severe slippage.
A graphic interface, so levels are clearly visible and back-test analyzing made easier.
Long & Short direction of the strategy.
Table display a summary of past trades
Vertical colored lines appear when the new maximum deviation from the original price has
been reached
All the trading happens with total account capital, and all order sizes inputs are expressed in percent.

ATR + MTF Candles + HullMa + DIThis is a strategy based on a youtube video by TradeIQ: www.youtube.com
I've reverse engineered the 1 minute Easy Scalping Sys 3.0 indicator (since it is not open source).
The default trading rules are set to the recommendations of TradeIQ but can be adjusted to find maximum performance.
This script uses 4 timeframes to color the bars, stop-loss ATR bands to find the stop-loss, Divergence Indicator to find an entry and Hull MA for trend analysis.
Special credits go to:
@mohamed982 for making Hull MA
@veryfid for making ATR Stop Loss Finder
@BeikabuOyaji for making ADX and DI

IPB_JPMUPS_2022Introduction :
This indicator serves two purposes
a) It is a multi dimensional floor pivot indicator, which takes its concepts from Secrets of Pivot Boss book of Frank Ochoa. Most of the indicators suggested in the book are packed in one indicator.
b) It also has an inbuilt intraday strategy which identifies trend, direction and momentum based on CPR (Central Pivot Range) concepts and accordingly comes up with trading signals.
How this indicator is different from the published ones :
A). Role as an indicator
This indicator has all the CPR (Central Pivot Range) indicators packed together which provides a ready made solution for CPR based trading. The following are the salient features of this indicator :
1) This indicator plots daily CPR using previous day high, low and close. It also plots Support and Resistance levels based on floor pivots formula.
Moreover, it also plots developing CPR which is based on current day's high, low and close. Apart from that it also plots CPR for next day session as well which is useful for EOD analysis.
2) This indicator plots weekly CPR using previous week high, low and close. It also plots developing CPR which is based on current week's high, low and close.
3) This indicator plots monthly CPR using previous month high, low and close. It also plots developing CPR which is based on current month's high, low and close.
4) This indicator plots pivot EMA which is called PEMA. It uses three different EMAs which are customisable and uses them to plot a moving average web based on pivot points of each candle, which is called as PEMA. This also facilitates PEMA plotting for higher time frame (daily time frame) as well.
5) This indicator plots daily time frame moving average in intraday chart which can be used as a key zone during trading. The period is customisable.
B) Role as a strategy
This indicator also functions as an intraday trading strategy called JPMUPS (JP stands for author's nickname. MUPS stands for Manoj Ultimate Pivot Strategy). This strategy attempts to identify trend, direction and momentum and when all these three align together it gives buy and sell signals. The concepts are as under:
Trend identification :
Whenever a trend is established, the developing CPR starts to widen. Hence this strategy uses the width of the developing CPR and compares it with the MA of the width to identify the trend. If the width of the developing CPR crosses the 34 period MA (can be customised), it assumes a trend is developing.
Direction identification:
Whenever a direction is established, the CPR components, namely BC and TC shifts its position. Hence this strategy uses this concept to identify the direction. It computes MACD sort of histogram of the BC and TC difference and whenever the histogram slops upwards, it assumes bullish direction and vice versa.
Momentum identification :
Whenever momentum is established, the developing CPR starts sloping upwards. Hence this strategy uses this concept to identify the momentum. It computes RSI of the developing CPR and if the RSI is above the 34 period MA (can be customised) of RSI , it assumes momentum is establishing and vice versa.
When all the above are aligned together, it gives buy or sell signals suitably.
How to use it :
a) Indicator usage :
1) CPR zones are key zones which predominantly acts as support and resistance zones. Looking at the price action at these zones, one can look for trading opportunities in live market.
2) Developing CPR acts as pull back zones and is very useful in live trading and also EOD analysis for spotting opportunities by combining price action.
b) Strategy usage :
1). Strategy signals are only indicative. Users are strongly advised not to use the strategy blindly. Users are advised to go though the CPR concepts thoroughly and use this strategy signals only as a supplement for further decision making / analysis.
Markets meant for :
1). This indicator and Strategy is predominantly designed for I ndian stock markets . However it can be customised for other markets as well by changing the timings of the markets in the parameters.
Market conditions meant for :
1). This indicator is meant for all types of market conditions as its predominant role is to plot the key support and resistance zones using CPR concepts.
2). The strategy is mainly found to be effective in trending markets and predominantly indices like Nifty and Bank Nifty . Hence Users are advised to use this only as an indicative feature and not blindly trade based on signals. The strategy is found to be less effective in lower time frames like 1min / 3min, etc. 15 min time frame provides fair performance. However it doesnt mean that it will continue to perform in the same manner in the future.

The Ultimate Backtest - Fontiramisu█ OVERVIEW
The Ultimate Backtest allows you to create an infinite number of trading strategies and backtest them easily and quickly.
You can leverage the trading setup you created with the tradingview's real-time alert system.
The tool is constantly being improved to accommodate more in-house indicators in order to imagine more trading strategies.
█ HOW IT WORKS.
The tool is divided into 3 main parts:
1. The indicators:
These are the indicators that you will be able to set up to create your setups.
Example: rsi, exponential moving average, home made resistance/support indicator etc.
We are working to add more and more in-house indicators to multiply the trading strategies.
2. The entry/exit strategy:
The entry/exit trades management is a central point of the strategy.
Here we propose several ways to take profits and in-house optimizations to enter a position.
3. The setup: the combination of indicators
Here it is up to you to create your own recipe.
You combine the different indicators set up above to make a real strategy.
Example: RSI Divergence + Location on a support.
Let's look at this in more detail.
Below is a description of all sections
█ 1. THE INDICATORS
TREND: MA (moving average) -->
Set up a moving average from multiple methods (sma, ema, smma...) of the type and length you want.
> A long is taken if the price is above the MA.
> A short is taken if the price comes below the MA.
You can set up a smoothing MA from the existing moving average and use it in the same way.
ENVELOPE: SUPER TREND -->
The supertrend is a trend following indicator. It clearly describes the distinction between downtrends and uptrends with a red or green direction. It is calculated according to the ATR and a factor.
> A long is taken when the direction is green and the price touches the supertrend support line.
> A short is taken when the direction is red and the price touches the supertrend resistance line.
ENVELOPE: BOLLINGER BAND -->
Bollinger bands are used to evaluate the volatility and probable evolution of prices, here we exploit the envelope
> A long is taken if the price crosses the lower band.
> A short is taken if the price crosses the upper band.
CLOUD: ICHIMOKU -->
The Ichimoku cloud aims to identify the direction and reversal points of dominant market trends. It displays support and resistance levels.
> A long is taken when the price enters the green ichimoku cloud.
> A short is taken when the price enters the red ichimoku cloud.
MOMENTUM: MACD ZERO LAG / MACD / RSI -->
RSI (Relative Strength Index) reflects the relative strength of upward movements, compared to downward movements.
MACD (Moving Average Convergence Divergence) is a momentum indicator that follows the trend and shows the correlation between two moving averages of the asset price.
MACD ZERO LAG is calculated in the same way except that the exponential moving averages that make up the calculation do not lag.
> A long is taken on a potential bullish divergence.
> A short is taken on a potential bearish divergence.
For now, with these indicators, we only take a trade based on divergences but we will add overbuy/oversell etc.
MOMENTUM: MA SLOPE -->
This house indicator allows you to use the slope of a moving average as a measure of momentum.
Define the length of the moving average whose slope we will take.
We then take a fast ma of the slope then a slow ma (You define the lengths with the parameters)
The tool foresees a subtraction between the slow and fast ma to have another interpretation of the slope.
This indicator is available and can be viewed freely on my tradingview profile.
> A long is taken when there is a potential bullish divergence on the fast/slow MA or the difference.
> A short is taken when there is a potential bear divergence on the fast/slow MA or the difference.
RESISTANCE: R/S FONTIRAMISU -->
An in-house indicator that shows resistances and supports according to the chosen parameters.
Indicator available and can be viewed freely on my tradingview profile.
> A long is taken when the price arrives on a support.
> A short is taken when the price arrives on a resistance.
-----
MOMENTUM DIVERGENCE -->
Section used to set the divergence detection.
The first field allows you to select which momentum you want to calculate the divergence on.
PIVOT DETECTION -->
Used to calculate top and dip on the chart, it is used with divergences/resistances/enter-exit optimizations....
Default parameters are: Deviation: 2.5, Depth: 10.
█ 2. STRATEGY FOR ENTERING/EXITING TRADES.
STRATEGY: TP/SL -->
Enter/Exit Trade Mode" field: The first field allows you to choose between two modes:
1. TP/SL Mode:
This mode allows you to take entries with take profits that you define afterwards with the TP1 and TP2 parameters .
> The stop loss is calculated automatically by taking the last dip if it is a long and the last top if it is a short.
> You can add a "Stop Loss % Offset" which will increase the size of the stop loss by the % value you set.
> If you activate TP2, the profit taking is split between TP1 and TP2, you can select the percentage of profit taking split between TP1 and TP2 via the "Percent Exit Profit TP1" field.
> The "TPX Multiplier" fields allow you to define the desired Risk Reward, if = 1 then RR = 1/1.
> A Trailing stop option is available, if active then the profit take will be split between TP1 and Trailing stop.
For the moment you can choose between the two MA's set up above to serve as trailing stop:
> In long, if the price goes below the MA then you take the profit (or the loss)
> In short, if the price goes above the MA then you take the profit (or the loss)
2. ONLY BUY/SELL:
Here the take profits are not taken into account, we only have an alternation between the long and the shorts.
The trailing stop applies to this mode and can be interesting depending on the use.
STRATEGY: SETUP OPTIMIZER (FP) -->
Here we have 3 home made optimization tools to take more relevant trades.
1. FAVORABLE ENTRY FROM PIVOT.
Here the tool will favor entries with interesting locations depending on dips and tops before.
A red cross with "FP" will appear on the chart each time a trade does not meet this condition.
2.STOP LOSS MAX (SL).
Will only take trades where the stop loss is maximum at X%.
A red cross with "%SL" will appear on the chart each time a trade does not meet this condition.
3. MOVE ALREADY TRADED.
Will not take several trades in the same move.
This can avoid cascading losing trades on some setups.
A red cross with "MT" will appear on the chart each time a trade does not meet this condition.
█ 3. THE SETUP: THE COMBINATION OF INDICATORS
Here, let your creativity speak.
You are free to assemble the indicators in the following way:
The conditions defined inside a group (group1/group2/group3) are combined to each other via an OR operator .
Example, if "cond01 = Momentum DIv" and "cond02 = Res/Sup Location", then trades will be triggered if one of the two conditions is met.
The conditions defined between several groups are multiplied via the AND operator .
Example, if "cond01 = Momentum DIv" and "cond12 = Res/Sup Location", then trades are taken if both conditions are met at the same time.
ALL CONDITIONS:
> NONE
No conditions selected.
> Momentum Div
Triggers when a potential divergence occurs on the selected momentum (in the divergence section).
> Momentum Div UT Sup
Triggers when a potential divergence occurs on the selected momentum (in the divergence section) in the upper timeframe.
The upper timeframe of the momentum is calculated directly in the code by multiplying the set parameters by 4 (fastlenght/slowlenght...).
> Multi MA
It is set in the "Trend: MA" section and is triggered by the conditions mentioned in the "INDICATORS" section.
> Smooting MA
Is set in the "Trend: MA" section and is triggered by the conditions mentioned in the "INDICATORS" section.
> Super Trend Env
Is set in the "ENVELOPE: SUPER TREND" section and is triggered by the conditions mentioned in the "INDICATORS" section.
> BB Env
It is set in the "ENVELOPE: BOLLINGER BAND" section and is triggered by the conditions mentioned in the "INDICATORS" section.
> Ichimoku Cloud
Is set in the "CLOUD: ICHIMOKU" section and is triggered by the conditions mentioned in the "INDICATORS" section.
> Res/Sup Location
Is set in the "RESISTANCE: R/S" section and is triggered by the conditions mentioned in the "INDICATORS" section.

Miyagi STrend StrategyMiyagi: The attempt at mastering something for the best results.
Miyagi indicators combine multiple trigger conditions and place them in one toolbox for traders to easily use, produce alerts, backtest, reduce risk and increase profitability.
Miyagi STrend was created to allow traders the ability to both scalp and swing trade from as singular indicator. STrend aims to help traders catch more of the move.
STrend Strategy built for the Miyagi STrend found here:
It would be best suited to utilize a stoploss when trading with Miyagi STrend to minimize risk.
Alerts are meant to fire on "Once per Bar Close" to confirm entry and exit signals.
Happy Trading!

Pullback StrategyBTCUSD -- 5 min
BUY POSITION
1 : Fast ema is above medium ema and medium ema is above slow ema
2 : The price drops below the fast ema but not the slow ema
3 : The price rises above the fast ema
SELL POSITION
1 : Fast ema is below medium ema and medium ema is below slow ema
2 : the Price rises above fast ema but not slow ema
3 : The price drops back below the fast ema

HalfTrend StrategyBTCUSD -- 5 min
BUY POSITION
1 : The price is above the ema
2 : A buy signal appears on the HalfTrend (blue triangle)
SELL POSITION
1 : The price is bellow the ema
2 : A sell signal appears on the HalfTrend (red triangle)

J2S Backtest: 123-Stormer StrategyThis backtest presents the 123-Stormer strategy created by trader Alexandre Wolwacz "Stormer". The strategy is advocates and shared by the trader through his YouTube channel without restrictions.
Note :
This is not an investment recommendation. The purpose of this study is only to share knowledge with the community on tradingview.
What is the purpose of the strategy?
The strategy is to buy the 123-Stormer pattern at the bottom of an uptrend and sell the 123-Stormer pattern at the top of a downtrend, aiming for a short stop for a long profit target.
To which timeframe of a chart is it applicable to?
Recommended for weekly and daily charts, as the signals are more reliable, being that strategy a good option for swing and position trading.
What about risk management and success rate?
The profit target is established by the author as being twice the risk assumed. Also according to the author, the strategy is mathematically positive, reaching around 65% of success rate in tradings.
How are the trends identified in this strategy?
Two averages are plotted to indicate the trend, a fast EMA average with an 8-week close and a slow EMA average with an 80-week close.
Uptrend happens whenever the fast EMA is above the slow EMA and prices are above the fast EMA. In this case, we should start looking for a LONG entry based on the signal of the 123-Stromer pattern to buying.
On the other hand, downtrend happens when the fast EMA is below the slow EMA and prices are below the fast EMA. In this case, we should start looking for a SHORT entry based on the signal of the 123-Stromer pattern to selling.
How to identify the 123-Stormer pattern for a LONG entry?
This pattern consists of three candles. The first candle has a higher low than the second candle's low, and the third candle has a higher low than the second candle's low. In this pattern, we will buy as soon as a trade occurs above the third candle's high, placing a stop as soon as a trade occurs below the second candle's low, with profit target twice the risk assumed. In another words, the amplitude of the prices of the three candles from the third candle’s high upwards. (you can use fibonacci extension to determine your stops and profit targets).
Importantly, the low of the three candles must be above the fast EMA average and in an uptrend.
How to identify the 123-Stormer pattern for a SHORT entry?
This pattern consists of three candles. The first candle has a lower high than the second candle's high, and the third candle has a lower high than the second candle's high. In this pattern, we will sell as soon as a trade occurs below the third candle's low, placing a stop as soon as a trade occurs above the second candle's high, with profit target twice the risk assumed. In other words, the amplitude of prices of the three candles from the third candle’s low down (you can use fibonacci extension to determine your stops and profit targets).
Importantly, the high of the three candles must be below the fast average and in a downtrend.
Tips and tricks
According to the author, the best signal for both LONG or SHORT entry is when the third candle is a inside bar of second candle.
Backtest features
Backtest parameters are fully customizable. The user chooses to validate only LONG or SHORT entries, or both. It is also possible to determine the specific time period for running the backtests, as well as setting a threshold in candels for entry by the 123-Stormer pattern.
Furthermore, for validation purposes, you can choose to activate the best signal of the pattern recommended by the author of the strategy, as well as change the values of the EMA averages or even deactivate them.
Final message
Feel free to provide me with any improvement suggestions for the backtest script. Bear in mind, feel free to use the ideas in my script in your studies.

MACD StrategyBTCUSD -- 5 min
BUY POSITION
1 : The price is above the EMA
2 : The macd line crosses above the line signal below 0
SELL POSITION
1 : The price is bellow the EMA
2 : The macd line crosses below the signal line above 0

Market First - Relative Strength/Weakness (the ZenBot strategy)This market-first trading strategy gives BUY, SHORT, and CLOSE signals based on volume, trend, and relative strength or weakness to the market (SPY by default, can be customized). This indicator is useful for signaling day-trade entries and exits for tickers that are strong (or weak) against the market.
Stocks that are showing relative strength (or weakness) to the market, are trending, and have decent movement generate a buy (or short) signal. When the trend runs out, a CLOSE signal is fired.
Potential profit (based on ATR) and actual profit is calculated, predicting the type of move expected
Unique 'stay in trade' logic helps prevent unnecessary CLOSE signals if a trend is likely to continue
A colored plot indicates the strength of the current trend and turns orange/red when the strength is weakened.
Crypto traders can uncheck 'Trade during market hours' for 24-hour trading, and should change the comparison ticker from SPY to BTCUSD or something similar for their market.
Enjoy!
KEY CONCEPTS
The three- and five-minute timeframes are used to establish and verify trend ( ADX /DI with custom logic)
Entries and exits are based on Parabolic SAR and confirmed on multiple timeframes, trend, and relative volume
Relative strength /weakness to the market compares ticker to SPY
Chop is avoided at all costs. I've experimented with choppiness indicator below 38, but found that the ADX DI+/- readings work even better.
Trend is established using ADX DI+/- readings over 20, confirmed by EMA 5/13 crossover and EMA5 slope
Signals will fire only if the average volume for the current 5-min bar is above normal
Only tickers with a five-bar / 13 period ATR of 1% the ticker's price generate signal.
Only longs above daily-anchored VWAP , shorts below daily-anchored VWAP
Signals fire on bar close to prevent repainting / look-ahead bias
Indicator labels and alerts generated
SIGNALS
BUY: up-trending tickers showing relative strength are bought on the three-minute PSAR
SELL: when the close price falls below the 1, 3, and 5-minute PSAR, or the ADX DI- falls below 20
SHORT: down-trending tickers with relative weakness are shorted on the three-minute PSAR
COVER: when the close price moves above the 1, 3, and 5-minute PSAR, or the ADX DI- falls below 20
ALERTS
Alerts are generated on BUY, SELL, SHORT, and COVER signals, as well as optional LOST RELATIVE STRENGTH and LOST RELATIVE WEAKNESS
INPUTS
Use relative strength /weakness comparison with the market : trigger trades based on the ticker's strength or weakness to the selected comparison ticker (usually SPY for equities or BTCUSD for crypto)
[* ]Comparison Ticker for relative strength /weakness : Ticker to compare against for relative strength /weakness
Trade during market hours only : Take buy/sells during specified hours. Disable this for crypto trading.
[* ]Market hours (market time) : Customize market hours - defaults to 9:30 to 16:00 EST
[* ]"Only trade very strong trends" : take trades only if an established trend is very strong ( ADX over 40 ) (DEFAULT = ON)
"Limit trade direction to VWAP" : Long trades only above VWAP , shorts below (DEFAULT = ON)
"Limit trade direction to Market direction" : Long trades only if SPY (or selected comparison ticker) is up, shorts if the market is down. (DEFAULT= ON)
"Limit trades based on a ticker's green/red status for the day" : Long trades if the ticker is green for the day, shorts if red. (DEFAULT = ON)

Swing Trading SPX CorrelationThis is a long timeframe script designed to benefit from the correlation with the Percentage of stocks Above 200 moving average from SPX
At the same time with this percentage we are creating a weighted moving average to smooth its accuracy.
The rules are simple :
If the moving average is increasing its a long signal/short exit
If the moving average is decreased its a short signal/long exit.
Curently the strategy has been adapted for long only entries.
If you have any questions let me know !

[XBotUniverse] TREND 1.0 XBotUniverse is an automated crypto trading platform that allows you to start trading and investing in cryptocurrencies seamlessly, by implementing a fully automated trading bot using TradingView
The TREND Strategy version is a signal indicator following the direction of the trend with a fully technical method, without fundamentals, without the need for manual trading. Uses eleven Technical Indicators to measure trend strength. There are six breakouts and crosses to confirm open positions.
Runs well when the market is moving uptrend or downtrend. This strategy uses good risk management, where every open position takes a take profit of around 1.6% and a stop loss of around 1.3%, this is possible, because this strategy applies a "Smart Quantity", where the amount or quantity will adjust so that the profit and loss according to the calculation risk management, this will prevent your funds from being eroded
When the market is running very sideways, the strategy reduces the risk of loss by reducing open positions, by measuring the strength of the trend and measuring the shallowness of the average candle bar mixed with the "Smart Quantity" technique.
This strategy is applied to the Binance Futures Exchange, uses API Management, and can only be applied to the ETHUSDTPERP pair, so if it is used on another pair, the strategy will not work.
The main point of this platform is to reduce risk in trading digital instruments, by maintaining transactions with good risk management, namely preventing trading in a brutal way that will erode funds in an immeasurable way. Another important thing is that there is no risk of fundraising which results in funds or deposits being unable to be taken, such as in the case of forex trading robots where the biggest risk is with the broker, where our funds may not necessarily return due to non-transparent and poorly regulated mechanisms.
No business in this world can measure with certainty when the return on investment or can generate consistent profits, so also take care of the risk from our side as users, please analyze this strategy by paying attention to the strategy tester to measure NetProfit, Percent Profitable and Maximum Drawdown, from trading history that has occurred the previous month, because the results are relatively the same as what happened in real trading. Also remember that past profits do not guarantee future profits
Every business has risks, so use cold money so that we are comfortable when trading, don't use debt / borrow money, pawn money, kitchen money or hot money.
If you are interested in using this strategy for automated and real-time trading, please contact the owner of this strategy or the founders who can provide education on how to use it.

MXV trend BistroIt is so difficult for me to detect trend, maybe you.
So I need a simple trend indicator to resolve the matter
This is a trend-following indicator which condenses two simple ranges: Recommended Buy range shown with green color zone and Sell range with red color zone. To make it easy for newbies, the indicator is decorated with arrow, vertical highligted ray, buy sell signals printed on chart. When in Buy zone, do not sell. In Sell zone, do not buy
1/ When to entry and how long keeping the position?
By default, this indicator suggests that the market is trending up or down. You should make a Buy entry (up arrow) then hold long time until pivots appear, then Sell (down arrow) to exit.
2/ Which price range to entry or exit?
You should make a buy/ sell entry close to the value of recommended entry price
3/ The most appropriate time frame for this easy-to-use script is Daily
P/S
Use it for trend detect
It is very easy to use
CamPivot + Ichimoku IrvineCamPivot + Ichimoku Irvine CamPivot + Ichimoku IrvineCamPivot + Ichimoku Irvine


Crypto High Potential StrategyBTCUSD -- 5 min
BUY POSITION
1 : The price is above the EMA
2 : The Parabolic SAR is green
3 : The RSI is above the 50 line
SELL POSITION
1 : The price is bellow the EMA
2 : The Parabolic SAR is red
3 : The rsi is below the 50 line

Strategy #3 HalfTrend (Originally By everget)This Strategy Based on HalfTrend Indicator(everget)
Entry Condition : Half Trend Signal
Multi Take Profit Targets Feature with Stop Lose : Fixed Target Percentage or using ATR Multipliers
Can Modify Trading Window For Backtesting

Trend ShotBTCUSD -- 5 min or 15 min (recommended)
BUY POSITION
1 : Ema 50 must be above ema 200
2 : The macd should show a buy sign
3 : Multiple RSI should show a buy sign
4 : Multiple fast EMA should show a sign of buy
SELL POSITION
1 : Ema 50 must be below ema 200
2 : The macd should show a sell sign
3 : Multiple RSI should show a sell sign
4 : Multiple fast EMA should show a sell sign

COT + ema + aux tickerPurpose: Create a script for backtesting the idea that COT can steer weekly Bias on Forex Market.
How does it works: the script use Commercials Delta Conctract, EMA of the selected ticker, EMA of 2 auxiliary tickers (e.g. correlated ticker) to generates buy and sell signals, it allows to include or not each of these.
If you use all the indicator, The buy or sell signals are generated following that rules:
(Example for buy signals on GBPCAD)
1) Commercials add net contract to GBP futures + remove net contract to CAD
2) EMA of GBPCAD is rising
3) EMA of 1st aux ticker is rising (or decline if select inv option)
4) EMA of 2nd aux ticker is rising (or decline if select inv option)
The scripts set the stop at low of the week for long orders and high of the week for shorts.
The exit strategy is to exit at first week of profit
How could you use it:
1) Choose your FX Ticker e.g. GBPCAD and set 1W TimeFrame
2) Select ticker in the strategy setting, remember to select the currency in right order, if you want to study GBP CAD 1st currency is GBP and 2nd CAD
3) Choose if you want to use EMA (and its period of calculation)
4) Choose if you want to use a aux ticker, the direction, and the relative ema period
What could be better;
1) you can just buy on begin of the week.
2) the exit strategy isn't best you can do
3) No level of delta contract is consider, its generate a buy signial also for 1 contract in the right direction
For any question, suggestion of improvemet, ideas, insult:) write to me
It all started from a script i find here on tradingview that extract COT data. Don't remember the name of that guy but Thanks a lot.
My English isn't perfect but i hope you can understand as well.

Swing Failure Reversal StrategyThis strategy is using Swing Failure Patterns as a reversion indicator.
The strategy automatically adapts itself to the timeframe of the current chart.
Swing Failure Pattern occurs when the price trend fails to set new highs in uptrend or meet new lows in a downtrend. This pattern helps traders decide when to enter and exit the market. Usually, traders enter in the downtrend i.e. lower price highs and lower price lows, and exit in the uptrend situation i.e. higher price highs and higher price lows. Thus, traders go against the current trend. This helps the traders take advantage of early trend reversal indicators.
Types of Failure Swing :
Failure Swing Top: This occurs when the stock price goes higher whereas the RSI fails to make a higher high and falls below the recent fail point. The Fail Point is where the RSI line is below the recent swing low. This Failure Swing indicates a short position.
Failure Swing Bottom: This occurs when the stock price gets lower whereas RSI fails to make a lower low and rises over the recent fail point. Fail point is the point where the RSI line is above the recent swing high. This Failure Swing indicates a long position.

DELAYED FIBOfibo delayed and real value wave design. Burada bandlar arası dalgalanmadan faydalanılmakta.

Strategy Crypto -- double your capitalBTCUSD -- 5 min
BUY POSITION
1 : The price is above the hull suite indicator
2 : The hull suite indicator is green
3 : The volume oscillator indicator is above 0
4 : A new blue candle should appear on the QQE MOD indicator
SELL POSITION
1 : The price is bellow the hull suite indicator
2 : The hull suite indicator is red
3 : The volume oscillator indicator is above 0
4 : A new red candle should appear on the QQE MOD indicator
