Diamond-Triangle Strategy - Dynamic Trailing v3added more options of edits and lower high higher low exit logic, with .09 ema cloud rather then .1 sep for chop
Analisi trend

KD The ScalperWe have to take the trade when all three EMAs are pointing in the same direction (no criss-cross, no up/down, sideways). All 3 EMAs should be cleanly separated from each other with strong spacing between them; they are not tangled, sideways, or messy. This is our first filter before entering the trade. Are the EMAs stacked neatly, and is the price outside of the 25 EMA? If price pulls back and closes near or below the 25 or 50 EMA and breaks the 100 EMA, we don't trade. Use the 100 EMA as a safety net and refrain from trading if the price touches or falls below the 100 EMA.
1. Confirm the trend- All 3 EMAs must align, and they must spread
2. Watch price pull back to the 25th or the 50 EMA
3. Wait for the price to bounce - And re-approach the 25 EMA
Why is this powerful?
Removes 80% of the low-probability Trades
It keeps you out of choppy markets
Avoids Reversal Traps
Anchors us to momentum
We take the entry when the price moves up again and touches the 25 EMA from below, and then when it breaks above the 25 EMA, or even better, when a lovely green bullish candle forms. A bullish candle indicates good momentum. When a bullish candle closes in green, it means the momentum has increased significantly. This is when we enter a long trade, with the stop-loss just below the 50 EMA and the profit target being 1.5 times the stop-loss.
The same rule applies to the bearish trade.

Liquidity+FVG+OB Strategy (v6)How the strategy works (summary)
Entry Long when a Bullish FVG is detected (optionally requires a recent Bullish OB).
Entry Short when a Bearish FVG is detected (optionally requires a recent Bearish OB).
Stop Loss and Take Profit are placed using ATR multiples (configurable).
Position sizing is fixed contract/lot size (configurable).
You can require OB confirmation (within ob_confirm_window bars).
Alerts still exist and visuals are preserved.

Diamond-Triangle Strategy - Dynamic Trailing v2This had an adaptive exit strategy added with diamond entries not working well

Hosoda’s CloudsMany investors aim to develop trading systems with a high win rate, mistakenly associating it with substantial profits. In reality, high returns are typically achieved through greater exposure to market trends, which inevitably lowers the win rate due to increased risk and more volatile conditions.
The system I present, called “Hosoda’s Clouds” in honor of Goichi Hosoda , the creator of the Ichimoku Kinko Hyo indicator, is likely one of the first profitable systems many traders will encounter. Designed to capture trends, it performs best in markets with clear directional movements and is less suitable for range-bound markets like Forex, which often exhibit lateral price action.
This system is not recommended for low timeframes, such as minute charts, due to the random and emotionally driven nature of price movements in those periods. For a deeper exploration of this topic, I recommend reading my article “Timeframe is Everything”, which discusses the critical importance of selecting the appropriate timeframe.
I suggest testing and applying the “Hosoda’s Clouds” strategy on assets with a strong trending nature and a proven track record of performance. Ideal markets include Tesla (1-hour, 4-hour, and daily), BTC/USDT (daily), SPY (daily), and XAU/USD (daily), as these have consistently shown clear directional trends over time.
Commissions and Configuration
Commissions can be adjusted in the system’s settings to suit individual needs. For evaluating the effectiveness of “Hosoda’s Clouds,” I’ve used a standard commission of $1 per order as a baseline, though this can be modified in the code to accommodate different brokers or preferences.
The margin per trade is set to $1,000 by default, but users are encouraged to experiment with different margin settings in the configuration to match their trading style.
Rules of the “Hosoda’s Clouds” System (Bullish Strategy)
This strategy is designed to capture trending movements in bullish markets using the Ichimoku Kinko Hyo indicator. The rules are as follows:
Long Entry: A long position is triggered when the Tenkan-sen crosses above the Kijun-sen below the Ichimoku cloud, identifying potential reversals or bounces in a bearish context.
Stop Loss (SL): Placed at the low of the candle 12 bars prior to the entry candle. This setting has proven optimal in my tests, but it can be adjusted in the code based on risk tolerance.
Take Profit (TP): The position is closed when the Tenkan-sen crosses below the bottom of the Ichimoku cloud (the minimum of Senkou Span A and Senkou Span B).
Notes on the Code
margin_long=0: Ideal for strategies requiring a fixed position size, particularly useful for manual entries or testing with a constant capital allocation.
margin_long=100: Recommended for high-frequency systems where positions are closed quickly, simulating gradual growth based on realized profits and reflecting real-world broker constraints.
System Performance
The following performance metrics account for $1 per order commissions and were tested on the specified assets and timeframes:
Tesla (H1)
Trades: 148
Win Rate: 29.05%
Period: Jan 2, 2014 – Jan 6, 2020 (+172%)
Simple Annual Growth Rate: +34.3%
Trades: 130
Win Rate: 30.77%
Period: Jan 2, 2020 – Sep 24, 2025 (+858.90%)
Simple Annual Growth Rate: +150.7%
Tesla (H4)
Trades: 102
Win Rate: 32.35%
Period: Jun 29, 2010 – Sep 24, 2025 (+11,356.36%)
Simple Annual Growth Rate: +758.5%
Tesla (Daily)
Trades: 56
Win Rate: 35.71%
Period: Jun 29, 2010 – Sep 24, 2025 (+3,166.64%)
Simple Annual Growth Rate: +211.5%
BTC/USDT (Daily)
Trades: 44
Win Rate: 31.82%
Period: Sep 30, 2017 – Sep 24, 2025 (+2,592.23%)
Simple Annual Growth Rate: +324.8%
SPY (Daily)
Trades: 81
Win Rate: 37.04%
Period: Jan 23, 1993 – Sep 24, 2025 (+476.90%)
Simple Annual Growth Rate: +14.3%
XAU/USD (Daily)
Trades: 216
Win Rate: 32.87%
Period: Jan 6, 1833 – Sep 24, 2025 (+5,241.73%)
Simple Annual Growth Rate: +27.1%
SPX (Daily)
Trades: 217
Win Rate: 38.25%
Period: Feb 1, 1871 – Sep 24, 2025 (+16,791.02%)
Simple Annual Growth Rate: +108.1%
Conclusion
With the “ Hosoda’s Clouds ” strategy, I aim to showcase the potential of technical analysis to generate consistent profits in trending markets, challenging recent doubts about its effectiveness. My goal is for this system to serve as both a practical tool for traders and a source of inspiration for the trading community I deeply respect. I hope it encourages the creation of new strategies, fosters creativity in technical analysis, and empowers traders to approach the markets with confidence and discipline.

TrendIsYourFriend Strategy (SPY,IWM,VYM,XLK,SPXL,BTC,GOLD,VT...)Personal disclaimer
Don’t trust this strategy. Don’t trust any other model either just because of its author or a backtest curve. Overfitting is an easy trap, and beginners often fall into it. This script isn’t meant to impress you. It’s meant to survive reality. If it does, maybe it will raise questions and you’ll remember it.
Legal disclaimer
Educational purposes only. Not financial advice. Past performance is not indicative of future results.
Strategy description
Long-only, trend-based logic with two entry types (trend continuation or excess-move reversion), dynamic stop-losses, and a VIX filter to avoid turbulent markets.
Minimal number of parameters with enough trades to support robustness.
For backtest, each trade is sized at $10,000 flat (no compounding, to focus on raw model quality and the regularity of its results over time).
Fees = $0 (neutral choice, as brokers differ).
Slippage = $0, deliberate choice: most entries occur on higher timeframes, and some assets start their history on charts at very low prices, which would otherwise distort results.
What makes this script original
Beyond a classical trend calculation, both excess-move entries and dynamic stop-loss exits also rely on trend logic. Except for the VIX filter, everything comes from trend functions, with very few parameters.
Pre-configurations are fixed in the code, allowing sincere performance tracking across a dozen cases over the medium to long term.
Allowed
SPY (ARCA) — 2-hour chart: S&P 500 ETF, most liquid equity benchmark
IWM (ARCA) — Daily chart: Russell 2000 ETF, US small caps
VYM (ARCA) — Daily chart: Vanguard High Dividend Yield ETF
XLK (ARCA) — Daily chart: Technology Select Sector SPDR
SPXL (ARCA) — Daily chart: 3× leveraged S&P 500 ETF
BTCUSD (COINBASE) — 4-hour chart: Bitcoin vs USD
GOLD (TVC) — Daily chart: Gold spot price
VT (ARCA) — Daily chart: Vanguard Total World Stock ETF
PG (NYSE) — Daily chart: Procter & Gamble Co.
CQQQ (ARCA) — Daily chart: Invesco China Technology ETF
EWC (ARCA) — Daily chart: iShares MSCI Canada ETF
EWJ (ARCA) — Daily chart: iShares MSCI Japan ETF
How to use and form an opinion on it
Works only on the pairs above.
Feel free to modify the input parameters (slippage, fees, order size, margins, …) to see how the model behaves under your own conditions
Compare it with a simple Buy & Hold (requires an order size of 100% equity).
You may also want to look at its time-in-market — the share of time your capital is actually at risk.
Finally, let me INSIST on this : let it run live for months before forming an opinion!
Share your thoughts in the comments 🚀 if you’d like to discuss its live performance.

💎🔺⚫ Diamond-Triangle-Circle StrategyUpgrade the high low low high strat to cut out signal noise and flat markets dont take the black circles they eat profits

TradeMastersAlgoOur strategy is a long only algorithm that has produced repeatable positive results in both back testing and live testing. The code is our proprietary IP. Users may have a 30 free trial to experiment with our strategy.
Results are not guaranteed.
This strategy was created for automated day trading a fully funded margin account. Please exercise caution and discipline when using any strategy. We've had the most positive results with heavy diversification (40 tickers trading 5% equity each).
Ticker selection, timeframe, and chart type ( we use standard candles ) are up to the user.
We encourage you to keep your own method to your self to prevent the dilution of your strategy.
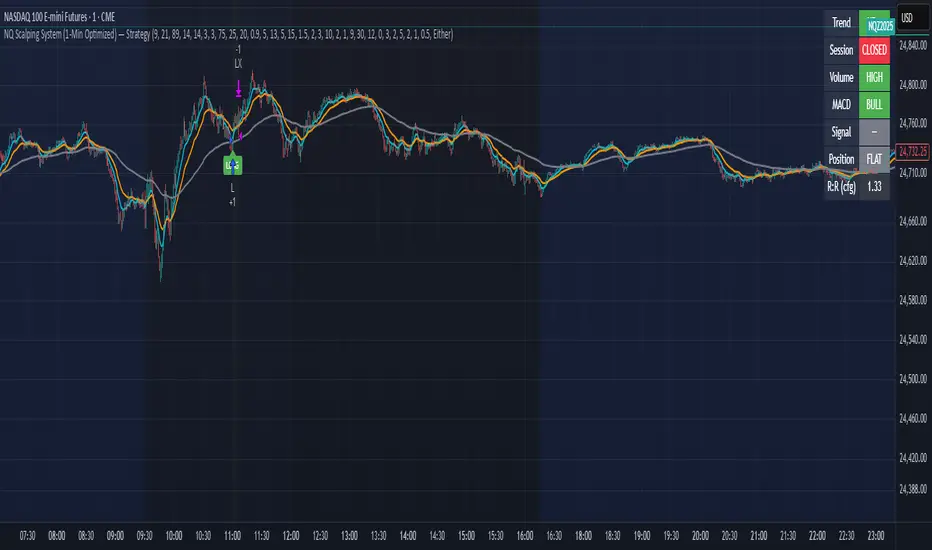
NQ Scalping System (1-Min Optimized) — StrategyNQ Scalping System — What this does (in plain English)
You’re buying pullbacks in an uptrend and selling pullbacks in a downtrend.
Trend = EMA89. Entries lean on EMA8/EMA21 touches + a StochRSI reset & cross so you’re not chasing candles. Optional Volume and MACD filters keep you out of weak moves. A time window avoids dead markets and the first noisy minute.
Long setup
Price above EMA89 (trend up)
Price pulls back to EMA8 (or EMA21 if fallback is on) by at least your Min Pullback (NQ points)
StochRSI resets to oversold and %K crosses up %D
(Optional) Volume thrust and MACD momentum confirm
Within your session window
Short = mirror image.
Exits you control
Stop/Target: ATR-based (adaptive) or fixed scalp points
Trailing stop: only arms after price moves your way by X points, then trails by your offset
Early exit options: StochRSI fade, EMA break, trend break, or opposite divergence
Quick scalp: grab a few points or bail after X bars if nothing happens
Reality check
This is a rules → orders system. It will not match eyeballed indicator labels. Fills, gaps, and trail behavior are real. That’s the point.
How I’d run it (defaults that won’t waste your time)
Use ATR stops/targets by default
EMA21 fallback = ON (you’ll miss fewer good pullbacks)
MACD filter = ON when choppy; OFF when trends are clean
Volume multiplier: start modest, bump it up if you get chopped
Session: keep RTH (e.g., 09:30–15:45 ET) and skip the first minute
Quick presets for higher timeframes
Use these as starting points and then nudge to taste.
5-Minute (intraday swings)
OB/OS: 80 / 20
Volume Multiplier: 1.3
MACD: 8 / 21 / 5
ATR Stop× / Target×: 1.8–2.2 / 2.5–3.0
Min Pullback: 1.0–1.5 pts
Quick Scalp: 6–10 pts, Bars: 12–20
Trailing: Activation 6–8 pts, Offset 3–4 pts
Divergence: Hidden ON, MTF OFF
15-Minute (session legs)
OB/OS: 85 / 15
Volume Multiplier: 1.4
MACD: 8 / 21 / 5
ATR Stop× / Target×: 2.0–2.5 / 3.0–4.0
Min Pullback: 1.5–2.5 pts
Quick Scalp: 12–18 pts, Bars: 16–30
Trailing: Activation 10–14 pts, Offset 5–6 pts
Divergence: Hidden ON, MTF ON (LTF = 5m)
30-Minute (bigger intraday trends)
OB/OS: 88 / 12
Volume Multiplier: 1.5
MACD: 12 / 26 / 9 (or 8 / 21 / 5 if you want faster)
ATR Stop× / Target×: 2.2–2.8 / 3.5–5.0
Min Pullback: 2.5–4.0 pts
Quick Scalp: 18–28 pts, Bars: 20–40
Trailing: Activation 16–24 pts, Offset 6–8 pts
Divergence: Hidden ON, MTF ON (LTF = 5m or 15m)
1-Hour (multi-hour swings)
OB/OS: 90 / 10
Volume Multiplier: 1.6–1.8
MACD: 12 / 26 / 9
ATR Stop× / Target×: 2.5–3.5 / 4.0–6.0
Min Pullback: 4–7 pts
Quick Scalp: 30–50 pts, Bars: 24–60
Trailing: Activation 28–40 pts, Offset 10–15 pts
Divergence: Hidden ON, MTF ON (LTF = 15m)
Tuning tips (read this)
Getting chopped? Raise Min Pullback, raise Volume Multiplier, leave MACD ON, and narrow your session.
Missing moves? Turn EMA21 fallback ON, lower Volume Multiplier, relax OB/OS (e.g., 75/25 on 5m).
Flat days? Use Quick Scalp and a tighter Trail Activation to lock gains.
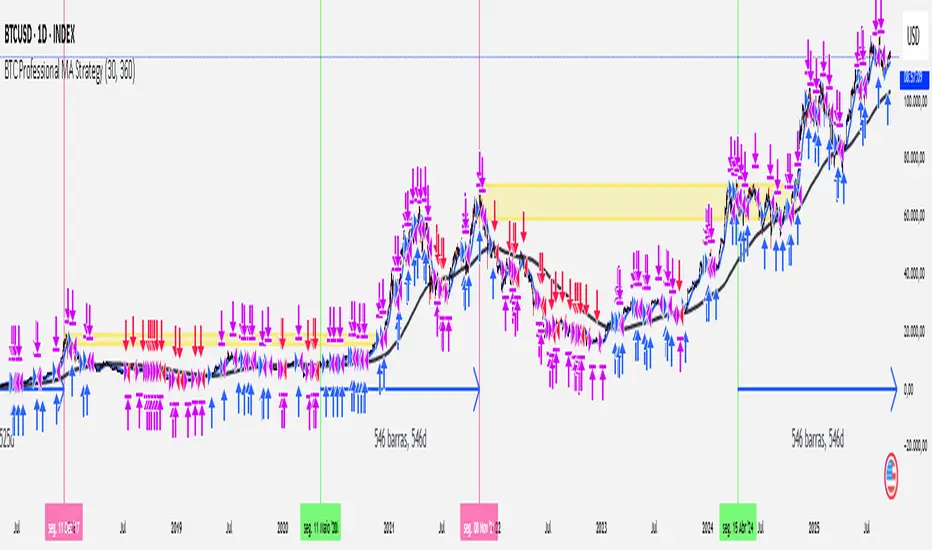
[Outperforms Bitcoin Since 2011] Professional MA StrategyThis Strategy OUTPEFORMS Bitcoin since 2011.
Timeframe: Daily
MA used (Fast and Slow): WMA (Weighted Moving Average)
Fast MA Length: 30 days (Reflects the Monthly Trend - Short Term Perspective)
Slow MA Length: 360 days (Reflects the Annual Trend - Long Term Perspective)
Position Size: 100% of equity
Margin for Long = 10% of equity
Margin for Short = 10% of equity
Open Long = Typical Price Crosses Above its Fast MA and Price is above its Slow MA
Open Short = Typical Price Crosses Below its Fast MA and Price is below its Slow MA
Close Long = Typical Price Crosses Below its Fast MA
Close Short = Typical Price Crosses Below its Fast MA
note: Typical Price = (high + low + close) / 3
Weekend Hunter Ultimate v6.2 Weekend Hunter Ultimate v6.2 - Automated Crypto Weekend Trading System
OVERVIEW:
Specialized trading strategy designed for cryptocurrency weekend markets (Saturday-Sunday) when institutional traders are typically offline and market dynamics differ significantly from weekdays. Optimized for 15-minute timeframe execution with multi-timeframe confluence analysis.
KEY FEATURES:
- Weekend-Only Trading: Automatically activates during configurable weekend hours
- Dynamic Leverage: 5-20x leverage adjusted based on market safety and signal confidence
- Multi-Timeframe Analysis: Combines 4H trend, 1H momentum, and 15M execution
- 10 Pre-configured Crypto Pairs: BTC, ETH, LINK, XRP, DOGE, SOL, AVAX, PEPE, TON, POL
- Position & Risk Management: Max 4 concurrent positions, -30% account protection
- Smart Trailing Stops: Protects profits when approaching targets
RISK MANAGEMENT:
- Maximum daily loss: 5% (configurable)
- Maximum weekend loss: 15% (configurable)
- Per-position risk: Capped at 120-156 USDT
- Emergency stops for flash crashes (8% moves)
- Consecutive loss protection (4 losses = pause)
TECHNICAL INDICATORS:
- CVD (Cumulative Volume Delta) divergence detection
- ATR-based dynamic stop loss and take profit
- RSI, MACD, Bollinger Bands confluence
- Volume surge confirmation (1.5x average)
- Weekend liquidity adjustments
INTEGRATION:
- Designed for Bybit Futures (0.075% taker fee)
- WunderTrading webhook compatibility via JSON alerts
- Minimum position size: 120 USDT (Bybit requirement)
- Initial capital: $500 recommended
TARGET METRICS:
- Win rate target: 65%
- Average win: 5.5%
- Average loss: 1.8%
- Risk-reward ratio: ~3:1
IMPORTANT DISCLAIMERS:
- Past performance does not guarantee future results
- Leveraged trading carries substantial risk of loss
- Weekend crypto markets have 13% of normal liquidity
- Not suitable for traders who cannot afford to lose their entire investment
- Requires continuous monitoring and adjustment
USAGE:
1. Apply to 15-minute charts only
2. Configure weekend hours for your timezone
3. Set up webhook alerts for automation
4. Monitor performance table in top-right corner
5. Adjust parameters based on your risk tolerance
This is an experimental strategy for educational purposes. Always test with small amounts first and never invest more than you can afford to lose completely.


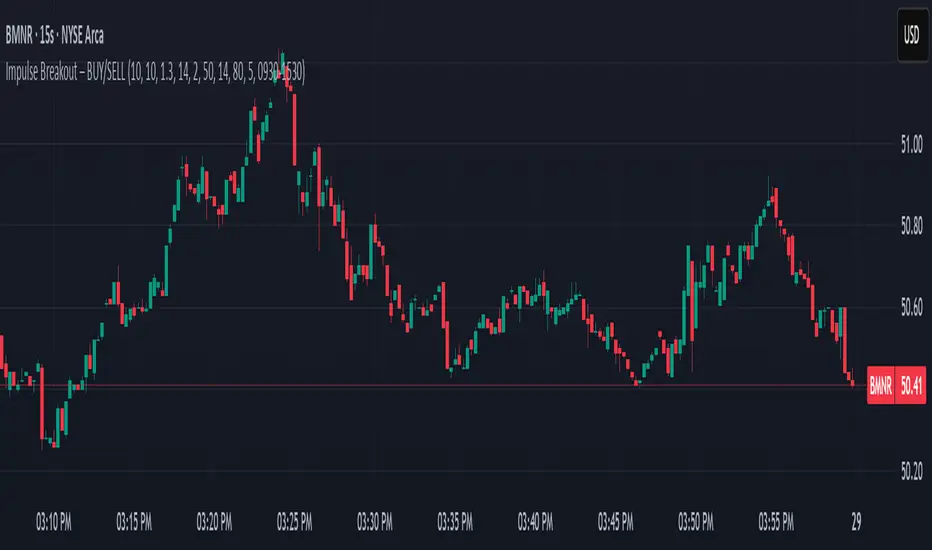
EMA Crossover Cloud w/Range-Bound FilterA focused 1-minute EMA crossover trading strategy designed to identify high-probability momentum trades while filtering out low-volatility consolidation periods that typically result in whipsaw losses. Features intelligent range-bound detection and progressive market attention alerts to help traders manage focus and avoid overtrading during unfavorable conditions.
Key Features:
EMA Crossover Signals: 10/20 EMA crossovers with volume surge confirmation (1.3x 20-bar average)
Range-Bound Filter: Automatically detects when price is consolidating in tight ranges (0.5% threshold) and blocks trading signals during these periods
Progressive Consolidation Stages: Visual alerts progress through Range Bound (red) → Coiling (yellow) → Loading (orange) → Trending (green) to indicate market compression and potential breakout timing
Market Attention Gauge: Helps manage focus between active trading and other activities with states: Active (watch close), Building (check frequently), Quiet (check occasionally), Dead (handle other business)
Smart RSI Exits: Cloud-based and RSI extreme level exits with conservative stop losses
Dual Mode Operation: Separate settings allow full backtesting performance while providing visual stay-out warnings for manual trading
How to Use:
Entry Signals: Trade aqua up-triangles (long) and orange down-triangles (short) when they appear with volume confirmation
Stay-Out Warnings: Ignore gray "RANGE" triangles - these indicate crossovers during range-bound periods that should be avoided
Monitor Top-Right Display:
Range: Current 60-bar dollar range
Attention: Market activity level for focus management
Status: Consolidation stage (trade green/yellow, avoid red, prepare for orange)
Position Sizing: Default 167 shares per signal, optimized for the crossover frequency
Alerts: Enable consolidation stage alerts and market attention alerts for automated notifications
Recommended Settings:
Timeframe: 1-minute charts
Symbol: Optimized for volatile stocks like TSLA
"Apply Filter to Backtest": Keep OFF for realistic backtesting, ON to see filtered results
Risk Management:
The strategy includes built-in overtrading protection by identifying and blocking trades during low-volatility periods. The progressive consolidation alerts help identify when markets are "loading" for significant moves, allowing traders to position appropriately for higher-probability setups.
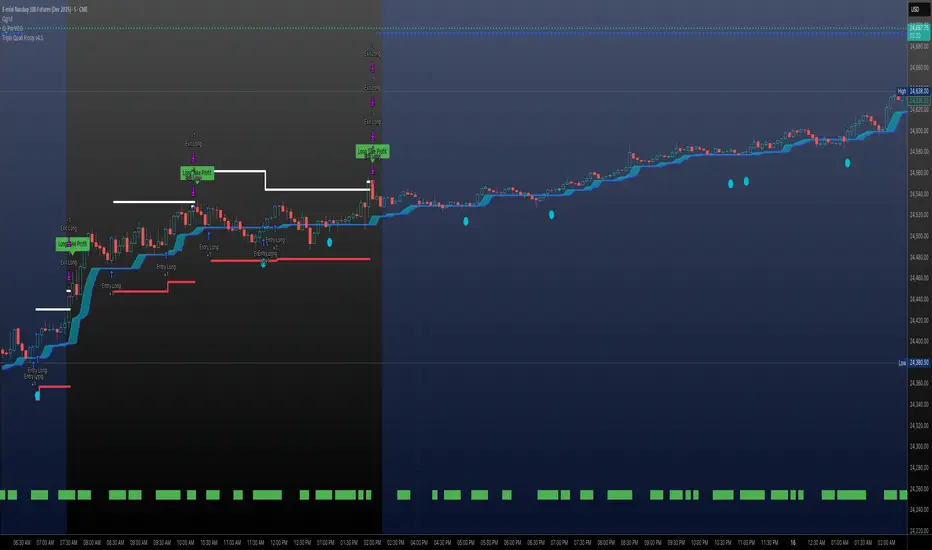
Triple Quad Frosty v4.5Triple Quad Frosty v4.5 is a Renko-friendly strategy that lets you trade from up to four signal sources per side. Orders are only placed when your chosen conditional filters (A/B/C) agree, giving you full control over when entries are valid. You decide how signals must line up — from simple single-source triggers to majority or full agreement across all four.
Renko-based, with customizable static stops, take profits, and trailing stops. Time/day filters, daily trade limits, and forced closures let you restrict trading to specific windows.
The HTF filters in Triple Quad Frosty v4.5 use a higher-timeframe Hull Moving Average (HMA) to confirm trend direction, while slope and distance settings on the local HMA help filter out weak or choppy setups. Longs only trigger when price is above the HTF HMA and meets slope/distance requirements, and shorts only when the opposite is true.
Color-coded labels mark each exit as a win or loss, with reversal trades labeled separately for clarity. Conditional bars plotted above and below the chart show when the A/B/C filters align on a long or short bias, giving clear visual confirmation of entry conditions. Stop loss and take profit levels are plotted directly on the chart with guide lines, so you can easily track active trade management in real time.
DMI Toolbox StrategyThe Directional Movement Index (DMI) was originally developed by J. Welles Wilder Jr. in 1978. Wilder introduced the DMI along with the Average Directional Index (ADX) in his book, “New Concepts in Technical Trading Systems,” which became a foundational reference for technical analysis.
The indicator can offer a myriad of signals for building a trading strategy. In an effort to provide the user with a meaningful way to evaluate these signals, this DMI Toolbox Strategy offers the chance to back-test various combinations and permutations of DMI signals on long trades. By default it will open a long position on the +DI (upward movement) crossing above the -DI (downward movement). By default, It exits long positions when the ADX (trend strength) reverses.
Suggested Use
Try a wide variety of long entry and exit signals across many different timeframes to see what is most effective for the item you wish to trade. There is a table in the upper right corner that will give a quick view of which signal is dominant across 5 timeframes, based on your current settings. Adjust the pyramidding, slippage, and commission values to more closely match your situation.
Visual Helpers
The DMI indicator has been altered to include a smoothed version of the ADX, as well as a colored background to show which signal is dominant (+DI or -DI). Small up arrows call your attention to ADX crossovers that may indicate a significant threshold in trend strength.

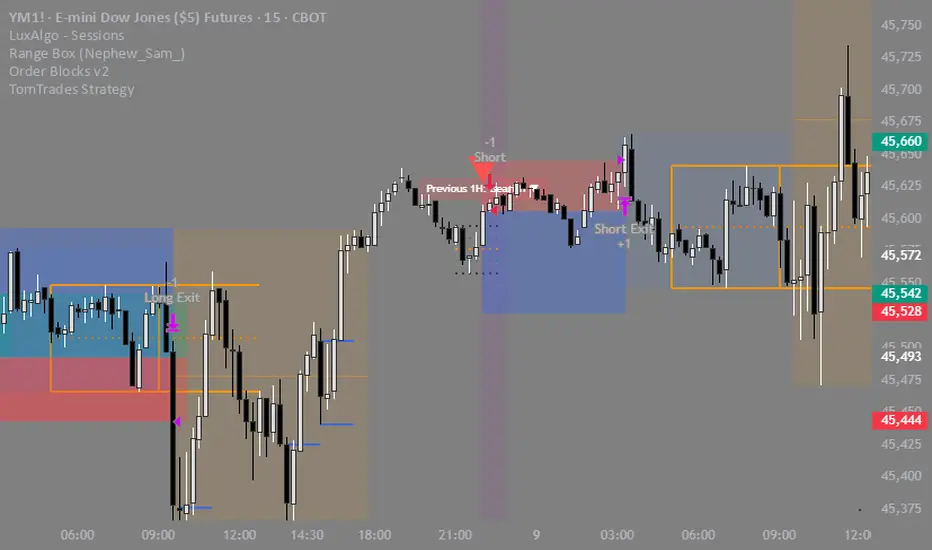
Trendline Breakout Strategy [KedArc Quant] Description
A single, rule-based system that builds two trendlines from confirmed swing pivots and trades their breakouts, with optional retest, trend-regime gates (EMA / HTF EMA), and ATR-based risk. All parts serve one decision flow: structure → breakout → gated entry → managed risk.
What it does (for traders)
Draws Up line (teal) through the last two Higher Lows and Down line (red) through the last two Lower Highs, then extends them forward.
Long when price breaks above red; Short when price breaks below teal.
Optional Retest entry: after a break, wait for a pullback toward the broken line within an ATR-scaled buffer.
Uses ATR stop and R-multiple target so risk is consistent across symbols/timeframes.
Labels HL1/HL2/LH1/LH2 so non-coders can verify which pivots built each line.
Why these components are combined
Pure breakout systems on trendlines suffer from three practical issues:
False breaks in chop → solved by trend-regime gates (EMA / HTF EMA) that only allow trades aligned with the prevailing trend.
Uneven volatility across markets/timeframes → solved by ATR-based stop/target, normalizing distance so R-multiples are comparable.
First break whipsaws near wedge apices → mitigated by the optional retest rule that demands a pullback/hold before entry.
These modules are not separate indicators with their own signals. They are support roles inside one method.
The pivot engine defines structure, the breakout detector defines signal, the regime gates decide if we’re allowed to take that signal, and the ATR module sizes risk.
Together they make the trendline breakout usable, testable, and explainable.
How it works (mechanism; each component explained)
1) Pivot engine (structure, non-repainting)
Swings are confirmed with ta.pivotlow/high(L, R). A pivot only exists after R bars (no look-ahead), so once plotted, the line built from those pivots will not repaint.
2) Trendline builder (geometry)
Teal line updates when two consecutive pivot lows satisfy HL2.price > HL1.price (and HL2 occurs after HL1).
Red line updates when two consecutive pivot highs satisfy LH2.price < LH1.price.
Lines are extended right and their current value is read every bar via line.get_price().
3) Breakout detector (signal)
On every bar, compute:
crossover(close, redLine) ⇒ Long breakout
crossunder(close, tealLine) ⇒ Short breakdown
4) Regime gates (trend filters, not separate signals)
EMA gate: allow longs only if close > EMA(len), shorts only if close < EMA(len).
HTF EMA gate (optional): same rule on a higher timeframe to avoid fighting the larger trend.
These do not create entries; they simply permit or block the breakout signal.
5) Retest module (optional confirmation)
After a breakout, record the line price. A valid retest occurs if price pulls back within an ATR-scaled buffer toward that broken line and then closes back in the breakout direction.
This reduces first-tick fakeouts.
6) Risk module (position exit)
Initial stop = ATR(len) × atrMult from entry.
Target = tpR × (ATR × atrMult) (e.g., 2R).
This keeps results consistent across instruments/timeframes.
Entries & exits
Long entry
Base: close breaks above red and passes EMA/HTF gates.
Retest (if enabled): after the break, price pulls back near the broken red line (within the ATR buffer) and holds; then enter.
Short entry
Mirror logic with teal (break below & gates), optionally with a retest.
Exit
strategy.exit places ATR stop & R-multiple target automatically.
Optional “flip”: close if the opposite base signal triggers.
How to use it (step-by-step)
Timeframe: 1–15m for intraday, 1–4h for swing.
Start defaults: Pivot L/R = 5, EMA len = 200, ATR len = 14, ATR mult = 2, TP = 2R, Retest = ON.
Tune sensitivity:
Faster lines (more trades): set L/R = 3–4.
Fewer counter-trend trades: enable HTF EMA (e.g., 60-min or Daily).
Visual audit: labels HL1/HL2 & LH1/LH2 show which pivots built each line—verify by eye.
Alerts: use Long breakout, Short breakdown, and Retest alerts to automate.
Originality (why it merits publication)
Trades the visualization: many “auto-trendline” tools only draw lines; this one turns them into testable, alertable rules.
Integrated design: each component has a defined role in the same pipeline—no unrelated indicators bolted together.
Transparent & non-repainting: pivot confirmation removes look-ahead; labels let non-coders understand the setup that produced each signal.
Notes & limitations
Lines update only after pivot confirmation; that lag is intentional to avoid repainting.
Breakouts near an apex can whipsaw; prefer Retest and/or HTF gate in choppy regimes.
Backtests are idealized; forward-test and size risk appropriately.
⚠️ Disclaimer
This script is provided for educational purposes only.
Past performance does not guarantee future results.
Trading involves risk, and users should exercise caution and use proper risk management when applying this strategy.

Trend Following S/R Fibonacci StrategyTrend Following S/R Fibonacci Strategy
Trend Following S/R Fibonacci Strategy


Structure Strategycreated to spot key area needed to take valid trades in most market conditions. use beside RSI MACD

Siege Gold Strategy-1m
Siege Gold Strategy - An Advanced Trading Strategy with a Multi-Confirmation System
This powerful indicator is designed to help you base your trading decisions on solid foundations. Thanks to its advanced algorithms and multi-confirmation mechanism, it helps you understand market trends more clearly.
Key Features
Trend Pivot Points: Instantly identify trend reversals and potential support/resistance levels with intelligent pivot points that react to real-time price movements. This allows you to analyze the trend's strength and direction more accurately.
Relative Strength Index (RSI) Integration: We combine the classic overbought/oversold signals of the RSI with our custom strategies to generate more reliable and filtered signals. This integration minimizes false signals.
"Range" Module: This feature measures the volatility range the price is currently in, showing whether the market is consolidating or moving. This helps reduce the risk of making incorrect trades in sideways markets.
Who Is This For?
Traders who follow trend-following strategies.
Anyone who wants to automatically determine support and resistance levels.
Those looking for a multi-confirmation mechanism instead of relying on a single indicator.
Anyone who wants to generate more reliable trading signals.
This strategy can be used in the XAUUSD pair, as well as in crypto and forex markets. To use this strategy more accurately, we encourage you to watch a few videos. It's important to remember that every instrument and indicator setting yields different results, and we cannot guarantee that you will make a profit.

MOONA130925-2305bThe Martingale strategy in crypto trading involves doubling trade size after each loss, aiming to recover losses with one win and secure a small profit. While potentially effective short-term, it carries high risk, as consecutive losses can rapidly exhaust capital, making it unsustainable without strict risk management.
Use Below Settings for Best Results.
5Min or 15 Min
EMA 20
EMA 45
EMA 200
Keep Enable EMA on Entry- ON
Length 1- 45
Length 2- 200
Set Target 3% (Untick all Except T1)
Set SL 1.5%
