Trend Break Targets [MarkitTick]Trend Break Targets
Trend Break Targets is a technical analysis tool designed to assist traders in identifying trendline breakouts and projecting potential price targets based on market geometry. Unlike fully automated indicators that guess trendlines, this tool provides you with precise control by allowing you to manually Pivot Point the trendline to specific points in time, while automating the complex math of target projection and structure mapping.
Theoretical Basis & Concepts
This indicator is grounded in classic technical analysis principles found in foundational trading literature. It automates the following methodology:
Drawing a trend line between two key points to represent dynamic support or resistance.
Identifying a breakout when the price closes above or below this line, potentially signaling a change in trend.
Calculating a price target by measuring the vertical distance between the breakout line and the last high/low (pivot), then projecting that same distance in the direction of the breakout.
This concept is based on methods and "Measured Move" theories explained in classic books such as "Technical Analysis of Stock Trends" by Edwards & Magee, "Technical Analysis of the Financial Markets" by John Murphy, and in Thomas Bulkowski's Price Pattern Studies.
How It Works
Pivot Pointed Trendline Construction The script draws a trendline between two user-defined points in time (Start Date and End Date). It calculates the slope between these points and extends the line infinitely to the right, allowing you to define the exact structure (e.g., a resistance trendline on a wedge).
Breakout Detection The script monitors the "Price Source" (High, Low, or Close) relative to the extended trendline.
A Bullish Breakout (BC) occurs when the Close crosses above a bearish trendline.
A Bearish Breakout (BC) occurs when the Close crosses below a bullish trendline.
Dynamic Target Projection (The Math) Upon a confirmed breakout, the script automatically calculates three distinct targets by identifying the most significant "Swing Point" (Pivot) prior to the breakout.
Distance (D): The vertical distance between the Trendline and the Pivot Price at the specific bar where the pivot occurred.
Target 1 (T1): The Breakout Price +/- (Distance × 1.0). This represents a classic 1:1 measured move.
Target 2 (T2): The Breakout Price +/- (Distance × 1.618). Based on the Golden Ratio extension.
Target 3 (T3): The Breakout Price +/- (Distance × 2.618).
Market Structure (CHOCH) The script includes an optional Change of Character (CHOCH) module. This runs independently of the trendline logic, identifying local Swing Highs and Swing Lows based on the "Swing Detection Length." It plots dashed lines and labels to visualize immediate shifts in market structure.
How to Use This Tool
This is an interactive tool that requires user input to define the setup.
Identify a Setup: Locate a clear trend, wedge, or flag pattern on your chart.
Set Pivot Points: Go to the Indicator Settings. Input the exact Start Date and End Date corresponding to the two main touches of your trendline.
Monitor for Breakout: The script will extend the line. Wait for a "BC" label to appear.
Trade Management: Once "BC" prints, the T1, T2, and T3 lines will instantly render. These can be used as potential take-profit zones or areas to tighten stop-losses.
Settings & Configuration
Indicator Settings
Start/End Date: The timestamp Pivot Points for your trendline.
Price Source: Determines what price (High or Low) Pivot Points the line and triggers the breakout.
Pivot Left/Right: Adjusts the sensitivity for finding the "Pivot Before Break" used for target calculations.
Extend Target Line: How far forward the target lines are drawn.
Visual Style
Colors: Fully customizable colors for the Trendline, Breakout Labels, and each Target level (T1, T2, T3).
Gold Bullish Reversal
This analysis dissects a confirmed bullish reversal on Gold using a custom Trend Break system. The setup identifies a transition from a bearish corrective phase to bullish momentum, validated by a structural break and a geometric target projection.
Trend Identification (The Pivot Points) The descending white trendline serves as the primary dynamic resistance, defining the bearish correction.
Pivot Points: The line is drawn connecting two significant swing highs, marked by Label 1 and Label 2.
Logic: These points represent the "lower highs" characteristic of the previous downtrend. As long as price remained below this trajectory, the bearish bias was intact.
The Trigger: Breakout & Confirmation The transition occurs at the candle marked BC (Breakout Candle).
Breakout Criteria: The indicator logic dictates that a signal is only valid when the bar closes above the trendline. This filters out intraday wicks and ensures genuine buyer commitment.
CHOCH Confluence: Immediately following the breakout, a CHOCH (Change of Character) label appears. This signals a shift in market structure, indicating that the internal lower-high/lower-low sequence has been violated, adding probability to the reversal.
Target Projection: The Measured Move The vertical green lines (T1, T2) represent profit objectives derived from the depth of the prior move. The logic calculates the distance between the breakout line and the lowest pivot prior to the break.
T1 (Standard Target): This is a 1:1 projection of the pre-breakout volatility. We see price action initially stalling near this level, confirming it as a zone of interest.
T2 (Golden Ratio Extension): The second target is calculated as the initial distance multiplied by 1.618 (Fibonacci Golden Ratio). The chart shows the price rallying aggressively through T1 to tap the T2 zone, often considered an exhaustion or major take-profit level in harmonic extensions.
Conclusion Gold has successfully invalidated the 4-hour bearish trendline. The confluence of a confirmed close above resistance (BC) and a structural shift (CHOCH) provided a high-probability long setup. The price has now fulfilled the T2 (1.618) extension, suggesting traders should watch for consolidation or a reaction at this key Fibonacci resistance level.
Bearish Trendline Breakdown
The image displays a Bearish Trendline Breakdown on the Gold (XAUUSD) 4-hour chart. The indicator is actually functioning in "Low" mode here (connecting swing lows to form support), which triggers the bearish logic found in the code. Here is the step-by-step breakdown:
The Setup: Pivot Points & Trendline
Visual: The Blue Labels "1" and "2" connected by a white diagonal line.
Code Logic: These are the user-defined start and end points.
Pivot Point 1 (startDate): The starting pivot of the trendline.
Pivot Point 2 (endDate): The ending pivot.
Trendline: The code draws a line between these two points and extends it to the right (extend.right). In this specific image, the line acts as a Support Trendline.
The Trigger: Break Candle (BC)
Visual: The Red Label "BC" appearing just below the white trendline.
Code Logic: This is the execution signal. The code detects a "Down Break" (dnBreak) because the Price Source was likely set to "Low" and the candle's Close was lower than the Trendline Price at that specific bar (close < currLinePrice). This confirms the support level has been breached.
The Projection: Targets (T1 & T2)
Visual: The Green Labels "T1" and "T2" with dotted horizontal lines projected downward.
Code Logic: These are profit targets based on a "Measured Move."
Pivot Calculation: The script looks back for a recent "Pivot High" (the peak before the crash) to calculate the volatility/distance (dist) between that peak and the trendline.
T1 (Conservative): The price is projected downward by 1x that distance (currLinePrice - dist).
T2 (Extended): The price is projected downward by 1.618x that distance (Golden Ratio extension).
Market Context: CHOCH
Visual: The small Red/Orange "CHOCH" labels appearing above the price action.
Code Logic: This is a secondary confirmation system running independently of the trendline. It detects a Change of Character (structural shift). The red labels indicate a "Bearish CHOCH," meaning the price broke below a significant prior swing low (last_swing_low). This supports the bearish bias of the trendline break.
Disclaimer This tool is for educational and technical analysis purposes only. Breakouts can fail (fake-outs), and past geometric patterns do not guarantee future price action. Always manage risk and use this tool in conjunction with other forms of analysis.
Trendbreakout

Advanced Trend Break TargetsIntroduction
The Advanced Trend Break Targets (ATBT) is a semi-automated technical analysis system designed to validate trendline trading strategies with algorithmic precision. While standard trendlines are subjective drawings, the ATBT converts user-defined price structures into a mathematical model. It projects a trajectory based on two specific "Anchor Points" and monitors price action for valid breakouts, applying a strict "Confluence Filter" before generating signals or projecting targets.
Originality & Utility
Most trendline indicators rely on automatic detection, which often draws lines across irrelevant swing points. The ATBT respects the trader's discretion by allowing manual placement of the trendline (via timestamps) while automating the tedious tasks of monitoring for breaks, checking momentum conditions, and calculating Fibonacci risk-to-reward levels. This "Hybrid" approach combines human pattern recognition with machine discipline, ensuring trades are only signaled when specific quantitative conditions are met.
Detailed Methodology
1. The Advanced Projection Logic
The core of the script calculates a linear trajectory between two points in time (Start Date and End Date). Unlike standard drawings, this script calculates the exact slope (m) using the bar index difference
The script automatically detects the "Price Source" at your chosen timestamps. If a Pivot High exists at the start date, it defaults to a Resistance Line (Highs). If a Pivot Low exists, it defaults to a Support Line (Lows). This slope is then projected forward indefinitely:
2. The Confluence Filter (Multi-Condition Validation)
A raw price crossover is often a "fake-out." To combat this, the script includes a Mandatory Conditions engine. A breakout is only confirmed if the user-selected conditions are TRUE at the moment of the cross:
Volume Confirmation: Verifies if the breakout bar's volume is greater than its 20-period SMA.
CHOCH (Change of Character): Checks if the price has broken the most recent Swing High (for bullish setups) or Swing Low (for bearish setups) prior to the trendline break.
Swing Break: A strict check requiring the close to be beyond the last swing point.
Momentum (MACD & RSI): Ensures the MACD line is crossing the Signal line or that RSI is on the correct side of the 50 threshold.
Trend Filter (SMA): Verifies that price is above the 20 SMA (bullish) or below it (bearish).
3. Dynamic Target & Risk Calculation
Upon a validated breakout, the script scans the chart history for the most recent Pivot High or Low (within the lookback period) to define the "Structure Width" or Risk distance (D).
Stop Loss (SL): Placed at the recent Pivot Price.
Target 1: Projected at $1.0 \times D from the breakout point.
Target 2: Projected at $1.618 \times D (Golden Ratio).
Target 3: Projected at $2.618 \times D.
How to Use
1. Identify the Structure: visually identify a trendline on your chart (e.g., the upper resistance of a Wedge or Flag).
2. Set Anchors: Go to the script settings (Inputs tab) and enter the exact timestamp for Point 1 (Start of trendline) and Point 2 (End of trendline).
Tip: Ensure these dates align with the specific high/low candle you want to anchor to.
3. Configure Filters: Toggle the checkboxes in the "Mandatory Conditions" group.
Example: If you want to trade pure price action, enable "Require CHOCH" but leave "Require MACD" unchecked.
4. Interpret Signals:
Blue Labels (1 & 2): Indicate where the script has Advanced the trendline.
"Breakout" / "Breakdown" Label: Appears when price crosses the projected line AND all selected conditions are met.
Green/Red Dotted Lines: represent your Take Profit targets based on the structure width.
Inputs & Settings
TBT Group:
Start/End Date: The timestamps defining the line.
Pivot Left/Right: Controls the sensitivity of the pivot detection used for Stop Loss placement.
Extend Target Line: How far into the future the target lines are drawn.
Mandatory Conditions Group:
Require Volume / CHOCH / MACD / SMA / RSI: Individual toggles to build your specific trade strategy.
Thresholds: Adjust the lengths for SMA and RSI to match your preferred timeframe.
Example:
XAUUSD 4-hour timeframe
We had an uptrend. We added the indicator and set the point at the penultimate low (HL) and then the second point at the last low (HL), as shown in the following image.
You can choose the conditions you prefer to be met to trigger the breakout from the user settings.
Based on the conditions you set, if they are met, the indicator displays all the data, as seen in the following image. A stop-loss point was set, the breakout candle was identified, and the first target was set (you can choose to display the second and third targets from the user settings, noting that they are less likely to be achieved).
As we can see in the last image, the price reached the first target, then continued its path and achieved the second target as well. Afterward, it shifted to a short sideways trend and then reversed.
TBT vs. ATBT: Key Technical & Functional Enhancements
The ATBT (Advanced Trend Break Target) script introduces significant upgrades over the Free TBT, transforming it from a pure geometric breakout tool into a comprehensive strategy scanner with multi-factor confluence capabilities. Below are the primary differences:
1. Integration of Confluence Filters ("Mandatory Conditions")
The most substantial change is the addition of a robust filtering engine. While TBT relied solely on price crossing the trendline to trigger a signal, ATBT introduces a "Mandatory Conditions" input group. Traders can now require specific criteria to be met before a breakout is validated:
Volume Confirmation: Requires volume to exceed its SMA.
Market Structure (CHOCH): Can require a Change of Character to have occurred prior to the entry.
Momentum & Trend Filters: Options to enforce confirmation from MACD (crossovers), RSI (thresholds), and SMA (price location relative to the moving average).
2. Automated Risk Management (Stop-Loss)
ATBT adds a built-in Stop-Loss mechanism, addressing a missing feature in TBT.
TBT: Only projected Profit Targets (T1, T2, T3).
ATBT: Automatically calculates and plots a Stop-Loss (SL) level based on the pivot price used for the setup. This provides an immediate Risk/Reward visualization upon signal generation.
3. Smart Source Detection
ATBT improves user experience with an automation feature regarding the "Price Source" (High vs. Low).
TBT: The user must manually select whether they are anchoring to "High" or "Low" via the settings.
ATBT: The script attempts to automatically detect the correct source at the "Start Date" by checking if a pivot high or low exists at that timestamp, reducing manual configuration errors.
4. Enhanced Visuals & Swing Point Tracking
Visual clarity has been upgraded in the new version.
Swing Points: ATBT includes a `showSwingPoints` toggle that plots visual markers (circles) on Swing Highs and Swing Lows, helping traders visualize the market structure used for CHOCH and pivot calculations , Helping the trader identify the locations of the first and second points .
Signal State Tracking: ATBT uses "latched" logic (e.g., `chochMet`, `swingBrkMet`) to track if conditions were met anytime between Point 2 and the breakout, whereas TBT treated CHOCH largely as a separate visual component unrelated to the main trigger.
5. Refined Signal Logic
TBT: Triggers immediately upon a close across the trendline.
ATBT: Triggers only if the trendline cross occurs AND all enabled "Mandatory Conditions" return true. This significantly reduces noise by filtering out low-quality breakouts that lack structural or momentum support
Disclaimer
This script is a tool for visualizing market structure and calculating potential geometries. It does not guarantee future performance. Breakouts can fail, and "Mandatory Conditions" are lagging indicators that confirm past data. Always manage risk responsibly.

Block-Based Trend Breakout (UTB/DTB) & S/R ZonesThis indicator is designed to detect potential trend reversals or volatility bursts by analyzing price action structured into "blocks." Its primary goal is to capture the earliest signals that a defined trend structure is weakening or breaking.
Signal Generation:
🟢 DTB (Downtrend Breakout): When a confirmed downtrend is identified (e.g., price has been falling for 2 blocks), the indicator waits for the price to break above the highest high of the last completed block in that trend. When this break occurs, it signals a potential bullish reversal with a green DTB triangle below the bar.
🔴 UTB (Uptrend Breakdown): When a confirmed uptrend is identified (e.g., price has been rising for 2 blocks), the indicator waits for the price to break below the lowest low of the last completed block. When this break occurs, it signals a potential bearish reversal with a red UTB triangle above the bar.
🛠️ Key Settings
Block Size (bars): The number of bars in each block used to analyze the trend structure. Lower values track short-term trends; higher values track long-term trends.
Trend Confirmation (steps): The minimum number of consecutive blocks required to "confirm" a trend.
Tolerance: Allowed Off-Trend Steps: The number of "noise" blocks allowed while confirming a trend.
Show Support/Resistance Zones: Toggles the histogram-based S/R zones on or off.
S/R Lookback (blocks): Determines how many blocks to look back for calculating S/R zones.
S/R Zone Width (in ATR): Sets the thickness of the S/R zones, denominated in ATRs.
If you find this useful please reach out and let me know how you use it as it's fairly unique... and thus different than anything I've ever seen or used.

Trend Break Target
The Trend Break Target indicator helps traders identify and trade potential breakout opportunities with precision. It offers the following key benefits:
Customizable Trend Anchors
Allows traders to set specific start and end dates for the trendline, ensuring analysis is aligned with chosen time windows.
Supports different price sources (High, Low, Close) to fit diverse trading styles.
Automatic Trendline Projection
Dynamically plots a trendline between selected anchor points and extends it forward, providing a clear visual guide for future price interactions.
Breakout Detection
Instantly detects when price breaks above or below the trendline.
Plots breakout markers (▲ / ▼) directly on the chart to highlight actionable trade signals.
Pivot-Based Target Calculation
Uses the nearest valid pivot high/low before the breakout (or a fallback lookback if unavailable).
Measures the distance between the pivot and the trendline, then projects a target price in the breakout direction.
Clear Visual Targets
Draws a dotted target line to show where price may reach after the breakout.
Adds a connector line from breakout to target and a measurement line from pivot to trendline, improving clarity of the setup.
Automatic Reset & Efficiency
Resets calculations when new anchors are applied, keeping charts clean and reducing noise.
Deletes old lines and labels automatically to optimize chart readability.
Strategic Trade Planning
Helps traders quickly identify risk-reward opportunities by visualizing breakout levels and price targets.
Useful for trend continuation as well as reversal trading strategies.
👉 In short, the FTBT indicator provides a structured way to analyse trendlines, confirm breakouts, and project realistic price targets—making it a powerful tool for both discretionary and systematic traders.

First Candle High Low LevelsDescription
The "First Candle High Low Levels" Pine Script indicator is designed to highlight the high and low levels of the first candle of the day on your TradingView chart. It works across different timeframes and specifically handles the Indian stock market trading hours (9:15 AM to 3:30 PM IST). The script draws a box from the start to the end of the trading session, visually marking the price range defined by the first candle of the day. Traders can customize the box's border color, fill color, and line width.
Features
Customizable Timeframe: Users can select the desired timeframe for the first candle (e.g., 5-minute, 15-minute, etc.).
Custom Box Appearance: Options to adjust the border color, fill color, and line width of the drawn box.
Auto Reset for Each New Day: The high and low of the first candle are reset daily to mark the start of the next trading day.
Accurate Market Session Handling: The box is drawn from the start of the first candle to the end of the trading session (3:30 PM IST).
Usage
Adding to Chart: Apply the script by copying it into the Pine Script editor in TradingView. Once added, the script will automatically draw a box representing the high and low of the first candle of the day.
Select Timeframe: You can adjust the First Candle Timeframe input to define which timeframe candle will be used for marking the high and low. For example, if you choose a 5-minute timeframe, the high and low of the first 5-minute candle will be used.
Customization:
Adjust the Border Color and Box Fill Color through the input settings to match your chart's style.
Modify the Box Line Width to make the box lines more or less prominent.

Breakout & Trend & Scalping (Zeiierman)█ Overview
Breakout & Trend & Scalping (Zeiierman) transforms time, volume, and trend behavior into a unified visual framework for identifying market expansion, compression, and breakout phases. Instead of viewing price as an isolated movement, the indicator reinterprets it as a continuous relationship between time-driven flow, volume displacement, and trend momentum.
The system constructs a hybrid analytical field using OBV-based flow modeling, time–trend alignment, and adaptive candle smoothing, providing a clear and fluid representation of both breakout probability and structural trend strength.
This advanced framework adapts to different market contexts, including intraday scalping, swing-trend validation, and multi-timeframe continuation analysis, revealing how volume and trend energy accumulate before volatility expansion.
⚪ Why This One Is Unique
Unlike conventional breakout or trend indicators that rely solely on price or volatility, this tool integrates time-weighted OBV mechanics, multi-timeframe trend correlation, and volatility-normalized candle transformation.
Its design leverages an adaptive Time–Trend Integration Engine that adjusts dynamically based on the selected timeframe and method. The result is a fluid, self-normalizing view of market rhythm, capturing not only the visible structure of trends but also the hidden buildup of momentum that precedes breakouts.
█ Main Feature: BTS Adaptive Candle System
The BTS Adaptive Candle System unifies time-based and trend-based flow analysis into a single visual model of market behavior. It synchronizes short-term momentum with long-term trend equilibrium, revealing how volume and directional energy evolve across different temporal structures.
The flow is inherently adaptive. During stable phases, it compresses volatility to emphasize directional persistence and trend continuity. When acceleration builds, it expands to highlight breakout potential and the ignition of new momentum.
Green-to-red and (red-to-green) transitions indicate shifts in order-flow dominance, while color intensity reflects the relative strength of participation. The built-in smoothing system filters out random noise while maintaining fast response to emerging direction, making the BTS Candle System equally effective for scalping precision, breakout confirmation, and long-term trend tracking.
█ How to Use
⚪ Trend Trading
Bullish trends appear when candles remain near the top of their range with bright, steady coloration. This structure shows sustained accumulation and consistent trend support. Fading color or mixed tones suggest short pauses or shallow pullbacks within an ongoing uptrend.
Bearish trends form when candles cluster near the lower range and deepen in red intensity, reflecting growing selling pressure. Consistent red sequences mark continued distribution, while lighter tones or brief color shifts often precede corrective bounces within a broader downtrend.
⚪ Trend Change Trading
When a large BTS candle crosses the midline, it often marks a decisive shift in market control. A strong candle breaking above the midline reflects dominant buying flow and the early phase of bullish momentum, often signaling the start of a new upward trend.
Conversely, when a large candle drops below the midline, it shows dominant selling pressure and the potential beginning of a downward cycle.
These midline transitions represent key moments where institutional flow changes direction. A rapid color shift or fading saturation in candles around these areas frequently precedes a trend reversal or volatility breakout, making them powerful confirmation points for both breakout and trend-change strategies.
⚪ Retracement/Pullback Trading
When BTS candles remain green or turn light yellow near the midline, it indicates balanced momentum as price consolidates during a temporary retracement. A renewed shift back to bright green candles from this area often signals the end of the pullback and the continuation of the uptrend.
In a downtrend, when BTS candles shift to light yellow or fade toward the midline, it shows a temporary slowdown in selling pressure as the price retraces upward. A return to deep red candles after this brief balance phase confirms renewed selling momentum and continuation of the prevailing downtrend.
⚪ Breakout Trading
Big candles in the BTS indicate a shift in control. If this occurs around a resistance level, there is a high chance that price will break out upward.
Similarly, if a large downward BTS candle appears near a support level, there is a high chance that a bearish breakout will follow through.
█ How It Works
⚪ Integrated Market Framework
The BTS system merges time, trend, and volatility behavior into a single adaptive flow field. It constantly balances fast and slow market components, maintaining a smooth equilibrium between short-term reactions and long-term structure.
Calculation: Uses normalized scaling and adaptive synchronization to align directional momentum across changing market states.
⚪ Core Trend Engine
At its center, the model interprets how price movement evolves within its volatility range. It tracks shifts in directional energy and transforms them into a stable momentum surface that highlights both trend continuation and turning points.
Calculation: Applies equilibrium-based mapping to sustain consistent directional flow even during market acceleration or compression.
⚪ Volatility Envelope System
The indicator forms a dynamic envelope around price movement, expanding and contracting with the current market speed. These zones reflect where energy concentrates or fades, helping visualize breakout potential and exhaustion levels.
Calculation: Adapts envelope boundaries through volatility-responsive scaling and balanced symmetry control.
⚪ Adaptive Time Modes
Two adaptive modes — Time and Trend — control how the model responds to changing conditions. The system automatically adjusts its responsiveness, allowing it to behave as a fast scalping model or a slow trend tracker without losing structural balance.
Calculation: Dynamically modifies its internal scaling to maintain equilibrium between speed and smoothness across selected timeframes.
-----------------
Disclaimer
The content provided in my scripts, indicators, ideas, algorithms, and systems is for educational and informational purposes only. It does not constitute financial advice, investment recommendations, or a solicitation to buy or sell any financial instruments. I will not accept liability for any loss or damage, including without limitation any loss of profit, which may arise directly or indirectly from the use of or reliance on such information.
All investments involve risk, and the past performance of a security, industry, sector, market, financial product, trading strategy, backtest, or individual's trading does not guarantee future results or returns. Investors are fully responsible for any investment decisions they make. Such decisions should be based solely on an evaluation of their financial circumstances, investment objectives, risk tolerance, and liquidity needs.
Script a pagamento

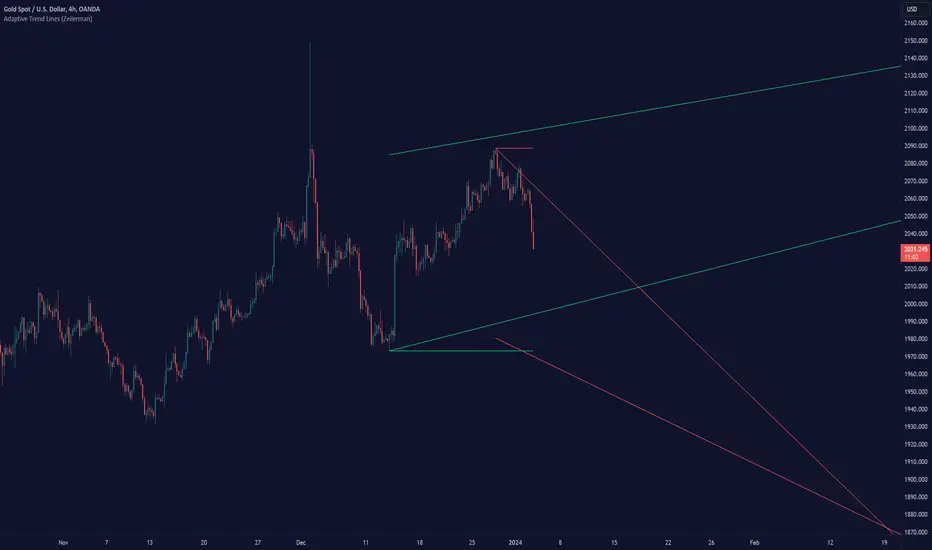
Adaptive Trend Lines (Expo)Adaptive Trend Lines (Expo) identifies the current trend direction within the selected lookback period. The idea behind the indicator is that the trend lines should self adjust to the constantly changing market. The indicator adjusts itself to the market by using tr (true range) and stdev (standard deviation) as dynamic variables.
The indicator displays positive- and negative trend channels.
HOW TO USE
1. Use the indicator to identify the trend direction.
I hope you find this indicator useful , and please comment or contact me if you like the script or have any questions/suggestions for future improvements. Thanks!
I will continually work on this indicator , so please share your experience and feedback as it will enable me to make even better improvements. Thanks to everyone that has already contacted me regarding my scripts. Your feedback is valuable for future developments!
-----------------
Disclaimer
Copyright by Zeiierman.
The information contained in my scripts/indicators/ideas does not constitute financial advice or a solicitation to buy or sell any securities of any type. I will not accept liability for any loss or damage, including without limitation any loss of profit, which may arise directly or indirectly from the use of or reliance on such information.
All investments involve risk, and the past performance of a security, industry, sector, market, financial product, trading strategy, or individual’s trading does not guarantee future results or returns. Investors are fully responsible for any investment decisions they make. Such decisions should be based solely on an evaluation of their financial circumstances, investment objectives, risk tolerance, and liquidity needs.
My scripts/indicators/ideas are only for educational purposes!