House Rules SuperTrend Strategy (ATR-Based, Non-Repainting)📝 DESCRIPTION
Overview
The House Rules SuperTrend Strategy is a clean, rule-based trading strategy built using Pine Script® v6.
It is designed for transparent backtesting, non-repainting signals, and simple trend-following execution across all markets and timeframes.
This strategy uses TradingView’s built-in SuperTrend indicator, which is derived from Average True Range (ATR), to identify trend direction changes and generate long and short trades.
How the Strategy Works
Long Entry
A long position is opened when the SuperTrend flips from bearish to bullish
This confirms a potential upward trend shift
Short Entry
A short position is opened when the SuperTrend flips from bullish to bearish
This confirms a potential downward trend shift
Exits
Positions are closed when either:
The opposite SuperTrend signal appears, or
The ATR-based Stop Loss or Take Profit is reached (if enabled)
All signals are calculated on confirmed candle closes only, ensuring accurate and fair backtesting.
Risk Management
Optional ATR-based Stop Loss
Optional ATR-based Take Profit
Position sizing based on percentage of equity
Commission included for realistic performance results
All parameters are user-adjustable from the settings panel.
Backtesting & Transparency
This is a strategy, not an indicator
No repainting
No future data usage
No hidden filters
No lookahead bias
Fully compatible with TradingView’s Strategy Tester
Users are encouraged to test different symbols, timeframes, and parameter values to suit their trading style.
Recommended Use
This strategy can be used on:
Cryptocurrencies
Forex
Stocks
Indices
Futures
It performs best in trending market conditions and may underperform during low-volatility or ranging markets.
Disclaimer
This script is provided for educational and research purposes only.
It is not financial advice. Always test and validate strategies before using them in live trading.
Trendfollowing-strategy

QQQ TimingThis is a trend-following position trading strategy designed for the QQQ and the leveraged ETF QLD (ProShares Ultra QQQ). The primary goal is to capture multi-month holds for maximal profit.
Key Instruments & Performance
The strategy performs best with QLD, which yields far superior results compared to QQQ.
TQQQ (triple-leveraged) results in higher drawdowns and is not the optimal choice.
Important: The system is not intended for use with other indexes, individual stocks, or investments (like crypto or gold), as performance can vary widely.
Buy Signals
The strategy's signals are rooted in the S&P 500 Index (SPX), as testing showed it provides more reliable triggers than using QQQ itself.
Primary Buy Signal (Credit to IBD/Mike Webster): The SPX triggers a buy when its low closes above the 21-day Exponential Moving Average (EMA) for three consecutive days.
Refinement with Downtrend Lines: During corrective or bear periods, results and drawdowns can be significantly improved by incorporating downtrend lines. These lines connect lower highs. The strategy waits for the price to close above a drawn downtrend line before executing a buy. This refinement can modify the primary signal, either by allowing for an earlier entry or, in some cases, completely nullifying a false signal until the trend change proves itself.
Risk Management & Exit Strategy
Initial Buy Risk: A 3.7% stop loss is applied immediately upon the initial entry.
Initial Exit Rule: An exit is required if the QQQ's low drops below the 50-day Simple Moving Average (SMA).
Note: The 3.7% stop often provides protection when the initial buy occurs below the 50-day SMA. However, if QQQ is already trading above its 50-day SMA at the time of the SPX signal (indicating relative strength), historically, it has been better to use the 50-day SMA rule to give the position more room to run.
Trend Exit (Profit-Taking): To stay in a strong trend for the optimal amount of time, the long position is exited when a moving average crossover to the downside is triggered, based around the 107-day Simple Moving Average (SMA).

Turtles StrategyBorn from the 1980s "Turtle" experiment, this method of trading captures breakouts and places or closes trades with intrabar entries or exits and realized-equity risk controls.
How It Works
The strategy buys/sells on breakouts from recent highs/lows, using ATR for volatility-adjusted stops and sizing. It risks a fixed % (default 1%) of realized equity per trade—initial capital plus closed P&L, ignoring open positions for conservatism. Drawdown protection auto-reduces risk by 20% at 10% drops (up to three times), resetting only on full peak recovery. Single positions only, with 1-tick slippage simulated for realistic fills. Best for trending assets like forex,commodities, crypto, stocks. Backtest for optimal parameters.
Main Operations
The strategy works on any timeframe but it's meant to be used on daily charts.
Entry Signals:
Long: Buy-stop 1 tick above 20-bar high (default "Entry Period") when no position—enters intrabar on breakout.
Short: Sell-stop 1 tick below 20-bar low. OCA cancels opposites.
Size: (Realized equity × adjusted risk %) ÷ (2× ATR stop distance), scaled by point value.
Exit Signals:
Longs: Stop at tighter of (entry - 2× ATR) or (10-bar low - 1 tick trailing, default "Exit Period").
Shorts: Stop at tighter of (entry + 2× ATR) or (10-bar high + 1 tick trailing).
Locks profits in trends, exits fast on fades.
Risk Controls:
Tracks realized equity peak.
10% drawdown: Risk ×0.8; 20%/30%: Further ×0.8 (max 3x).
Full reset above peak—preserves capital in slumps.

Bollinger Bands Enhanced StrategyOverview
The common practice of using Bollinger bands is to use it for building mean reversion or squeeze momentum strategies. In the current script Bollinger Bands Enhanced Strategy we are trying to combine the strengths of both strategies types. It utilizes Bollinger Bands indicator to buy the local dip and activates trailing profit system after reaching the user given number of Average True Ranges (ATR). Also it uses 200 period EMA to filter trades only in the direction of a trend. Strategy can execute only long trades.
Unique Features
Trailing Profit System: Strategy uses user given number of ATR to activate trailing take profit. If price has already reached the trailing profit activation level, scrip will close long trade if price closes below Bollinger Bands middle line.
Configurable Trading Periods: Users can tailor the strategy to specific market windows, adapting to different market conditions.
Major Trend Filter: Strategy utilizes 100 period EMA to take trades only in the direction of a trend.
Flexible Risk Management: Users can choose number of ATR as a stop loss (by default = 1.75) for trades. This is flexible approach because ATR is recalculated on every candle, therefore stop-loss readjusted to the current volatility.
Methodology
First of all, script checks if currently price is above the 200-period exponential moving average EMA. EMA is used to establish the current trend. Script will take long trades on if this filtering system showing us the uptrend. Then the strategy executes the long trade if candle’s low below the lower Bollinger band. To calculate the middle Bollinger line, we use the standard 20-period simple moving average (SMA), lower band is calculated by the substruction from middle line the standard deviation multiplied by user given value (by default = 2).
When long trade executed, script places stop-loss at the price level below the entry price by user defined number of ATR (by default = 1.75). This stop-loss level recalculates at every candle while trade is open according to the current candle ATR value. Also strategy set the trailing profit activation level at the price above the position average price by user given number of ATR (by default = 2.25). It is also recalculated every candle according to ATR value. When price hit this level script plotted the triangle with the label “Strong Uptrend” and start trail the price at the middle Bollinger line. It also started to be plotted as a green line.
When price close below this trailing level script closes the long trade and search for the next trade opportunity.
Risk Management
The strategy employs a combined and flexible approach to risk management:
It allows positions to ride the trend as long as the price continues to move favorably, aiming to capture significant price movements. It features a user-defined ATR stop loss parameter to mitigate risks based on individual risk tolerance. By default, this stop-loss is set to a 1.75*ATR drop from the entry point, but it can be adjusted according to the trader's preferences.
There is no fixed take profit, but strategy allows user to define user the ATR trailing profit activation parameter. By default, this stop-loss is set to a 2.25*ATR growth from the entry point, but it can be adjusted according to the trader's preferences.
Justification of Methodology
This strategy leverages Bollinger bangs indicator to open long trades in the local dips. If price reached the lower band there is a high probability of bounce. Here is an issue: during the strong downtrend price can constantly goes down without any significant correction. That’s why we decided to use 200-period EMA as a trend filter to increase the probability of opening long trades during major uptrend only.
Usually, Bollinger Bands indicator is using for mean reversion or breakout strategies. Both of them have the disadvantages. The mean reversion buys the dip, but closes on the return to some mean value. Therefore, it usually misses the major trend moves. The breakout strategies usually have the issue with too high buy price because to have the breakout confirmation price shall break some price level. Therefore, in such strategies traders need to set the large stop-loss, which decreases potential reward to risk ratio.
In this strategy we are trying to combine the best features of both types of strategies. Script utilizes ate ATR to setup the stop-loss and trailing profit activation levels. ATR takes into account the current volatility. Therefore, when we setup stop-loss with the user-given number of ATR we increase the probability to decrease the number of false stop outs. The trailing profit concept is trying to add the beat feature from breakout strategies and increase probability to stay in trade while uptrend is developing. When price hit the trailing profit activation level, script started to trail the price with middle line if Bollinger bands indicator. Only when candle closes below the middle line script closes the long trade.
Backtest Results
Operating window: Date range of backtests is 2020.10.01 - 2024.07.01. It is chosen to let the strategy to close all opened positions.
Commission and Slippage: Includes a standard Binance commission of 0.1% and accounts for possible slippage over 5 ticks.
Initial capital: 10000 USDT
Percent of capital used in every trade: 30%
Maximum Single Position Loss: -9.78%
Maximum Single Profit: +25.62%
Net Profit: +6778.11 USDT (+67.78%)
Total Trades: 111 (48.65% win rate)
Profit Factor: 2.065
Maximum Accumulated Loss: 853.56 USDT (-6.60%)
Average Profit per Trade: 61.06 USDT (+1.62%)
Average Trade Duration: 76 hours
These results are obtained with realistic parameters representing trading conditions observed at major exchanges such as Binance and with realistic trading portfolio usage parameters.
How to Use
Add the script to favorites for easy access.
Apply to the desired timeframe and chart (optimal performance observed on 4h BTC/USDT).
Configure settings using the dropdown choice list in the built-in menu.
Set up alerts to automate strategy positions through web hook with the text: {{strategy.order.alert_message}}
Disclaimer:
Educational and informational tool reflecting Skyrex commitment to informed trading. Past performance does not guarantee future results. Test strategies in a simulated environment before live implementation

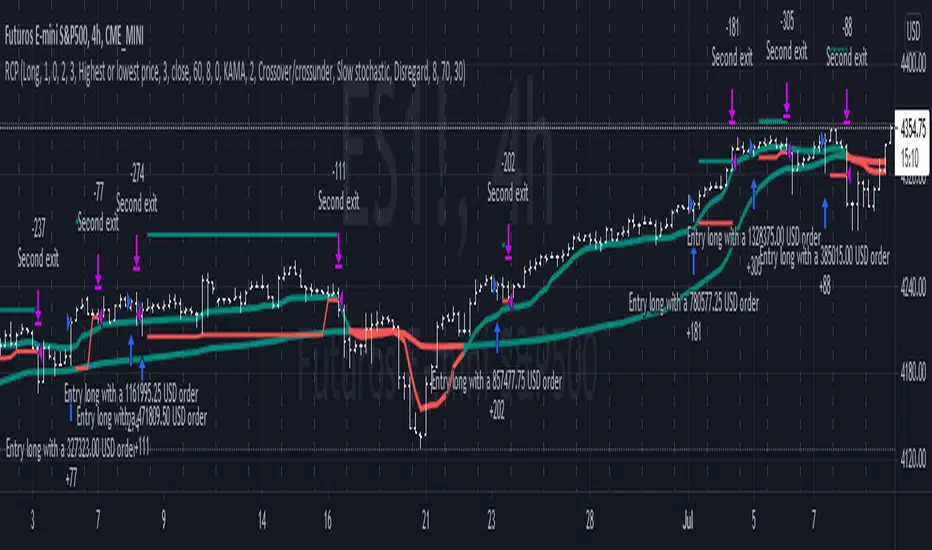
Reversal closing priceThe reversal closing price (RCP) is a candlestick pattern which follows two simples rules:
the low price of current candle needs to be lower than the low price of the last 2 candles
the closing price of current candle needes to be higher than the closing price of the last candle
This generates a signal for a long position. For a short position, the conditions are inverted:
the high price of current candle needs to be higher than the high price of the last 2 candles
the closing price of current candle needes to be lower than the closing price of the last candle
Since RCP is a trend follower indicator, the strategy is programmed in such a way that long positions are only placed if the short period EMA is above the long period EMA, and short positions are only placed if the short EMA is bellow the long EMA. Both periods are configurable, and should be ajusted for each asset.
This strategy uses a fixed stop loss and take profit, and the it's ratio is configurable. The stop price is one tick lower than the lowest price of X candles prior to the order execution for long positions, while in short positions it's one tick higher than the higher price. The amount of candles to lookback (X) is configurable. Both stop and take profit prices are displayed, the first as a red line, and the second as a green line.
This is the setting that I've found to work best with TVC:SPX , but you may find a better setting. While the RCP is universal, it's placement depends on the trend and it's strenght, something that is very heterogeneous among assets.
I really wish that I was able to place images, but I don't have PRO, so text will have to do.
This strategy was designed by Alexandre Wolwacz, a.k.a. Stormer.