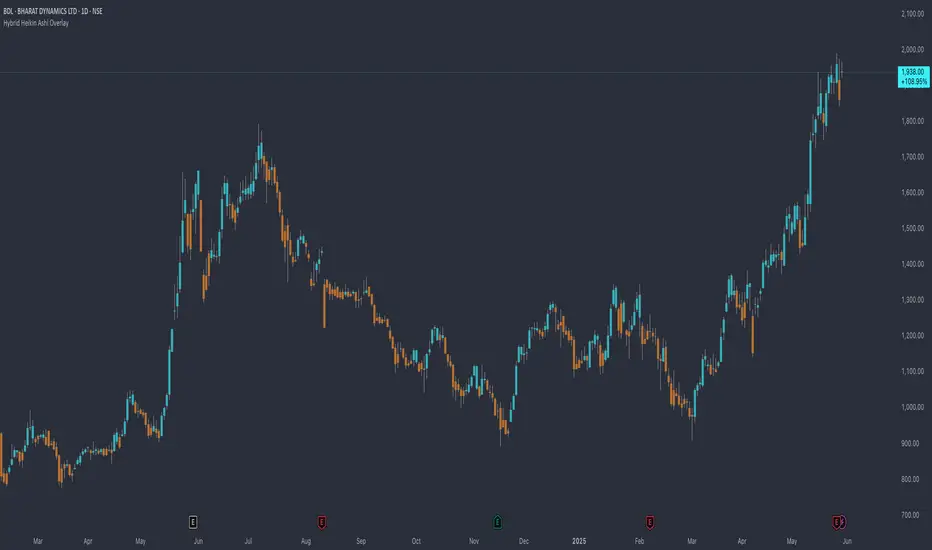
Hybrid Heikin Ashi OverlayHybrid Heikin Ashi Overlay
I personally like Heikin Ashi for its simplicity in showing clean trends. However, it tends to smooth out price action so much that we sometimes miss key signals from the actual candles.
This indicator overlays Heikin Ashi-style background colors while keeping regular candles intact — giving you the best of both worlds:
• Smoother trend visibility
• No loss of execution precision
• Customizable colors & transparency
🔹 No repainting
🔹 No strategy logic — purely visual
🔹 Designed to reduce clutter and help traders stay focused on structure
Created by: @yug_and_her
Trendpattern
21-Day Trend Direction📈 21-Day Trend Direction Indicator
📊 How It Works:
🎯 Trend Detection Logic:
Analyzes last 21 daily candles
Calculates total price change from start to end
Compares against sideways threshold (default 2%)
Counts bullish vs bearish days
Tracks higher highs and lower lows
📈 Trend Classifications:
• 📈 UPTREND: Price change > +2% over 21 days
• 📉 DOWNTREND: Price change < -2% over 21 days
• ➡️ SIDEWAYS: Price change between -2% and +2%
💪 Trend Strength Levels:
• 🔥 Very Strong: >5% price change
• 💪 Strong: 3-5% price change
• 📊 Moderate: 1.5-3% price change
• 📉 Weak: <1.5% price change
🎨 Visual Features:
📋 Information Table Shows:
• Trend Direction with color coding
• Price Change % over 21 days
• Trend Strength classification
• Bull/Bear Days count
• Higher Highs/Lower Lows count
• Analysis Period (customizable)
📊 Chart Indicators:
• Trend Line (21-day moving average)
• Background Color for quick trend identification
• Trend Arrows (▲ ▼ ➡) on chart
• Customizable display options
⚙️ Customizable Settings:
🎯 Analysis Settings:
• Lookback Days: 5-50 days (default: 14)
• Sideways Threshold: 0.5-10% (default: 2%)
• Trend Strength: Low/Medium/High sensitivity
🎨 Display Options:
• Table Position: 9 different positions
• Table Size: Tiny to Large
• Show/Hide: Table, Trend Line, Background, Arrows
🚨 Alert Options:
• Trend Change to Uptrend
• Trend Change to Downtrend
• Trend Change to Sideways
This indicator gives you a clear, objective view of the 21-day trend with multiple confirmation signals! 🚀

Multi-Timeframe Trend Lines📌 What This Indicator Does
This tool helps you see the direction of the market across different timeframes—all on one chart.
Imagine you're looking at the price of a stock, crypto, or any other asset. You probably know the price can move differently in the short term and the long term. This indicator draws slanted lines to show if the price is generally going up or down over different time periods—like the past 1 minute, 5 minutes, 1 hour, 1 day, or even 1 month.
These lines are colored:
Green if the price is going up (a rising trend).
Red if the price is going down (a falling trend).
You can choose which timeframes you want to see—like 5 minutes or 1 day—by ticking checkboxes.
✅ Why This Is Useful
1. Helps You See the Bigger Picture
Even if you’re trading on a short timeframe (like 5 minutes), this indicator shows you the trend in longer timeframes (like 1 hour or 1 day). This helps you avoid going against the overall direction of the market.
2. Gives You More Confidence
When several timeframes show the same direction (all lines green, for example), it gives you more confidence that the trend is strong.
3. Saves Time
Instead of switching between different charts (like going from a 1-hour chart to a daily chart), you can see all the trends right on your current chart.
4. Easier Decision Making
You can quickly decide if it’s a good idea to buy (when most lines are green) or sell (when most lines are red).
👶 Example for a Beginner
Let’s say you’re looking at a 15-minute chart and thinking of buying.
* The 15-minute line is green (short-term price is going up).
* The 1-hour line is also green (medium-term price is going up).
* The 1-day line is green too (long-term price is going up).
This is a good sign that everything is moving upward, and it may be safer to buy.
But if the 1-day line is red while the shorter ones are green, it might mean the upward move is just temporary. That’s something to be careful about.

Z-Score Trend Monitor [EdgeTerminal]The Z-Score Trend Monitor measures how far the short-term moving average deviates from the long-term moving average using the spread difference of the two — in standardized units. It’s designed to detect overextension, momentum exhaustion, and potential mean-reversion points by converting the spread between two moving averages into a normalized Z-score and tracking its change and direction over time.
The idea behind this is to catch the changes in the direction of a trend earlier than the usual and lagging moving average lines, allowing you to react faster.
The math behind the indicator itself is very simple. We take the simple moving average of the spread between a long term and short term moving average, and divide it by the difference between the spread and spread mean.
This results in a relatively accurate and early acting trend detector that can easily identify overbought and oversold levels in any timeframe. From our own testing, we recommend using this indicator as a trend confirmation tool.
How to Use It:
Keep an eye on the Z-Score or the blue line. When it goes over 2, it indicates an overbought or near top level, and when it goes below -2, it indicates an oversold or near bottom.
When Z-Score returns to zero or grey line, it suggests mean reversion is in progress.
You can also change the Z-Score criteria from 2 and -2 in the settings to any number you’d like for tighter or wider levels.
For scalping and fast trading setups, we recommend shorter SMAs, such as 5 and 20, and for longer trading setups such as swing trades, we recommend 20 and 100.
Settings:
Short SMA: Lookback period of short term simple moving average for the lower side of the SMA spread.
Short Term Weight: Additional weight or multiplier to suppress the short term SMA calculation. This is used to refine the SMA calculation for more granular and edge cases when needed, usually left at 1, meaning it will take the entire given value in the short SMA field.
Long SMA: Lookback period of long term simple moving average for the upper side of the SMA spread.
Long Term Weight: Additional weight or multiplier to suppress the long term SMA calculation. This is used to refine the long SMA calculation for more granular and edge cases when needed, usually left at 1, meaning it will take the entire given value in the long SMA field.
Z-Score Threshold: The threshold for upper (oversold) and lower (overbought) levels. This can also be set individually from the style page.
Z-Score Lookback Window: The lookback period to calculate spread mean and spread standard deviation

Cointegration Buy and Sell Signals [EdgeTerminal]The Cointegration Buy And Sell Signals is a sophisticated technical analysis tool to spot high-probability market turning points — before they fully develop on price charts.
Most reversal indicators rely on raw price action, visual patterns, or basic and common indicator logic — which often suffer in noisy or trending markets. In most cases, they lag behind the actual change in trend and provide useless and late signals.
This indicator is rooted in advanced concepts from statistical arbitrage, mean reversion theory, and quantitative finance, and it packages these ideas in a user-friendly visual format that works on any timeframe and asset class.
It does this by analyzing how the short-term and long-term EMAs behave relative to each other — and uses statistical filters like Z-score, correlation, volatility normalization, and stationarity tests to issue highly selective Buy and Sell signals.
This tool provides statistical confirmation of trend exhaustion, allowing you to trade mean-reverting setups. It fades overextended moves and uses signal stacking to reduce false entries. The entire indicator is based on a very interesting mathematically grounded model which I will get into down below.
Here’s how the indicator works at a high level:
EMAs as Anchors: It starts with two Exponential Moving Averages (EMAs) — one short-term and one long-term — to track market direction.
Statistical Spread (Regression Residuals): It performs a rolling linear regression between the short and long EMA. Instead of using the raw difference (short - long), it calculates the regression residual, which better models their natural relationship.
Normalize the Spread: The spread is divided by historical price volatility (ATR) to make it scale-invariant. This ensures the indicator works on low-priced stocks, high-priced indices, and crypto alike.
Z-Score: It computes a Z-score of the normalized spread to measure how “extreme” the current deviation is from its historical average.
Dynamic Thresholds: Unlike most tools that use fixed thresholds (like Z = ±2), this one calculates dynamic thresholds using historical percentiles (e.g., top 10% and bottom 10%) so that it adapts to the asset's current behavior to reduce false signals based on market’s extreme volatility at a certain time.
Z-Score Momentum: It tracks the direction of the Z-score — if Z is extreme but still moving away from zero, it's too early. It waits for reversion to start (Z momentum flips).
Correlation Check: Uses a rolling Pearson correlation to confirm the two EMAs are still statistically related. If they diverge (low correlation), no signal is shown.
Stationarity Filter (ADF-like): Uses the volatility of the regression residual to determine if the spread is stationary (mean-reverting) — a key concept in cointegration and statistical arbitrage. It’s not possible to build an exact ADF filter in Pine Script so we used the next best thing.
Signal Control: Prevents noisy charts and overtrading by ensuring no back-to-back buy or sell signals. Each signal must alternate and respect a cooldown period so you won’t be overwhelmed and won’t get a messy chart.
Important Notes to Remember:
The whole idea behind this indicator is to try to use some stat arb models to detect shifting patterns faster than they appear on common indicators, so in some cases, some assumptions are made based on historic values.
This means that in some cases, the indicator can “jump” into the conclusion too quickly. Although we try to eliminate this by using stationary filters, correlation checks, and Z-score momentum detection, there is still a chance some signals that are generated can be too early, in the stock market, that's the same as being incorrect. So make sure to use this with other indicators to confirm the movement.
How To Use The Indicator:
You can use the indicator as a standalone reversal system, as a filter for overbought and oversold setups, in combination with other trend indicators and as a part of a signal stack with other common indicators for divergence spotting and fade trades.
The indicator produces simple buy and sell signals when all criteria is met. Based on our own testing, we recommend treating these signals as standalone and independent from each other . Meaning that if you take position after a buy signal, don’t wait for a sell signal to appear to exit the trade and vice versa.
This is why we recommend using this indicator with other advanced or even simple indicators as an early confirmation tool.
The Display Table:
The floating diagnostic table in the top-right corner of the chart is a key part of this indicator. It's a live statistical dashboard that helps you understand why a signal is (or isn’t) being triggered, and whether the market conditions are lining up for a potential reversal.
1. Z-Score
What it shows: The current Z-score value of the volatility-normalized spread between the short EMA and the regression line of the long EMA.
Why it matters: Z-score tells you how statistically extreme the current relationship is. A Z-score of:
0 = perfectly average
> +2 = very overbought
< -2 = very oversold
How to use it: Look for Z-score reaching extreme highs or lows (beyond dynamic thresholds). Watch for it to start reversing direction, especially when paired with green table rows (see below)
2. Z-Score Momentum
What it shows: The rate of change (ROC) of the Z-score:
Zmomentum=Zt − Zt − 1
Why it matters: This tells you if the Z-score is still stretching out (e.g., getting more overbought/oversold), or reverting back toward the mean.
How to use it: A positive Z-momentum after a very low Z-score = potential bullish reversal A negative Z-momentum after a very high Z-score = potential bearish reversal. Avoid signals when momentum is still pushing deeper into extremes
3. Correlation
What it shows: The rolling Pearson correlation coefficient between the short EMA and long EMA.
Why it matters: High correlation (closer to +1) means the EMAs are still statistically connected — a key requirement for cointegration or mean reversion to be valid.
How to use it: Look for correlation > 0.7 for reliable signals. If correlation drops below 0.5, ignore the Z-score — the EMAs aren’t moving together anymore
4. Stationary
What it shows: A simplified "Yes" or "No" answer to the question:
“Is the spread statistically stable (stationary) and mean-reverting right now?”
Why it matters: Mean reversion strategies only work when the spread is stationary — that is, when the distance between EMAs behaves like a rubber band, not a drifting cloud.
How to use it: A "Yes" means the indicator sees a consistent, stable spread — good for trading. "No" means the market is too volatile, disjointed, or chaotic for reliable mean reversion. Wait for this to flip to "Yes" before trusting signals
5. Last Signal
What it shows: The last signal issued by the system — either "Buy", "Sell", or "None"
Why it matters: Helps avoid confusion and repeated entries. Signals only alternate — you won’t get another Buy until a Sell happens, and vice versa.
How to use it: If the last signal was a "Buy", and you’re watching for a Sell, don’t act on more bullish signals. Great for systems where you only want one position open at a time
6. Bars Since Signal
What it shows: How many bars (candles) have passed since the last Buy or Sell signal.
Why it matters: Gives you context for how long the current condition has persisted
How to use it: If it says 1 or 2, a signal just happened — avoid jumping in late. If it’s been 10+ bars, a new opportunity might be brewing soon. You can use this to time exits if you want to fade a recent signal manually
Indicator Settings:
Short EMA: Sets the short-term EMA period. The smaller the number, the more reactive and more signals you get.
Long EMA: Sets the slow EMA period. The larger this number is, the smoother baseline, and more reliable trend bases are generated.
Z-Score Lookback: The period or bars used for mean & std deviation of spread between short and long EMAs. Larger values result in smoother signals with fewer false positives.
Volatility Window: This value normalizes the spread by historical volatility. This allows you to prevent scale distortion, showing you a cleaner and better chart.
Correlation Lookback: How many periods or how far back to test correlation between slow and long EMAs. This filters out false positives when EMAs lose alignment.
Hurst Lookback: The multiplier to approximate stationarity. Lower leads to more sensitivity to regime change, higher produces a more stricter filtering.
Z Threshold Percentile: This value sets how extreme Z-score must be to trigger a signal. For example, 90 equals only top/bottom 10% of extremes, 80 = more frequent.
Min Bars Between Signals: This hard stop prevents back-to-back signals. The idea is to avoid over-trading or whipsaws in volatile markets even when Hurst lookback and volatility window values are not enough to filter signals.
Some More Recommendations:
We recommend trying different EMA pairs (10/50, 21/100, 5/20) for different asset behaviors. You can set percentile to 85 or 80 if you want more frequent but looser signals. You can also use the Z-score reversion monitor for powerful confirmation.

Johnny's Machine Learning Moving Average (MLMA) w/ Trend Alerts📖 Overview
Johnny's Machine Learning Moving Average (MLMA) w/ Trend Alerts is a powerful adaptive moving average indicator designed to capture market trends dynamically. Unlike traditional moving averages (e.g., SMA, EMA, WMA), this indicator incorporates volatility-based trend detection, Bollinger Bands, ADX, and RSI, offering a comprehensive view of market conditions.
The MLMA is "machine learning-inspired" because it adapts dynamically to market conditions using ATR-based windowing and integrates multiple trend strength indicators (ADX, RSI, and volatility bands) to provide an intelligent moving average calculation that learns from recent price action rather than being static.
🛠 How It Works
1️⃣ Adaptive Moving Average Selection
The MLMA automatically selects one of four different moving averages:
📊 EMA (Exponential Moving Average) – Reacts quickly to price changes.
🔵 HMA (Hull Moving Average) – Smooth and fast, reducing lag.
🟡 WMA (Weighted Moving Average) – Gives recent prices more importance.
🔴 VWAP (Volume Weighted Average Price) – Accounts for volume impact.
The user can select which moving average type to use, making the indicator customizable based on their strategy.
2️⃣ Dynamic Trend Detection
ATR-Based Adaptive Window 📏
The Average True Range (ATR) determines the window size dynamically.
When volatility is high, the moving average window expands, making the MLMA more stable.
When volatility is low, the window shrinks, making the MLMA more responsive.
Trend Strength Filters 📊
ADX (Average Directional Index) > 25 → Indicates a strong trend.
RSI (Relative Strength Index) > 70 or < 30 → Identifies overbought/oversold conditions.
Price Position Relative to Upper/Lower Bands → Determines bullish vs. bearish momentum.
3️⃣ Volatility Bands & Dynamic Support/Resistance
Bollinger Bands (BB) 📉
Uses standard deviation-based bands around the MLMA to detect overbought and oversold zones.
Upper Band = Resistance, Lower Band = Support.
Helps traders identify breakout potential.
Adaptive Trend Bands 🔵🔴
The MLMA has built-in trend envelopes.
When price breaks the upper band, bullish momentum is confirmed.
When price breaks the lower band, bearish momentum is confirmed.
4️⃣ Visual Enhancements
Dynamic Gradient Fills 🌈
The trend strength (ADX-based) determines the gradient intensity.
Stronger trends = More vivid colors.
Weaker trends = Lighter colors.
Trend Reversal Arrows 🔄
🔼 Green Up Arrow: Bullish reversal signal.
🔽 Red Down Arrow: Bearish reversal signal.
Trend Table Overlay 🖥
Displays ADX, RSI, and Trend State dynamically on the chart.
📢 Trading Signals & How to Use It
1️⃣ Bullish Signals 📈
✅ Conditions for a Long (Buy) Trade:
The MLMA crosses above the lower band.
The ADX is above 25 (confirming trend strength).
RSI is above 55, indicating positive momentum.
Green trend reversal arrow appears (confirmation of a bullish reversal).
🔹 How to Trade It:
Enter a long trade when the MLMA turns bullish.
Set stop-loss below the lower Bollinger Band.
Target previous resistance levels or use the upper band as take-profit.
2️⃣ Bearish Signals 📉
✅ Conditions for a Short (Sell) Trade:
The MLMA crosses below the upper band.
The ADX is above 25 (confirming trend strength).
RSI is below 45, indicating bearish pressure.
Red trend reversal arrow appears (confirmation of a bearish reversal).
🔹 How to Trade It:
Enter a short trade when the MLMA turns bearish.
Set stop-loss above the upper Bollinger Band.
Target the lower band as take-profit.
💡 What Makes This a Machine Learning Moving Average?
📍 1️⃣ Adaptive & Self-Tuning
Unlike static moving averages that rely on fixed parameters, this MLMA automatically adjusts its sensitivity to market conditions using:
ATR-based dynamic windowing 📏 (Expands/contracts based on volatility).
Adaptive smoothing using EMA, HMA, WMA, or VWAP 📊.
Multi-indicator confirmation (ADX, RSI, Volatility Bands) 🏆.
📍 2️⃣ Intelligent Trend Confirmation
The MLMA "learns" from recent price movements instead of blindly following a fixed-length average.
It incorporates ADX & RSI trend filtering to reduce noise & false signals.
📍 3️⃣ Dynamic Color-Coding for Trend Strength
Strong trends trigger more vivid colors, mimicking confidence levels in machine learning models.
Weaker trends appear faded, suggesting uncertainty.
🎯 Why Use the MLMA?
✅ Pros
✔ Combines multiple trend indicators (MA, ADX, RSI, BB).
✔ Automatically adjusts to market conditions.
✔ Filters out weak trends, making it more reliable.
✔ Visually intuitive (gradient colors & reversal arrows).
✔ Works across all timeframes and assets.
⚠️ Cons
❌ Not a standalone strategy → Best used with volume confirmation or candlestick analysis.
❌ Can lag slightly in fast-moving markets (due to smoothing).

Power Trend [MacAlgo]Description:
The Power Trend Indicator is a sophisticated technical analysis tool that overlays on your trading charts to identify prevailing market trends. It utilizes a combination of ATR-based trend calculations, moving averages, volume analysis, and momentum indicators to generate reliable buy and sell signals. Additionally, it offers customizable settings to adapt to various trading styles and timeframes.
Key Features:
Adaptive ATR Calculation: Automatically adjusts the ATR (Average True Range) period and multiplier based on the selected timeframe for more accurate trend detection.
Dynamic Trend Lines: Plots continuous trend lines with color-coded bars to visually represent bullish and bearish trends.
Buy/Sell Signals: Generates standard and power buy/sell signals to help you make informed trading decisions.
Volume Analysis: Incorporates average buy and sell volumes to identify strong market movements.
Multiple Timeframe Support: Automatically adjusts the indicator's timeframe or allows for manual selection to suit your trading preferences.
Highlighting: Highlights trending bars for easy visualization of market conditions.
Alerts: Customizable alert conditions to notify you of potential trading opportunities in real-time.
How it Works:
1. ATR-Based Trend Calculation:
ATR Period & Multiplier: Calculates ATR based on user-defined periods and multipliers, dynamically adjusting according to the chart's timeframe.
Trend Determination: Identifies trends as bullish (1) or bearish (-1) based on price movements relative to ATR-based upper (up) and lower (dn) trend lines.
2. Moving Averages:
EMA & SMA: Calculates exponential and simple moving averages to smooth price data and identify underlying trends.
AlphaTrend Line: Combines a 50-period EMA and a 30-period SMA on a 4-hour timeframe to create the AlphaTrend line, providing a robust trend reference.
3. Volume Analysis:
Buy/Sell Volume: Differentiates between buy and sell volumes to gauge market strength.
Average Volume: Compares current volume against average buy/sell volumes to detect significant market movements.
4. Momentum Indicators:
RSI, MACD, OBV: Incorporates Relative Strength Index (RSI), Moving Average Convergence Divergence (MACD), and On-Balance Volume (OBV) to assess momentum and confirm trend strength.
5. Signal Generation:
Standard Signals: Basic buy and sell signals based on trend crossovers.
Power Signals: Enhanced signals requiring multiple conditions (e.g., increased volume, momentum confirmation) for higher confidence trades.
Customization Options:
Tailor the Power Trend Indicator to your specific trading needs with the following settings:
ATR Period: Set the period for ATR calculation (default: 8).
ATR Multiplier: Adjust the ATR multiplier to fine-tune trend sensitivity (default: 3.0).
Source: Choose the price source (e.g., HL2, Close) for calculations.
Change ATR Calculation Method: Toggle between different ATR calculation methods.
Show Buy/Sell Signals: Enable or disable the display of buy and sell signals on the chart.
Highlighting: Turn on or off the bar highlighting feature.
Timeframe Adjustment: Choose between automatic timeframe adjustment or manually set
the indicator's timeframe.
Manual Indicator Timeframe: If manual adjustment is selected, specify the desired timeframe (default: 60 minutes).
Visual Components:
Trend Lines: Continuous lines representing the current trend, color-coded for easy identification (green for bullish, red for bearish, orange for neutral).
Bar Coloring: Bars are colored based on the current trend and its relationship to the AlphaTrend line.
Buy/Sell Triangles: Triangular markers appear on the chart to indicate buy and sell signals.
Power Signals: Larger triangles highlight strong buy and sell opportunities based on multiple confirming factors.
Highlighting: Transparent overlays highlight trending areas to enhance visual clarity.
Alerts:
Stay informed with customizable alerts that notify you of important market movements:
SuperTrend Buy/Sell: Alerts when standard buy or sell signals are generated.
Power Buy/Sell Alerts: Notifications for strong buy or sell signals based on comprehensive conditions.
Trend Direction Change: Alerts when the trend changes from bullish to bearish or vice versa.
How to Use:
Add to Chart: Apply the Power Trend Indicator to your preferred trading chart on TradingView.
Configure Settings: Adjust the input parameters to match your trading style and the timeframe you are analyzing.
Analyze Trends: Observe the trend lines, bar colors, and AlphaTrend line to understand the current market trend.
Follow Signals: Look for buy and sell signals or power signals to identify potential entry and exit points.
Set Alerts: Enable alerts to receive real-time notifications of significant trading opportunities.
Adjust as Needed: Fine-tune the settings based on market conditions and your trading experience.
Important Notes:
Backtesting: While the Power Trend Indicator is built using robust technical analysis principles, it's essential to backtest and validate its performance within your trading strategy.
Market Conditions: The indicator performs best in trending markets. In sideways or highly volatile markets, signal reliability may vary.
Risk Management: Always employ proper risk management techniques when trading based on indicator signals to protect your capital.
Disclaimer:
This indicator is intended for educational purposes only and does not provide financial advice or guarantee future performance. Trading involves risk, and past results are not indicative of future outcomes. Always conduct your own analysis and risk management.

TrendMasterPro_FekonomiTrend Change and Start Signals with Weighted Conditions
The Trend Change and Start Signals with Weighted Conditions indicator leverages various technical analysis tools to generate reliable buy and sell signals. This indicator helps investors more accurately identify trend changes and start signals in the market.
Features:
Utilizes popular technical analysis tools such as MACD, RSI, EMA, and Ichimoku Cloud.
Enhances signal accuracy with additional indicators like ADX and Volume Increase.
Allows users to adjust the weights of each condition to set their importance.
The Confidence Level parameter lets you adjust the accuracy rate of the signals.
Visual Signals make it easy to track buy and sell points directly on the chart.
How It Works:
Condition Weights: Users assign weights to indicators like MACD, RSI, EMA, and Ichimoku Cloud. If you have no idea, use default settings.
Condition Fulfillment: Checks if the conditions for each indicator are met.
Confidence Level: The total weight of the fulfilled conditions must exceed the user-defined confidence level.
Signal Generation: When these conditions are met, a buy or sell signal is generated and visually displayed on the chart.
Customization:
Personalize Signals: By adjusting the weights of the indicators used, you can personalize the signals to match your trading strategy and preferences.
Use Cases:
Short-Term Investments: Identify quick trend changes for short-term trading decisions.
Long-Term Investments: Detect long-term trend starts and changes for strategic investment decisions.
Technical Analysis: Combine different technical analysis tools for more comprehensive and reliable analyses.
With this indicator, you can better understand market movements and make more informed investment decisions. Try it now and enhance your trading strategy!
by Fekonomi

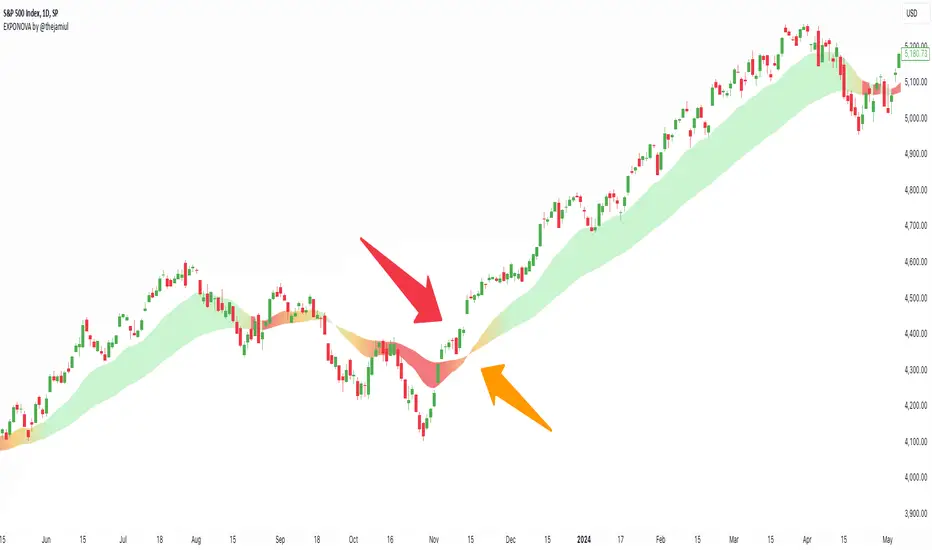
EXPONOVA by @thejamiulEXPONOVA is an advanced EMA-based indicator designed to provide a visually intuitive and actionable representation of market trends. It combines two EMAs (Exponential Moving Averages) with a custom gradient fill to help traders identify trend reversals, strength, and the potential duration of trends.
This indicator uses a gradient color fill between two EMAs—one short-term (20-period) and one longer-term (55-period). The gradient dynamically adjusts based on the proximity and relationship of the closing price to the EMAs, giving traders a unique visual insight into trend momentum and potential exhaustion points.
Key Features:
Dynamic Gradient Fill:
The fill color between the EMAs changes based on the bar's position relative to the longer-term EMA.
A fading gradient visually conveys the strength and duration of the trend. The closer the closing price is to crossing the EMA, the stronger the gradient, making trends easy to spot.
Precision EMA Calculations:
The indicator plots two EMAs (20 and 55) without cluttering the chart, ensuring traders have a clean and informative display.
Ease of Use:
Designed for both novice and advanced traders, this tool is effective in identifying trend reversals and entry/exit points.
Trend Reversal Detection:
Built-in logic identifies bars since the last EMA cross, dynamically adjusting the gradient to signal potential trend changes.
How It Works:
This indicator calculates two EMAs:
EMA 20 (Fast EMA): Tracks short-term price movements, providing early signals of potential trend changes.
EMA 55 (Slow EMA): Captures broader trends and smoothens noise for a clearer directional bias.
The area between the two EMAs is filled with a dynamic color gradient, which evolves based on how far the price has moved above or below EMA 55. The gradient acts as a visual cue to the strength and duration of the current trend:
Bright green shades indicate bullish momentum building over time.
Red tones highlight bearish momentum.
The fading effect in the gradient provides traders with an intuitive representation of trend strength, helping them gauge whether the trend is accelerating, weakening, or reversing.
Gradient-Filled Region: Unique visualization to simplify trend analysis without cluttering the chart.
Dynamic Trend Strength Indication: The gradient dynamically adjusts based on the price's proximity to EMA 55, giving traders insight into momentum changes.
Minimalist Design: The EMAs themselves are not displayed by default to maintain a clean chart while still benefiting from their analysis.
Customizable Lengths: Pre-configured with EMA lengths of 20 and 55, but easily modifiable for different trading styles or instruments.
How to Use This Indicator
Trend Detection: Look at the gradient fill for visual confirmation of trend direction and strength.
Trade Entries:
Enter long positions when the price crosses above EMA 55, with the gradient transitioning to green.
Enter short positions when the price crosses below EMA 55, with the gradient transitioning to red.
Trend Strength Monitoring:
A brighter gradient suggests a sustained and stronger trend.
A fading gradient may indicate weakening momentum and a potential reversal.
Important Notes
This indicator uses a unique method of color visualization to enhance decision-making but does not generate buy or sell signals directly.
Always combine this indicator with other tools or methods for comprehensive analysis.
Past performance is not indicative of future results; please practice risk management while trading.
How to Use:
Trend Following:
Use the gradient fill to identify the trend direction.
A consistently bright gradient indicates a strong trend, while fading colors suggest weakening momentum.
Reversal Signals:
Watch for gradient changes near the EMA crossover points.
These can signal potential trend reversals or consolidation phases.
Confirmation Tool:
Combine EXPONOVA with other indicators or candlestick patterns for enhanced confirmation of trade setups.
Open_close AND HIGH_LOW_diffAverage of Absolute (Open - Close) Indicator
This indicator calculates the average of the absolute difference between the open and close prices of the last n candles and plots the result in a separate panel.
Key Features:
Customizable Period: Users can set the number of candles (n) to include in the average calculation.
Absolute Value Calculation: The script computes the absolute difference (|Open - Close|) for each candle, ensuring only positive values are averaged.
Separate Panel Visualization: The indicator is displayed in a separate panel below the main chart for clear and uncluttered analysis.
Red Plot: The average value is plotted with a bold red line for easy identification.
Use Cases:
Analyze the average volatility of price movements over a specified period.
Identify periods of consistent price differences between open and close levels.
Complement other volatility or trend-based indicators.
This tool is ideal for traders who want to monitor the consistency of price fluctuations and integrate it into their decision-making process.
How to Use:
Add the script to your TradingView chart.
Adjust the "Number of Candles" input to match your preferred look-back period.
Observe the red line in the separate panel to analyze the average absolute difference over time.
Feel free to reach out with suggestions or feedback to enhance the functionality of this script!

Market StructureThis is an advanced, non-repainting Market Structure indicator that provides a robust framework for understanding market dynamics across any timeframe and instrument.
Key Features:
- Non-repainting market structure detection using swing highs/lows
- Clear identification of internal and general market structure levels
- Breakout threshold system for structure adjustments
- Integrated multi-timeframe compatibility
- Rich selection of 30+ moving average types, from basic to advanced adaptive variants
What Makes It Different:
Unlike most market structure indicators that repaint or modify past signals, this implementation uses a fixed-length lookback period to identify genuine swing points.
This means once a structure level or pivot is identified, it stays permanent - providing reliable signals for analysis and trading decisions.
The indicator combines two layers of market structure:
1. Internal Structure (lighter lines) - More sensitive to local price action
2. General Structure (darker lines) - Shows broader market context
Technical Details:
- Uses advanced pivot detection algorithm with customizable swing size
- Implements consecutive break counting for structure adjustments
- Supports both close and high/low price levels for breakout detection
- Includes offset option for better visual alignment
- Each structure break is validated against multiple conditions to prevent false signals
Offset on:
Offset off:
Moving Averages Library:
Includes comprehensive selection of moving averages, from traditional to advanced adaptive types:
- Basic: SMA, EMA, WMA, VWMA
- Advanced: KAMA, ALMA, VIDYA, FRAMA
- Specialized: Hull MA, Ehlers Filter Series
- Adaptive: JMA, RPMA, and many more
Perfect for:
- Price action analysis
- Trend direction confirmation
- Support/resistance identification
- Market structure trading strategies
- Multiple timeframe analysis
This open-source tool is designed to help traders better understand market dynamics and make more informed trading decisions. Feel free to use, modify, and enhance it for your trading needs.

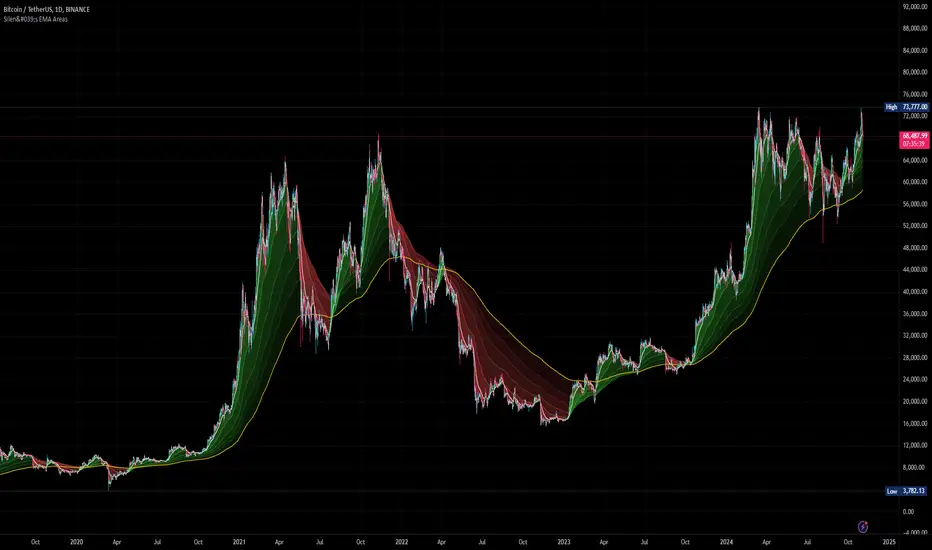
Silen's EMA AreasAre you tired of reading candles? 🧨 Do you want to bring more meaning to your chart? 🧹
Then this is the script for you!
This script does:
- Add several meaningfully pre-configured EMA lines to your chart - up to EMA 300
- Colors the areas between EMA lines in 3d colors - green and red
- The Smaller the EMA, the firmer the color
- Highlights the EMA 300 in a golden color
What is the meaning of this?
Let me introduce a new word to you: EMA FOLDING .
Yes, you heard right. With this indicator you can see in 3D how EMA lines are folding above and below each other, indicating severe mood swings in the chart.
This helps you keep track of what your instrument is actually doing while it enables you to cancel out the noise and messyness of ordinary candles which can be quite random and hard to read.
Once an EMA is fully positive or negatively folded (all ema lines are green and above each other from largest EMA to smallest EMA and vice versa for negatively folded) you can be sure that you are in a Trend or certain mood (for higher timeframes, from 15mins on).
I don't ever want to read any chart without having this indicator on. Whenever I present charts to anybody I use this indicator - and the feedback is insanely positive. People tend to read and understand charts much better with this indicator than just staring at candles.
Why is this indicator different to other EMA indicators and should thereby not be deleted by the TradingView Team due to redundance with other EMA indicators?
- This is not a simple indicator for EMAs
- Rather, this is an indicator to better and easier read the whole chart
- You can detect mood swings very easily which is very hard to do with a normal EMA indicator
- I haven't found any EMA indicator on TradingView that does this job so i sincerely believe it is extremely unique
- I sincerely believe it can help people get a much better understanding of charts without actualy getting into details of EMA's or even needing to know what an EMA is.
This indicator isn't intended for trading purposes, rather it is intended to give you a better and easier understanding of the chart. Of course - you can also use it for your trading but like I said, that is not the primary intended purpose.
This indicator comes pre-configured with quite optimal values (in my opinion) but of course can be fully customized. 🧮
Test it for yourself!
Engulfing Pattern & Impulse [UAlgo]The Engulfing Pattern & Impulse is a tool designed for technical traders who utilize price action and volume analysis to assess market trends and potential reversals. This indicator identifies two powerful trading signals: Engulfing Patterns and Volume Impulses, which are essential components for evaluating potential bullish or bearish market momentum.
Engulfing Patterns are classic candlestick formations often associated with reversals or trend continuations, depending on the overall trend context. This indicator highlights both bullish and bearish engulfing patterns based on configurable criteria such as trend detection settings, comparison with average body size, and a customizable body multiplier for validation. The Volume Impulse feature signals moments of significant volume compared to historical levels, which often precede substantial price movements. Together, these features provide traders with a versatile tool for better timing entry and exit points.
The indicator also offers an adaptive trend detection system, allowing traders to choose from multiple methods (e.g., SMA50 or SMA50/SMA200 combinations) to assess the trend context, making it ideal for various market conditions.
🔶Key Features
Engulfing Pattern Detection: Identifies bullish and bearish engulfing patterns with customizable parameters, including body length and average size comparison.
Configurable trend basis: Choose between SMA50 or SMA50 with SMA200 to define trend direction.
Body size multiplier: Adjust the size threshold for valid engulfing patterns, providing flexibility based on market conditions.
Volume Impulse Signal: Highlights volume spikes that meet or exceed a specified multiplier, which can indicate increased buying or selling interest.
Customizable volume period and multiplier: Allows you to tailor the volume impulse detection based on the instrument’s average volume behavior.
Trend Detection Options: Select different trend detection methods to suit various trading styles and instruments.
SMA50-based detection: Classifies the trend based on the position of price relative to the 50-period SMA.
SMA50 and SMA200 combination: Incorporates a dual-moving average approach, classifying trends based on the relationship between price, SMA50, and SMA200.
Enhanced Visualization: Distinguishes bullish and bearish signals with customizable colors, providing clear and immediate visual cues for easy interpretation.
Custom label colors: Allows you to set distinct colors for bullish, bearish, and neutral signals for quick identification.
Pattern filtering: Enable or disable specific patterns (Bullish, Bearish, or Both) based on your trading preferences.
🔶 Interpreting Indicator
Bullish Engulfing Pattern: Indicates a potential bullish reversal in a downtrend. This signal occurs when a white candlestick with a body size exceeding a specified multiplier completely engulfs the previous black candlestick. The pattern will display a “BE” label below the candle if it meets the criteria, signaling potential upward momentum.
Bearish Engulfing Pattern: Indicates a potential bearish reversal in an uptrend. A black candlestick with a body size exceeding the specified multiplier fully engulfs the previous white candlestick, signaling possible downward movement. The “BE” label appears above the candle to denote this pattern.
Volume Impulse Up: Displays a “VI” label below the candle when the volume surpasses the defined multiplier, and the price closes higher than it opened, indicating strong upward buying interest.
Volume Impulse Down: Displays a “VI” label above the candle when the volume meets or exceeds the specified threshold, and the price closes lower than it opened, signaling strong selling pressure.
Indicator uses the SMA50 and SMA200 to determine trend direction due to their popularity in technical analysis as indicators of medium- and long-term trends. The SMA50 reflects the average price over the past 50 periods, providing insight into intermediate trends, while the SMA200 is often used to identify the broader trend direction. These SMAs help traders quickly assess whether the market is in an uptrend, downtrend, or consolidation phase, enhancing decision-making for both short-term and long-term strategies.
🔶 Disclaimer
Use with Caution: This indicator is provided for educational and informational purposes only and should not be considered as financial advice. Users should exercise caution and perform their own analysis before making trading decisions based on the indicator's signals.
Not Financial Advice: The information provided by this indicator does not constitute financial advice, and the creator (UAlgo) shall not be held responsible for any trading losses incurred as a result of using this indicator.
Backtesting Recommended: Traders are encouraged to backtest the indicator thoroughly on historical data before using it in live trading to assess its performance and suitability for their trading strategies.
Risk Management: Trading involves inherent risks, and users should implement proper risk management strategies, including but not limited to stop-loss orders and position sizing, to mitigate potential losses.
No Guarantees: The accuracy and reliability of the indicator's signals cannot be guaranteed, as they are based on historical price data and past performance may not be indicative of future results.

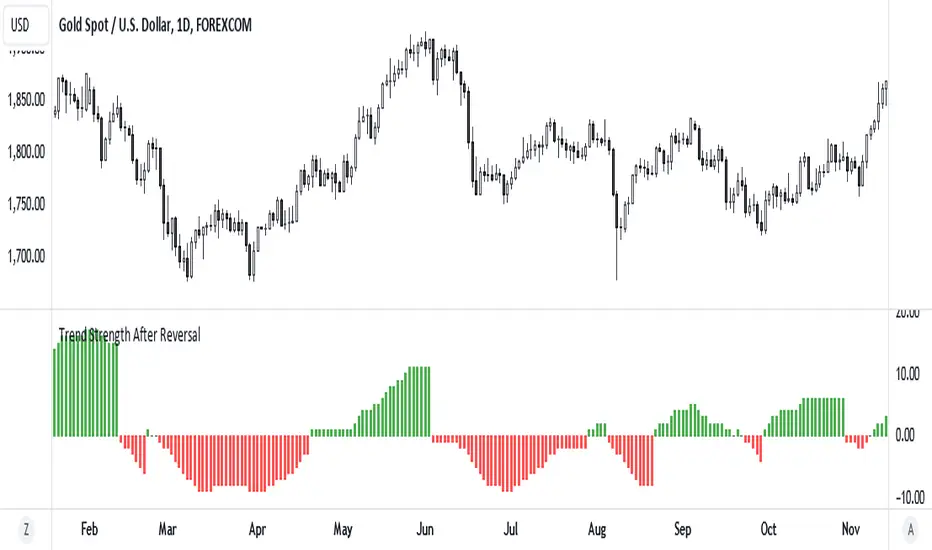
Trend Strength After Reversal
This indicator measures trend strength after the reversal.
It can catch early reversal based on engulfing candlestick pattern or just the regular reversal.
Every reversal have to be confirmed by a close above reversal pattern.
Trend strength is measured by counting subsequent closing confirming the reversal
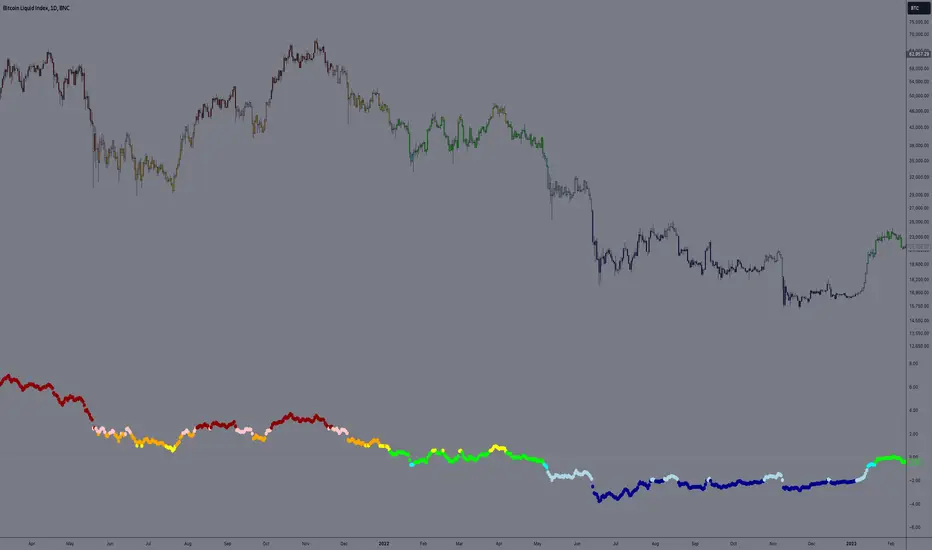
E9 PLRRThe E9 PLRR (Power Law Residual Ratio) is a custom-built indicator designed to evaluate the overvaluation or undervaluation of an asset, specifically by utilizing logarithmic price data and a power law-based model. It leverages a dynamic regression technique to assess the deviation of the current price from its expected value, giving insights into how much the price deviates from its long-term trend.
This indicator is primarily used to detect market extremes and cycles, often used in the analysis of long-term price movements in assets like Bitcoin, where cyclical behavior and significant price deviations are common.
This chart is back from 2019 and shows (From left to right) 2018 Bear market bottom at $3.5k (Dark Blue) , following a peak at 12k (dark red) before the Covid crash back down to EUROTLX:4K (Dark blue)
Key Components
Logarithmic Price Data:
The indicator works with logarithmic price data (ohlc4), which represents the average of open, high, low, and close prices. The logarithmic transformation is crucial in financial modeling, especially when analyzing long-term price data, as it normalizes exponential price growth patterns.
Dynamic Exponent 𝑘:
The model calculates a dynamic exponent k using regression, which defines the power law relationship between time and price. This exponent is essential in determining the expected power law price return and how far the current price deviates from that expected trend.
Power Law Price Return:
The power law price return is computed using the dynamic exponent
k over a defined period, such as 365 days (1 year). It represents the theoretical price return based on a power law relationship, which is used to compare against the actual logarithmic price data.
Risk-Free Rate:
The indicator incorporates an adjustable risk-free rate, allowing users to model the opportunity cost of holding an asset compared to risk-free alternatives. By default, the risk-free rate is set to 0%, but this can be modified depending on the user's requirements.
Volatility Adjustment:
A key feature of the PLRR is its ability to adjust for price volatility. The indicator smooths out short-term price fluctuations using a moving average, helping to detect longer-term cycles and trends.
PLRR Calculation:
The core of the indicator is the calculation of the Power Law Residual Ratio (PLRR). This is derived by subtracting the expected power law price return and risk-free rate from the logarithmic price return, then multiplying the result by a user-defined multiplier.
Color Gradient:
The PLRR values are represented visually using a color gradient. This gradient helps the user quickly identify whether the asset is in an undervalued, fair value, or overvalued state:
Dark Blue to Light Blue: Indicates undervaluation, with increasing blue tones representing a higher degree of undervaluation.
Green to Yellow: Represents fair value, where the price is aligned with the expected power law return.
Orange to Dark Red: Indicates overvaluation, with increasing red tones representing a higher degree of overvaluation.
Zero Line:
A zero line is plotted on the indicator chart, serving as a reference point. Values above the zero line suggest potential overvaluation, while values below indicate potential undervaluation.
Dots Visualization:
The PLRR is plotted using dots, with each dot color-coded based on the PLRR value. This dot-based visualization makes it easier to spot significant changes or reversals in market sentiment without overwhelming the user with continuous lines.
Bar Coloring:
The chart’s bars are colored in accordance with the PLRR value at each point in time, making it visually clear when an asset is potentially overvalued or undervalued.
Indicator Functionality
Cycle Identification : The E9 PLRR is especially useful for identifying cyclical market behavior. In assets like Bitcoin, which are known for their boom-bust cycles, the PLRR can help pinpoint when the market is likely entering a peak (overvaluation) or a trough (undervaluation).
Overvaluation and Undervaluation Detection: By comparing the current price to its expected power law return, the PLRR helps traders assess whether an asset is trading above or below its fair value. This is critical for long-term investors seeking to enter the market at undervalued levels and exit during periods of overvaluation.
Trend Following: The indicator helps users identify the broader trend by smoothing out short-term volatility. This makes it useful for both momentum traders looking to ride trends and contrarian traders seeking to capitalize on market extremes.
Customization
The E9 PLRR allows users to fine-tune several parameters based on their preferences or specific market conditions:
Lookback Period:
The user can adjust the lookback period (default: 100) to modify how the moving average and regression are calculated.
Risk-Free Rate:
Adjusting the risk-free rate allows for more realistic modeling of the opportunity cost of holding the asset.
Multiplier:
The multiplier (default: 5.688) amplifies the sensitivity of the PLRR, allowing users to adjust how aggressively the indicator responds to price movements.
This indicator was inspired by the works of Ashwin & PlanG and their work around powerLaw. Thank you. I hall be working on the calculation of this indicator moving forward to make improvements and optomisations.
Dynamic Touch Trendlines [QuantVue]The Dynamic Touch Trendlines (DTT) indicator automatically draws and manages trendlines on your chart, helping traders identify key support and resistance levels.
What sets the DTT indicator apart from other trendline indicators is its ability to let traders customize the number of touches required to validate a trendline. This flexibility allows you to fine-tune the indicator for different markets or trading styles, ensuring only strong trendlines with the specified number of touches are considered valid.
This indicator features both uptrend lines (drawn from pivot lows) and downtrend lines (drawn from pivot highs), making it suitable for detecting bullish and bearish trends.
An uptrend line connects three (default setting) or more significant lows, showing where price has historically found support. Traders often look for price to bounce off this line during pullbacks in an uptrend.
When price breaks below an uptrend line, it suggests a weakening of the bullish trend. This could mean that buyers are losing strength, and the market may be transitioning into a bearish phase, providing a potential opportunity for traders to enter short positions or exit long positions.
Conversely, a downtrend line connects three (default setting) or more significant highs, indicating potential resistance in a downtrend. Price action below this line can signal continued bearish momentum.
When price breaks above a downtrend line, it indicates a potential reversal of the bearish trend. This can signal the end of selling pressure and the beginning of a new bullish phase, offering traders a potential opportunity to enter long positions.
Key settings:
Minimum Touches: This sets the number of price touches required to validate a trendline. Increasing the minimum touches filters out weaker trends, ensuring that only more reliable trendlines are drawn.
Buffer: The buffer is used to account for minor price overshoots or near misses relative to the trendline. It creates a margin around the trendline, allowing price to come close to the line—whether it overshoots slightly or falls just short—and still count as a valid touch. This helps ensure that small price fluctuations or market noise don’t prevent valid trendline touches from being recognized, making the trendlines more reliable.
Trendline Break Source: Allows traders to define how a trendline is considered broken—either based on the close of the price bar or the wicks (highs and lows) of the price action.
The DTT indicator also features alerts whenever a new trendline is detected or an existing trendline is broken!

Money Flow Index Crossover IndicatorThe "Money Flow Index Crossover Indicator" is a specialized technical analysis tool designed to assist traders by providing a clear visualization of potential buy and sell signals based on the Money Flow Index (MFI) and its smoothed moving average (SMA). This indicator delineates overbought and oversold zones, offering valuable insights into market dynamics. It operates as an oscillator on a separate pane, helping traders identify bullish and bearish market conditions with greater precision. By incorporating k-Nearest Neighbor (KNN) machine learning techniques, this indicator enhances the reliability and accuracy of the signals provided.
Originality and Usefulness:
This script is not just a simple mashup of existing indicators but integrates multiple components to create a unique and comprehensive analysis tool. The combined information from the MFI, its smoothed moving average, and the KNN machine learning techniques influence the form and accuracy of the Money Flow Index Average line and the Smoothed Money Flow Index line giving a visually helpful representation of overbought and oversold conditions. These lines are displayed in an oscillator style crossover, allowing users to visualize potential buy and sell zones for setting up potential signals. The user can adjust various settings of these tools behind the code to fine-tune the behavior and sensitivity of these lines. This integration provides a more robust and insightful trading tool that can adapt to different market conditions and trading styles.
How It Works:
Inputs:
MFI Settings:
Show Signals: Allows users to toggle the display of MFI and SMA crossing signals, which are critical for identifying potential market reversals.
Plot Amount: Determines the number of plots in the heat map, ranging from 2 to 28, enabling customization based on user preference.
Source: Defines the data source for MFI calculations, typically set to OHLC4 for a balanced view of price movements.
Smooth Initial MFI Length: Specifies the smoothing length for the initial MFI calculations to reduce noise and enhance signal clarity.
MFI SMA Length: Sets the length for the SMA used to smooth the MFI average, providing a more stable reference line.
Machine Learning Settings:
Use KInSource: Option to average MFI data by adding a lookback to the source, improving the accuracy of historical comparisons.
KNN Distance Requirement: Defines the distance calculation method for KNN (Max, Min, Both) to refine the data filtering process.
Machine Learning Length: Specifies the amount of machine learning data stored for smoothing results, balancing between responsiveness and stability.
KNN Length: Sets the number of KNN used to calculate the allowable distance range, enhancing the precision of the machine learning model.
Fast and Slow Lengths: Defines the lengths for fast and slow MFI calculations, allowing the indicator to capture different market dynamics.
Smoothing Length: Determines the length at which MFI calculations start for a more smoothed result, reducing false signals.
Variables and Functions:
KNN Function: Filters machine learning data to calculate valid distances based on defined criteria, ensuring more accurate MFI averages.
MFI Calculations: Computes both fast and slow MFI values, applies smoothing, and stores them for KNN processing to refine signal generation.
MFI KNN Calculation: Uses the KNN function to calculate the machine learning average of MFI values, enhancing signal reliability.
MFI Average and SMA: Calculates the average and smoothed MFI values, which are crucial for determining crossover signals.
Calculations:
MFI Values: Calculates current fast and slow MFI values and applies smoothing to reduce market noise.
Storage Arrays: Stores MFI data in arrays for KNN processing, enabling historical comparison and pattern recognition.
KNN Processing: Computes the machine learning average of MFI values using the KNN function, improving the robustness of signals.
MFI Average: Scales the MFI average to fit the heat map and calculates the smoothed SMA, providing a clear visual representation of trends.
Crossover Signals: Identifies bullish (MFI crossing above SMA) and bearish (MFI crossing below SMA) signals, which are key for making trading decisions.
Plots and Visuals:
MFI Average and SMA Lines: Plots the MFI average and smoothed SMA on the chart, allowing traders to easily visualize market trends and potential reversals.
Zones: Defines and plots overbought, neutral, and oversold zones for easy visualization. The recommended settings for these zones are:
Overbought Zone: Level set to approximately 24.6, indicating a potential market top.
Neutral Zone: Level set to 14, representing a balanced market condition.
Oversold Zone: Level set to 5.4, signaling a potential market bottom.
Crossover Marks: Plots circles on the chart to indicate bullish and bearish crossover signals, making it easier to spot entry and exit points.
Visual Alerts:
Bullish and Bearish Alerts: one can see overbought and oversold conditions and up alert conditions for bullish and bearish MFI crossover signals, enabling traders to have access to visual cues when these events are on trajectory to occur and, if they occur, act promptly with the visual representation of its zones.
Why It's Helpful:
The "Money Flow Index Crossover Indicator" provides traders with a sophisticated tool to identify potential buy and sell conditions based on the combined information of the MFI and its smoothed moving average. The KNN machine learning techniques enhance the accuracy of this indicator's clear visual representation of overbought, neutral, and oversold zones. This combination of data represented on the chart helps traders make informed decisions about market conditions. This indicator is particularly useful for traders looking to refine their entry and exit points by leveraging advanced data analysis in respect to overbought and oversold conditions.
Disclaimer:
This indicator is intended to assist traders in making informed decisions based on technical analysis. However, it is not a guarantee of future performance and should be used in conjunction with other analysis techniques and risk management practices. Past performance is not indicative of future results, and traders should exercise caution and perform their own due diligence before making any trading decisions.

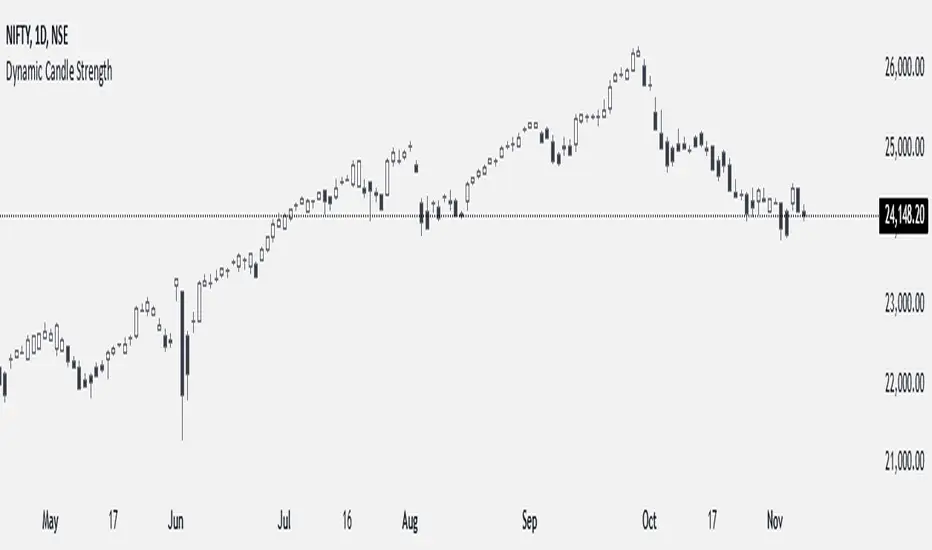
Dynamic Candle StrengthHow It Works
Initialization of Dynamic Levels:
The first candle's high and low are taken as the initial dynamic high and dynamic low levels.
If the next candle's close price is above the dynamic high, the candle is colored green, indicating bullish conditions.
If the next candle's close price is below the dynamic low, the candle is colored black, indicating bearish conditions.
If a candle's high and low crossed both the dynamic high and dynamic low, the dynamic high and low levels are updated to the high and low of that candle, but the candle color will continue with the same color as the previous candle.
Maintaining and Updating Dynamic Levels:
The dynamic high and low are only updated if a candle's close is above the current dynamic high or below the current dynamic low.
If the candle does not close above or below these levels, the dynamic high and low remain unchanged.
Visual Signals:
Green Bars: Indicate that the candle's close is above the dynamic high, suggesting bullish conditions.
Black Bars: Indicate that the candle's close is below the dynamic low, suggesting bearish conditions.
This method ensures that the dynamic high and low levels are adjusted in real-time based on the most recent significant price movements, providing a reliable measure of market sentiment.
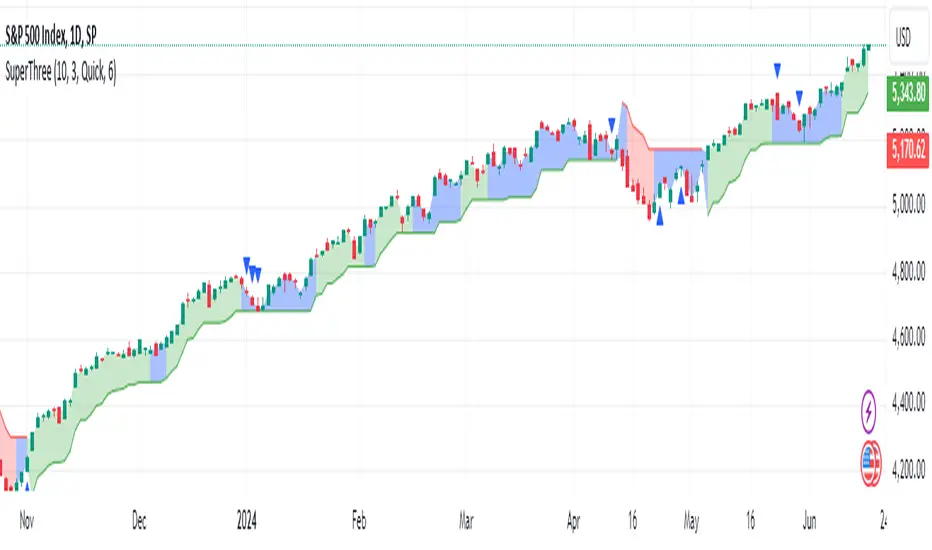
SuperThreeThe SuperThree is a comprehensive technical indicator designed to identify and visualize market trends and counter-trend momentum in trading. It uses a unique color-coding system to represent different market conditions and potential trading opportunities.
Uptrend (Green Fill) : This is indicated by a green fill. An uptrend is a period where prices are increasing overall, suggesting a strong market. It’s an ideal time for traders to consider entering long positions or exiting short positions.
Downtrend (Red Fill) : This is represented by a red fill. A downtrend is a period where prices are decreasing overall, indicating a bearish market. Traders might consider entering short positions or exiting long positions during this phase.
Sideways Trend (Blue Fill) : This is shown by a blue fill. A sideways trend, also known as a horizontal trend, is when the price is relatively stable and not making significant upward or downward movements. It’s often a period of consolidation before the price moves up or down.
Counter-Trend Momentum (Blue Arrows) : Blue arrows indicate counter-trend momentum, which can be a signal to exit trades or look for potential trend reversals. These are crucial points where the market’s momentum is shifting and may be about to move in the opposite direction.
The SuperThree indicator is an enhancement of the Supertrend indicator, providing additional features and visual cues to help traders make informed decisions. However, like all indicators, it should be used in conjunction with other forms of analysis to confirm signals and avoid potential false positives. Always consider your risk tolerance and investment goals before making trading decisions.
Happy trading! 😊
Trend Following Parabolic Buy Sell Strategy [TradeDots]The Trend Following Parabolic Buy-Sell Strategy leverages the Parabolic SAR in combination with moving average crossovers to deliver buy and sell signals within a trend-following framework.
This strategy synthesizes proven methodologies sourced from various trading tutorials available on platforms such as YouTube and blogs, enabling traders to conduct robust backtesting on their selected trading pairs to assess the strategy's effectiveness.
HOW IT WORKS
This strategy employs four key indicators to orchestrate its trading signals:
1. Trend Alignment: It first assesses the relationship between the price and the predominant trendline to determine the directional stance—taking long positions only when the price trends above the moving average, signaling an upward market trajectory.
2. Momentum Confirmation: Subsequent to trend alignment, the strategy looks for moving average crossovers as a confirmation that the price is gaining momentum in the direction of the intended trades.
3. Signal Finalization: Finally, buy or sell signals are validated using the Parabolic SAR indicator. A long order is validated when the closing price is above the Parabolic SAR dots, and similarly, conditions are reversed for short orders.
4. Risk Management: The strategy institutes a fixed stop-loss at the moving average trendline and a take-profit level determinable by a prefixed risk-reward ratio calculated from the moving average trendline. These parameters are customizable by the users within the strategy settings.
APPLICATION
Designed for assets exhibiting pronounced directional momentum, this strategy aims to capitalize on clear trend movements conducive to achieving set take-profit targets.
As a lagging strategy that waits for multiple confirmatory signals, entry into trades might occasionally lag beyond optimal timing.
Furthermore, in periods of consolidation or sideways movement, the strategy may generate several false signals, suggesting the potential need for additional market condition filters to enhance signal accuracy during volatile phases.
DEFAULT SETUP
Commission: 0.01%
Initial Capital: $10,000
Equity per Trade: 70%
Users are advised to adjust and personalize this trading strategy to better match their individual trading preferences and style.
RISK DISCLAIMER
Trading entails substantial risk, and most day traders incur losses. All content, tools, scripts, articles, and education provided by TradeDots serve purely informational and educational purposes. Past performances are not definitive predictors of future results.

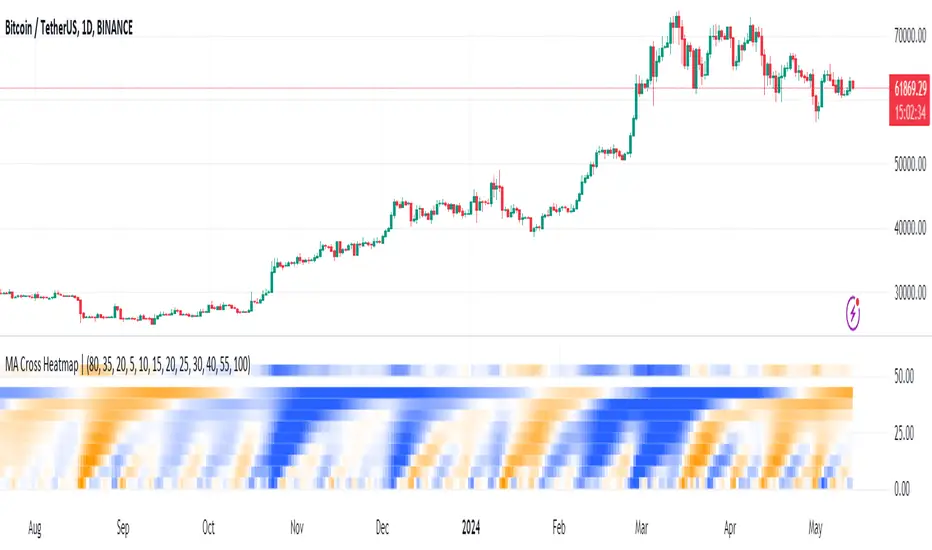
MA Cross HeatmapThe Moving Average Cross Heatmap Created by Technicator , visualizes the crossing distances between multiple moving averages using a heat map style color coding.
The main purpose of this visualization is to help identify potential trend changes or trading opportunities by looking at where the moving averages cross over each other.
Key Features:
Can plot up to 9 different moving average with their cross lengths you set
Uses a heat map to show crossing distances between the MAs
Adjustable settings like crossing length percentage, color scheme, color ceiling etc.
Overlay style separates the heat map from the price chart
This is a unique way to combine multiple MA analysis with a visual heat map representation on one indicator. The code allows you to fine-tune the parameters to suit your trading style and preferences. Worth checking out if you trade using multiple moving average crossovers as part of your strategy.
Multi Timeframe Trend Screener [TradeDots]The "Multi Timeframe Trend Screener" is a trading indicator designed to assist traders in identifying the market trends of multiple assets within a single panel. This tool is invaluable for detecting shifts in trends, enabling traders to easily adjust their strategies under different market conditions.
HOW DOES IT WORK
Upon initialization, the indicator requires users to input two key pieces of information:
The assets to be monitored.
The timeframes to be analyzed.
The tool is capable of simultaneously tracking up to four assets across five distinct timeframes.
By specifying the type and length of the moving average, the indicator uses this data as a baseline to determine the current market trend.
A price movement below the moving average triggers a downward trend symbol (📉), indicating bearish conditions.
Conversely, a movement above the moving average displays an upward trend symbol (📈), signaling bullish conditions.
The aggregation of moving averages across various timeframes provides a comprehensive view of the overall market sentiment.
APPLICATION
In scenarios where the market consistently demonstrates an upward trend, each timeframe will display a bullish symbol. Shifts in market sentiment typically start in the shorter timeframes and can progressively affect longer ones if the trend continues.
This cascading effect allows the indicator to show all timeframes transitioning to a bearish orientation when the trend reverses.
The indicator also facilitates comparison between different assets. For assets with high correlation, a trend shift in one can often predict similar movements in correlated assets, thus allowing traders to swiftly adapt their strategies to align with new market conditions.
RISK DISCLAIMER
Trading entails substantial risk, and most day traders incur losses. All content, tools, scripts, articles, and education provided by TradeDots serve purely informational and educational purposes. Past performances are not definitive predictors of future results.

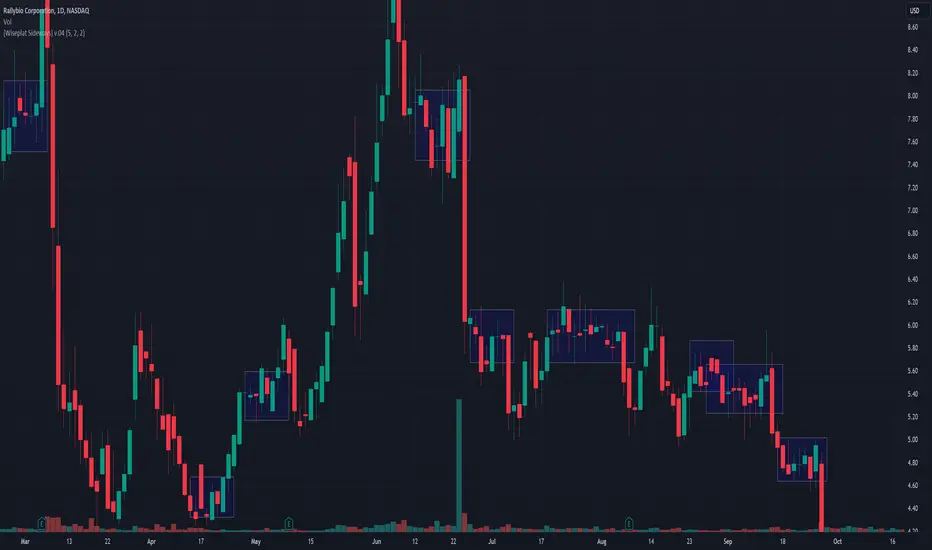
[Wiseplat Sideways] v.04The Sideway indicator for TradingView is a powerful tool designed to identify periods of sideways or ranging price action in the market. With its intuitive interface and customizable parameters, traders can easily spot when an asset is consolidating, providing valuable insights for both trend-following and range-bound strategies.
This indicator utilizes really simple algorithm to analyze price movement and volatility, effectively filtering out noise and false signals. By plotting clear visual cues on the chart.
Traders can adjust the sensitivity parameters to tailor the indicator to their specific trading style and preferences. Whether used in isolation or in conjunction with other technical analysis tools, the Sideway indicator empowers traders to make informed decisions in dynamic market conditions.
Its user-friendly design and simple settings of parameters makes it accessible to traders of all levels, from beginners seeking clarity in choppy markets to seasoned professionals looking for confirmation of their analysis. With the Sideway indicator, traders can confidently navigate sideways price action and stay ahead of the curve in their trading endeavors.
Developer: Oleg Shpagin