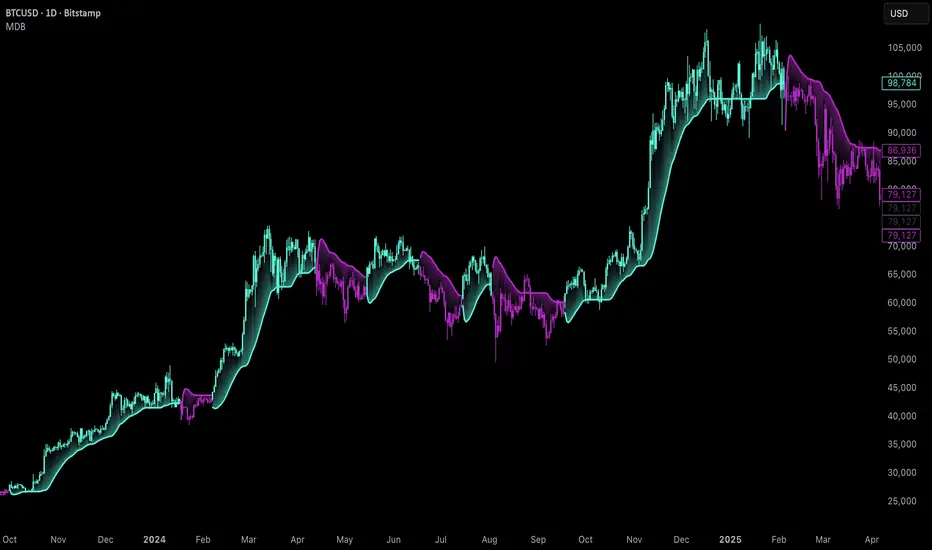
Uptrick: Majors Directional BiasOverview
Uptrick: Majors Directional Bias is a trend-following indicator designed for higher timeframe markets, with a particular focus on the daily chart. It keeps a persistent bullish or bearish stance, highlights confirmed trend flips with one-time markers, and plots a slim, adaptive flow trail that often acts as dynamic support in bullish conditions and resistance in bearish conditions. It is purpose-built for BTC, ETH, and SOL, with safeguards to warn users if applied elsewhere.
Introduction
This indicator was created to simplify trend tracking on higher timeframes. Rather than layering multiple moving averages, oscillators, or external signals, it keeps everything on the price chart itself. Candles are colored by the active stance, a single marker shows the bar where a trend flip is confirmed, and the flow trail follows price closely while adjusting to volatility. For traders working with the daily chart, the trail becomes a practical tool: in an uptrend, it often serves as a natural stop placement zone or structural support, while in a downtrend it behaves like dynamic resistance. The combination of persistence, confirmation, and structure gives traders a clean map of market direction without noise or clutter.
Purpose
The tool is designed to help traders follow medium to long-term market trends rather than react to short intraday moves. Its focus is clarity and continuity — it latches onto a stance and only changes when a new confirmed flip occurs. This makes it suitable for swing traders and position traders who want to stay aligned with the prevailing trend on the daily chart.
Practical uses include identifying trend shifts, entering trades in the direction of the new stance, managing positions by trailing stops along the flow trail, and monitoring pullbacks for whether they respect or break the trail. In this way, the indicator supports both entry timing and ongoing trade management on higher timeframe markets.
Originality and uniqueness
The originality of this script lies in its blend of complexity and simplicity. Internally, it uses multiple filters and layered components to reduce market noise, smooth out erratic fluctuations, and avoid false flips that are common on higher timeframes. Externally, the presentation is deliberately simple: candles are colored by trend, a single marker identifies each confirmed flip, and a slim trail with soft fills shows where the trend structure sits. Many tools either overload traders with information or flicker constantly in uncertain conditions. This script strikes a balance — complex logic works in the background, but what the trader sees is minimal and actionable. Its ability to filter out noise, persist with confidence, and present direction in the simplest terms makes it unique among trend-following overlays.
Why these components were merged
Each component has a clear role in supporting higher timeframe trading. Persistent bias coloring ensures the dominant trend is always visible, making it easy to stay aligned with the market. Flip markers give clarity by identifying the exact bar where the stance shifts, allowing traders to backtest or audit trends quickly. The flow trail provides a structural guide that adapts to volatility: in bull phases it runs under price, often acting as support, while in bear phases it runs above price, often behaving as resistance. Together, these features provide three layers of information in one view — direction, confirmation, and structure — giving traders a reliable framework for swing and position trading on the daily chart.
Step-by-Step
The script determines the dominant trend and locks that stance until an opposite confirmation occurs.
On confirmation of a new trend, a single marker prints on the bar of the flip.
A slim, adaptive trail plots under price in bull phases and above price in bear phases, with a soft fill to reinforce the state.
Price candles are colored by the active stance so the overall direction is always clear.
If the indicator is loaded on assets outside BTC, ETH, or SOL, a warning panel appears to set expectations.
Features
Persistent trend stance
Candles are always bull or bear, with no neutral state. This reduces ambiguity and keeps the trend visible at all times.
One-time flip markers
Markers plot once at the confirmed flip bar, preventing repetitive clutter and making historical review straightforward.
Adaptive flow trail with soft fill
The trail tracks price while adjusting to volatility. In bull trends it acts like dynamic support, in bear trends like dynamic resistance. Traders can use it as a practical stop-loss reference, trailing their risk along the line as the trend progresses.
Noise filtering logic
Internally, the indicator applies multiple filters and components to dampen false signals and avoid unnecessary flips. This is particularly important on higher timeframes, where swings are larger and stability is critical.
Asset-aware design
The indicator is tuned for BTC, ETH, and SOL, with an internal mode that adapts its responsiveness to each. A warning panel appears when used outside these majors.
Overlay-only clarity
Everything is drawn directly on the main chart. The trail gaps at regime changes, fills are soft and non-obstructive, and the overall design emphasizes readability on higher timeframe candles.
Conclusion
The MDB is a higher timeframe trend-following overlay built for BTC, ETH, and SOL, with daily charts as its ideal setting. It combines persistent bias coloring, one-time flip markers, and an adaptive flow trail to give traders direction, confirmation, and structure in the simplest possible form. Internally, it uses complex filtering to reduce noise and maintain reliable signals, but externally it stays minimal and clean. For swing and position traders who want to follow the daily trend with clarity and discipline, this indicator provides a focused solution.
Disclaimer
This indicator is provided for educational and informational purposes only and does not constitute financial advice. Trading involves risk, including the risk of loss. Past performance does not guarantee future results. Always conduct your own analysis and use appropriate risk management.
Trendtrading
Dynamic EMA Stack Support & ResistanceEvery trader needs reliable support and resistance — but static zones and lagging indicators won't cut it in fast-moving markets. This script combines a Fibonacci-based 5-EMA stacking system and left/right pivots that create dynamic support & resistance logic to uncover real-time structural shifts & momentum zones that actually adapt to price action. This isn’t just a mashup — it’s a complete built-from-the-ground-up support & resistance engine designed for scalpers, intraday traders, and trend followers alike.
🧠 🧠 🧠What It Does🧠 🧠 🧠
This script uses two powerful engines working in sync:
1️⃣ EMA Stack (5-EMA Framework)
Built on Fibonacci-based lengths: 5, 8, 13, 21, 34, (configurable) this stack identifies:
🔹 Bullish Stack: EMAs aligned from fastest to slowest (uptrend confirmation)
🔹 Bearish Stack: EMAs aligned inversely (downtrend confirmation)
🟡 Narrowing Zones: When EMAs compress within ATR thresholds → possible breakout or reversal zone
🎯 Labels identify key transitions like:
✅"Begin Bear Trend?"
✅"Uptrend SPRT"
✅"RES?" (resistance test)
2️⃣ Pivot-Based Projection Engine
Using classic Left/Right Bar pivot logic, the script:
📌 Detects early-stage swing highs/lows before full confirmation
📈 Projects horizontal S/R lines that adapt to market structure
🔁 Keeps lines active until a new pivot replaces them
🧩 Syncs beautifully with EMA stack for confluence zones
🎯🎯🎯Key Features for Traders🎯🎯🎯
✅ Trend Detection
→ EMA order reveals real-time bias (bullish, bearish, compression)
✅ Dynamic S/R Zones
→ Historical support/resistance levels auto-draw and extend
✅ Smart Labeling
→ “SPRT”, “RES”, and “Trend?” labels for live context + testing logic
✅ Custom Candle Coloring
→ Choose from Bar Color or Full Candle Overlay modes
✅ Scalper & Swing Compatible
→ Use fast confirmations for scalping or stack consistency for longer trends
⚙️⚙️⚙️How to Use⚙️⚙️⚙️
✅Use Top/Bottom (trend state) Line Colors to quickly read trend conditions.
✅Use Pivot-based support/resistance projections to anticipate where price might pause or reverse.
✅Watch for yellow/blue zones to prepare for volatility shifts/reversals.
✅Combine with volume or momentum indicators for added confirmation.
📐📐📐Customization Options📐📐📐
✅EMA lengths (5, 8, 13, 21, 34) — fully configurable - try 21,34,55, 89, 144 for longer term trend states
✅Left/Right bar pivot settings (default: 21/5)
✅Label size, visibility, and color themes
✅Toggle line and label visibility for clean layouts
✅“Max Bars Back” to control how deep history is scanned safely
🛠🛠🛠Built-In Safeguards🛠🛠🛠
✅ATR-based filters to stabilize compression logic
✅Guarded lookback (max_bars_back) to avoid runtime errors
✅Works on any asset, any timeframe
🏁🏁🏁Final Word🏁🏁🏁
This script is not just a visual tool, it’s a complete trend and structure framework. Whether you're looking for clean trend alignment, dynamic support/resistance, or early warning labels, this system is tuned to help you react with confidence — not hindsight.
Rembember, no single indicator should be used in isolation. For best results, combine it with price action analysis, higher-timeframe context, and complementary tools like trendlines, moving averages etc Use it as part of a well-rounded trading approach to confirm setups — not to define them alone.
💡💡💡Turn logic into clarity. Structure into trades. And uncertainty into confidence.💡💡💡

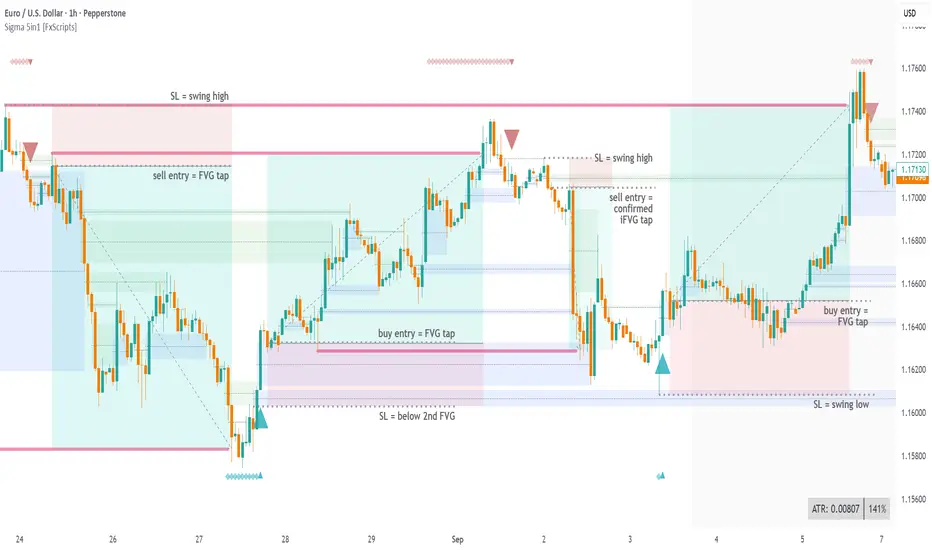
Dynamic EMA x VWAP AlertsDynamic EMA × VWAP Alerts generates buy and sell signals only when an EMA crossover happens in a meaningful VWAP (or standard deviation band) context. By combining classic EMA logic with flexible VWAP anchors (Daily, Weekly, Rolling) and optional advanced filters (ATR, Relative Volume, Deviation, Distance, Time Windows) to trim noise further, the script creates location-aware, filterable alerts rather than “everywhere” crosses. The value for trading and originality here lies in the integration of one or multiple anchors, band gating, combinator logic, and advanced regime filters. It’s designed for use across multiple instruments and timeframes, where EMA/VWAP context is relevant. It can run quietly in the background while you focus on price action and your own S/R levels.
What it does (quick take)
Detects EMA crossovers (double or optional triple) and evaluates them in VWAP context.
Plots Buy/Sell markers only when all chosen conditions are met.
Clean UX: keep all or parts of the engine visible or hide everything and let alerts run based on the silent engine behind your own S/R levels in an uncluttered, practical chart, as illustrated below.
Engine illustration: All selected engines visible
Practical use case: Same snapshot sequence as above but all selected engines invisible
Swing examples (beyond intraday)
Signals-only (clean value view):
Signals + your own S/R lines:
EMA selection (choose your playbook)
Defaults: Fast 9, Medium 21 (common intraday combo).
Modes: Double Cross — Fast vs Medium.
Triple Cross (optional) — adds a Slow EMA trend filter (enable Slow > 0).
Ranges: you can set each EMA 0–200 (0 = hidden/off)
Visuals are optional; you can display or hide each EMA line
EMA cross footprints (optional): Helps you assess trend continuation or change.
Use your own strategy: switch to 9/50, 20/50, 50/200, or whatever EMA set you trust for your instrument/timeframe.
VWAP Selection (the context engine)
Daily VWAP – resets each chart day (00:00–23:59). Typical fit: scalpers and fast intraday decision points.
Weekly VWAP – resets at the start of the calendar week. Typical fit: intraday with higher-timeframe context (aligns day trades with weekly bias).
Rolling VWAP – an adjustable VWMA-based rolling anchor (not session-reset), used as a flexible context reference Typical fit: multi-day swings when you want a flexible anchor that adapts across sessions.
Standard deviation bands (σ ±1/±2/±3) available for each anchor and help you express the “how far from fair value” idea.
Why VWAP matters: it’s a running, volume-weighted anchor where strong moves relative to VWAP and its bands help frame mean-reversion vs. trend-continuation risk. Evaluating crosses relative to VWAP/±σ reduces “everywhere” noise and helps frame potential setups.
How alerts are decided
An alert triggers only when:
Your selected EMA crossover occurs, and
Your chosen VWAP gate(s) and any filters pass. (Computed on bar close to avoid mid-bar noise)
Signals and alerts do not repaint; alerts evaluate and fire once per bar close.
Alert gates (Single / AND / OR)
Select one VWAP source or combine two (e.g., Daily + Weekly) with Single, AND, or OR logic.
Choose gate levels from VWAP or standard deviation bands (±σ). Typical long logic: price at/under VWAP or −σ. Typical short logic: price at/over VWAP or +σ.
Practical recipes:
Trend-follow: Daily AND Weekly at/above VWAP → confirms strength on two anchors.
Mean-reversion probe: Daily OR Rolling at −1σ → allows earlier fades with flexibility.
Advanced filtering: Suitable for advanced/Quant traders
During the research and development of this indicator, the EMA/VWAP cross logic was tested on historical S&P500 Futures data to explore patterns on multiple timeframes. These selected filtering indicators below showed correlation between certain market conditions and chosen indicator thresholds, helping reduce noise and lower-quality alerts. Results were research-oriented and are not predictive of future performance.
Therefore, I have built these indicator filters that run silently in the background. They let you trim noise by requiring alerts to appear only in market regimes you define. Each one constrains alert conditions; using them together helps tailor alerts to your strategy—but overly strict settings may filter out most or all alerts.
Relative Volume (RVOL): compares current volume to a baseline; ensures alerts arrive with participation instead of thin tape.
Deviation Threshold (%): controls how close the cross must be to the VWAP/σ level; tight = anchored signals, loose = more activity.
ATR Gate (+ Relative regime): keeps alerts inside a volatility regime; avoids both dead tape and chaotic spikes.
Distance Guard: requires price to be at least X ticks/% away from VWAP; useful to avoid premature signals near fair value.
Note: It’s not recommended to activate all of them at once or change the values aggressively. Unless you’ve done deeper backtesting or machine learning calibration, you can easily filter out everything. Use small thresholds at first, then adjust to your instrument once you see how each filter changes alert frequency and quality. Advanced/quant users can fine-tune freely.
Case example:
Unfiltered: Timeframe 15 min, EMA Selection 9/21, VWAP gates Rolling (250 bars) OR Weekly
Filtered: Same setup as above + activated filters:
RVOL: 100 bars, Min. RVOL 0.4
Deviation threshold (%): 0.3
ATR Length: 14
Min ATR (%): 0.05
Relative regime: Base length 2000, Min Ratio 0.85, Max Ratio 2
Under the hood
This indicator leans on TradingView built-ins (e.g., EMA, VWMA, ATR, alertcondition) to maximize speed, stability, and compatibility while we implement the custom logic (VWAP anchors, band gating, combinator gates, advanced filters, time windows). Built-ins were easy to work with and reduced edge-case bugs and kept the visuals responsive, while the design gives fine-tuning and clean visuals—so both discretionary traders and quant-minded users can shape the alerts to their strategy and workflow.
Disclaimer
The tools, scripts, and indicators presented here are provided for educational and informational purposes only. They are not financial advice and should not be interpreted as investment recommendations, trading signals, or a solicitation to buy or sell any financial instrument.
All forms of trading and investing involve risk. The past performance of any security, strategy, or market condition does not guarantee future outcomes. Users are solely responsible for their own trading and investment decisions, including evaluating their financial situation, objectives, and risk tolerance.
By using this indicator, you acknowledge that you do so at your own risk. The author accepts no liability for any direct or indirect loss or damage—including, without limitation, loss of profits—that may arise from the use of, or reliance upon, this tool.

EMA / WMA RibbonMomentum Flow Ribbon
Unlock a clear, visual edge in identifying short-term momentum shifts with the Momentum Flow Ribbon.
This indicator was born from a simple yet powerful concept: to visually represent the dynamic relationship between a fast-reacting Exponential Moving Average (EMA) and the smoother, more methodical Wilder's Moving Average (WMA). While both moving averages use the same length, their unique calculation methods cause them to separate and cross, creating a "ribbon" that provides an immediate and intuitive gauge of market momentum.
This tool is designed for the disciplined trader who values clean charts and actionable signals, helping you to execute your strategies with greater confidence and precision.
How It Works
The script plots an EMA and a Wilder's Moving Average (referred to as rma in Pine Script) of the same length. The space between these two lines is then filled with a colored ribbon:
Bullish Green/Teal: The ribbon turns bullish when the faster EMA crosses above the slower Wilder's MA, indicating that short-term momentum is strengthening to the upside.
Bearish Red: The ribbon turns bearish when the EMA crosses below the Wilder's MA, signaling that short-term momentum is shifting to the downside.
The inherent "lag" of the Wilder's MA, a feature designed by J. Welles Wilder Jr. himself, acts as a steady baseline against which the more sensitive EMA can be measured. The result is a simple, zero-lag visual that filters out insignificant noise and highlights meaningful changes in trend direction.
Key Features
Customizable Length and Source: Easily adjust the moving average length and price source (close, hl2, etc.) to fit your specific trading style and the instrument you are trading, from futures like MES and MNQ to cryptocurrencies and forex.
Customizable Colors: Tailor the ribbon's bullish and bearish colors to match your personal chart aesthetic.
Built-in Alerts: The script includes pre-configured alerts for both bullish (EMA crosses above WMA) and bearish (EMA crosses below WMA) signals. Never miss a potential momentum shift again.
Clean & Lightweight: No clutter. Just a simple, effective ribbon that integrates seamlessly into any trading system.
Practical Application for the Discerning Trader
For a futures trader, timing is everything. This ribbon is not just another indicator; it's a tool for confirmation.
Imagine you've identified a key level—a Volume Profile POC, the previous day's low, or a critical accumulation zone. As price approaches this level pre-London session, you're watching for a sign of institutional activity. A flip in the ribbon's color at that precise moment can provide the powerful confirmation you need to enter a trade, trusting that you are aligning with the building liquidity and momentum heading into the New York open.
This is a tool for those who aspire to greatness in their trading—who understand that the edge is found not in complexity, but in the flawless execution of a simple, well-defined plan.
Add the Momentum Flow Ribbon to your chart and start seeing momentum in a clearer light.

PowerDelta Oscillator [FxScripts]PowerDelta Oscillator
The PowerDelta Oscillator measures real-time buying and selling pressure using the proprietary PowerDelta Algorithm. By quantifying order flow, it identifies whether the market conditions favor bullish or bearish activity, helping traders determine directional bias for both trend and countertrend setups.
Calculation Methodology
The PowerDelta computes the delta (difference) between buying and selling pressure by integrating both price movement and volume behavior rather than relying solely on volume or price-based approximations like other oscillators.
The PowerDelta Algorithm evaluates six core price-volume conditions:
Price advancing with increasing volume
Price advancing with decreasing volume
Price consolidating with increasing volume
Price consolidating with decreasing volume
Price declining with increasing volume
Price declining with decreasing volume
From these conditions, the algorithm derives:
Accumulation vs Distribution phases
Buyer/Seller exhaustion points
Effort vs No Result scenarios (volume pressure failing to move price)
Operational Use
The PowerDelta Oscillator has three operational modes:
Trend
Countertrend
Blended (Trend/Countertrend hybrid)
Trend Mode
In Trend Mode, the indicator plots an oscillator that fluctuates between positive and negative values:
Positive readings indicate dominant buying pressure
Negative readings indicate dominant selling pressure
The magnitude of the reading reflects the intensity of the pressure
Crossovers at the zero line provide directional shifts:
Negative → Positive: bullish transition
Positive → Negative: bearish transition
Additionally:
Sustained positive values indicate control by buyers, long bias is favoured
Sustained negative values indicate control by sellers, short bias is favoured
The magnitude of displacement from zero provides additional confirmation of market strength or weakness
Countertrend Mode
In Countertrend Mode, the primary use of the PowerDelta Oscillator is to locate divergences between price and the oscillator (as visualised on the chart above) which helps traders pinpoint potential reversals
The oscillator is much more sensitive in this mode, making highs, lows and hence divergences, easier to spot
Like Trend Mode, the magnitude of displacement from zero provides additional confirmation of market strength or weakness
The various Analytical Scenarios detailed below provide detailed use cases for both Trend and Countertrend Mode
Blended Mode
To provide maximum flexibility, there’s also a third Blended Mode
This mode combines elements of the two primary modes and can be used as part of a hybrid approach making it easier to spot both trends and reversals
Alternative Source
The PowerDelta algorithm utilises volume data therefore it’s best to use the most reliable source of volume data for the instrument being traded
For instance, whilst XAUUSD provides excellent results with most forex brokers, slightly better results may be achieved using GC futures data which comes direct from the exchange (data package required)
To use a third-party source, select 'Alternative' and input the relevant source
This can also be used as a way to monitor correlated pairs by adding two instances of the PowerDelta to the same chart, selecting pair 1 e.g. EURUSD as the first instance and the correlated pair e.g. USDCHF as the second instance
Thorough backtesting advised
Analytical Scenarios
Accumulation: High positive oscillator readings combined with upward price movement suggest active accumulation.
Optimal strategy: Monitor pullbacks for potential long entries or wait for a divergence with price and potential reversal.
Distribution: High negative oscillator readings with downward price movement indicate distribution.
Optimal strategy: Monitor pullbacks for potential short entries or wait for a divergence with price and potential reversal.
Buyer Exhaustion: Price forms higher highs while oscillator value declines. Indicates weakening buying strength and potential bearish reversal.
Seller Exhaustion: Price forms lower lows while oscillator value contracts. Indicates weakening selling strength and potential bullish reversal.
Effort / No Result (Buyers): Positive oscillator expansion without higher highs indicates aggressive buying without price confirmation, suggesting overbought conditions and a potential bearish reversal.
Effort / No Result (Sellers): Negative oscillator expansion without lower lows indicates aggressive selling without price confirmation, suggesting oversold conditions and a potential bullish reversal.
Alerts
To trigger alerts when market bias transitions across the zero line:
Right-click on chart → Add Alert on PowerDelta
Condition: PowerDelta → Select Mode
Type: Crossing
Value: 0
Execution: Once Per Bar Close
Adjust additional parameters as required
Performance and Optimization
Backtesting Results: The PowerDelta Oscillator has undergone extensive backtesting across various instruments, timeframes and market conditions, demonstrating strong performance in identifying strong trends and reversals. User backtesting is strongly encouraged as it allows traders to optimize settings for their preferred instruments and timeframes.
Optimization for Diverse Markets: The PowerDelta Oscillator can be used on crypto, forex, indices, commodities and stocks. The PowerDelta Oscillator's algorithmic foundation ensures consistent performance across a variety of instruments. The Trend, Countertrend and Blended Modes make it easy for the trader to set up based on their individual trading style.
Educational Resources and Support
Users of the PowerDelta Oscillator benefit from comprehensive educational resources and full access to FxScripts Support. This ensures traders can maximize the potential of the PowerDelta Oscillator and other tools in the Sigma Indicator Suite by learning best practices and gaining insights from an experienced team of traders.

Algorithmic Kalman Filter [CRYPTIK1]Price action is chaos. Markets are driven by high-frequency algorithms, emotional reactions, and raw speculation, creating a constant stream of noise that obscures the true underlying trend. A simple moving average is too slow, too primitive to navigate this environment effectively. It lags, it gets chopped up, and it fails when you need it most.
This script implements an Algorithmic Kalman Filter (AKF), a sophisticated signal processing algorithm adapted from aerospace and robotic guidance systems. Its purpose is singular: to strip away market noise and provide a hyper-adaptive, self-correcting estimate of an asset's true trajectory.
The Concept: An Adaptive Intelligence
Unlike a moving average that mindlessly averages past data, the Kalman Filter operates on a two-step principle: Predict and Update.
Predict: On each new bar, the filter makes a prediction of the true price based on its previous state.
Update: It then measures the error between its prediction and the actual closing price. It uses this error to intelligently correct its estimate, learning from its mistakes in real-time.
The result is a flawlessly smooth line that adapts to volatility. It remains stable during chop and reacts swiftly to new trends, giving you a crystal-clear view of the market's real intention.
How to Wield the Filter: The Core Settings
The power of the AKF lies in its two tuning parameters, which allow you to calibrate the filter's "brain" to any asset or timeframe.
Process Noise (Q) - Responsiveness: This controls how much you expect the true trend to change.
A higher Q value makes the filter more sensitive and responsive to recent price action. Use this for highly volatile assets or lower timeframes.
A lower Q value makes the filter smoother and more stable, trusting that the underlying trend is slow-moving. Use this for higher timeframes or ranging markets.
Measurement Noise (R) - Smoothness: This controls how much you trust the incoming price data.
A higher R value tells the filter that the price is extremely noisy and to be more skeptical. This results in a much smoother, slower-moving line.
A lower R value tells the filter to trust the price data more, resulting in a line that tracks price more closely.
The interaction between Q and R is what gives the filter its power. The default settings provide a solid baseline, but a true operator will fine-tune these to perfectly match the rhythm of their chosen market.
Tactical Application
The AKF is not just a line; it's a complete framework for viewing the market.
Trend Identification: The primary signal. The filter's color code provides an unambiguous definition of the trend. Teal for an uptrend, Pink for a downtrend. No more guesswork.
Dynamic Support & Resistance: The filter itself acts as a dynamic level. Watch for price to pull back and find support on a rising (Teal) filter in an uptrend, or to be rejected by a falling (Pink) filter in a downtrend.
A Higher-Order Filter: Use the AKF's trend state to filter signals from your primary strategy. For example, only take long signals when the AKF is Teal. This single rule can dramatically reduce noise and eliminate low-probability trades.
This is a professional-grade tool for traders who are serious about gaining a statistical edge. Ditch the lagging averages. Extract the signal from the noise.

Sigma Reversal Print [FxScripts]Indicator Overview
The Sigma Reversal Print is a powerful tool designed for traders who like to trade reversal strategies plus trend traders looking to enter on strong pullbacks. It integrates advanced price action with volume analysis, highlighting areas where a trend reversal or pullback may be in progress, providing insights into where markets may be exhausted or about to surge.
Key Features and Functionality
Reversal Trading: Tailored primarily for reversal traders, the Sigma Reversal Print highlights zones where the market is likely to change direction. While this approach offers significant potential, it inherently carries a degree of risk due to the precision required in predicting market turning points. The Sigma Reversal Print uses advanced methodology to forecast such reversals with a high degree of accuracy.
Signal Generation Based on Reversal and Pullback Zones: The Reversal Print generates signals when price enters specific conditions, representing exhaustion followed by a change in order flow. These conditions allow the indicator to filter out low-probability signals and focus on those with higher potential for a trend change.
Settings
Sensitivity Control: The sensitivity setting allows traders to adjust the strength of the pattern required for a signal to be generated. The scale ranges from 2-10 with higher sensitivity demanding more confirmation, leading to fewer, generally more reliable, signals however backtesting is highly recommended. Adjusting the sensitivity enables traders to balance early entries with signal accuracy, accommodating both aggressive and more conservative strategies.
Customizable Length: The length setting allows users to fine-tune the calculation period, adjusting the indicator’s responsiveness to overall market conditions. Adjusting length allows the Reversal Print to adapt to the user’s trading style and timeframe of choice. Similar to the sensitivity control, the scale ranges from 2-10 with a higher length demanding more confirmation. This can lead to fewer, often more reliable, signals however, once again, backtesting is highly recommended.
Advanced Filters
Opening Gap Filter: Turning this on allows the system to avoid painting false signals that can be triggered by the daily or weekly opening gap at market open. This setting is toggled on by default.
Price Filter: This filter applies an additional weighted price action algorithm to the signal being painted thus further filtering out weaker signals. Warning dots will still paint however the larger break arrow will no longer paint if the filter is triggered. This setting is toggled on by default.
Volume Filter: This filters out low volume entries which have a lower probability of turning into successful trades. Variable from 1-10 with 1 being the most lenient and 10 the most stringent. Warning dots will still paint however the larger break arrow will no longer paint if the filter is triggered. This setting is toggled on by default.
Alerts
Configure alerts and receive notifications when the first warning dot in a sequence appears (the series of dots seen on the chart) and again when a breakpoint is triggered (the larger arrow on the chart). This feature is particularly beneficial for traders who like to monitor multiple instruments or prefer not to stare at a screen all day.
Performance and Optimization
Backtesting Results: The Reversal Print has undergone extensive backtesting across various instruments, timeframes and market conditions, demonstrating strong performance in identifying reversal points, particularly during volatile or overextended price movements. User backtesting is strongly encouraged as it allows traders to optimize settings for their preferred instruments and timeframes.
Optimization for Diverse Markets: The Reversal Print can be used on crypto, forex, indices, commodities or stocks. The Reversal Print's algorithmic foundation ensures consistent performance across a variety of instruments. Key settings such as Sensitivity and Length will require adjustment based on the volatility and characteristics of each market.
Educational Resources and Support
Users of the Sigma Reversal Print benefit from comprehensive educational resources and full access to FxScripts Support. This ensures traders can maximize the potential of the Reversal Print and other tools in the Sigma Indicator Suite by learning best practices and gaining insights from an experienced team of traders.
Summary
The Reversal Print is a powerful and adaptable tool for reversal and pullback traders, combining statistical analysis and price action to identify high-probability turning points. Its advanced customization options, flexible controls and integration with the Sigma Indicator Suite offer significant advantages over standard indicators. By pinpointing precise entry points, the Reversal Print enables traders to make informed trading decisions with confidence.
BUY & SELL Probability (M5..D1) - MTFMTF Probability Indicator (M5 to D1)
Indicator — Dual Histogram with Buy/Sell Labels
This indicator is designed to provide a probabilistic bias for bullish or bearish conditions by combining three different analytical components across multiple timeframes. The goal is to reduce noise from single-indicator signals and instead highlight confluence where trend, momentum, and strength agree.
Why this combination is useful
- EMA(200) Trend Filter: Identifies whether price is trading above or below a widely used long-term moving average.
- MACD Momentum: Detects short-term directional momentum through line crossovers.
- ADX Strength: Measures how strong the trend is, preventing signals in weak or flat markets.
By combining these, the indicator avoids situations where one tool signals a trade but others do not, helping to filter out low-probability setups.
How it works
- Each timeframe (M5, M15, H1, H4, D1) generates its own trend, momentum, and strength score.
- Scores are weighted according to user-defined importance and then aggregated into a single probability.
- Proximity to recent support and resistance levels can adjust the final score, accounting for nearby barriers.
- The final probability is displayed as:
- Histogram (subwindow): Green bars for bullish probability >50%, red bars for bearish <50%.
- On-chart labels: Showing exact buy/sell percentages on the last bar for quick reference.
Inputs
- EMA length (default 200), MACD settings, ADX period.
- Weights for each timeframe and component (trend, momentum, strength).
- Optional boost for the chart’s current timeframe.
- Smoothing length for probability values.
- Lookback period for support/resistance adjustment.
How to use it
- A green histogram above zero indicates bullish probability >50%.
- A red histogram below zero indicates bearish probability >50%.
- Neutral readings near 50% show low confluence and may be best avoided.
- Users can adjust weights to emphasize higher or lower timeframes, depending on their trading style.
Notes
- This script does not guarantee profitable trades.
- Best used together with price action, volume, or additional confirmation tools.
- Signals are calculated only on closed bars to avoid repainting.
- For testing and learning purposes — not financial advice.

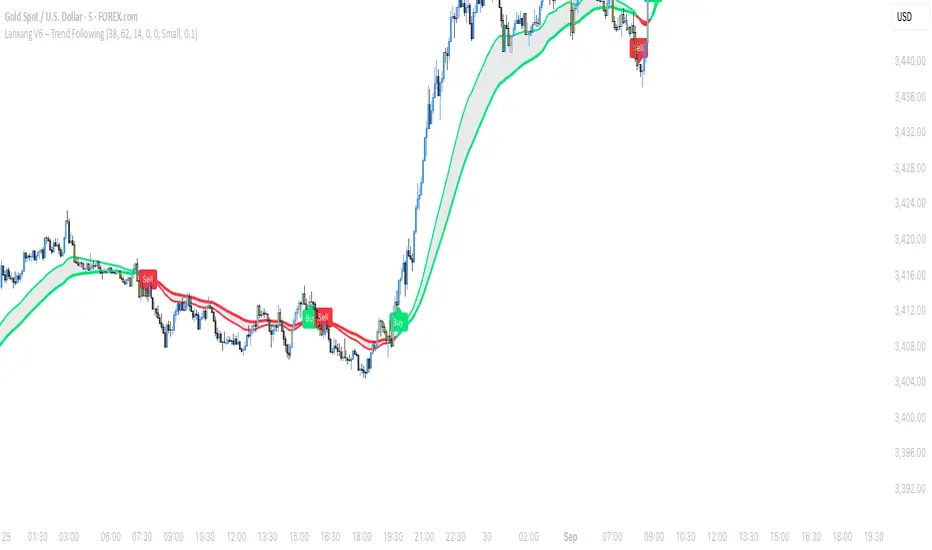
Lanxang V6 – Trend FollowingLanxang V6 – Trend Following
The Lanxang V6 is a clean and simple trend-following tool that helps traders stay aligned with the market’s direction and catch key momentum shifts.
🔑 Features
- Trend Direction – The system colors moving averages and chart areas to make bullish and bearish trends easy to spot at a glance.
- Clear Buy/Sell Tags – When the market shifts direction, the indicator plots Buy or Sell tags directly on the chart for quick confirmation.
- Pullback Highlights – Bars are marked to signal potential continuation setups during trending conditions.
- Custom Visuals – Traders can adjust tag size, padding, and colors to match their chart style.
- Alerts – Real-time alerts for Buy/Sell signals keep you notified of trend changes without watching the screen all the time.
📈 How to Use
- Follow the Trend: Use the trend color as your main directional bias (green for bullish, red for bearish).
- Entry Signals: Take Buy/Sell tags as confirmation points when the trend shifts.
- Pullback Opportunities: Highlighted bars may indicate continuation trades within the existing trend.
- Risk Management: Always confirm with your own analysis and manage risk properly.
⚠️ Disclaimer: This tool is for educational purposes only and does not guarantee results. Always test on demo before applying to live trading.
Lao Version below:
Lanxang V6 ແມ່ນເຄື່ອງມື ຕິດຕາມແນວໂນ້ມ ທີ່ອອກແບບມາໃຫ້ຊ່ວຍນັກລົງທຶນມອງເຫັນທິດທາງຂອງຕະຫຼາດ ແລະ ຈັບໂອກາດໃນການເຄື່ອນໄຫວສໍາຄັນໄດ້ຊັດເຈນຂຶ້ນ.
🔑 ຄຸນນະສົມບັດ
- ການກໍານົດແນວໂນ້ມ – ລະບົບຈະສະແດງສີເສັ້ນ Moving Average ແລະ ພື້ນຫຼັງໃນການຊັດເຈນທັນທີ (ຂຽວ = ແນວໂນ້ມຂຶ້ນ, ແດງ = ແນວໂນ້ມລົງ).
- ສັນຍານ Buy/Sell ຊັດເຈນ – ເມື່ອຕະຫຼາດປ່ຽນທິດທາງ ໂຕຊີ້ Buy ຫຼື Sell ຈະປາກົດໃນກາຟ.
- ການເນັ້ນແທ່ງ Pullback – ກ່ອນຈະໄປຕໍ່ແນວໂນ້ມ ບາງແທ່ງຈະຖືກເນັ້ນເພື່ອໃຫ້ເຫັນໂອກາດໃນການເຂົ້າ.
- ການປັບແຕ່ງຮູບແບບ – ປັບຂະໜາດ ແລະ ສີຂອງສັນຍານໄດ້ຕາມຄວາມຕ້ອງການ.
- Alert ແບບ Real-time – ຮັບແຈ້ງເຕືອນທັນທີເມື່ອມີສັນຍານ Buy/Sell.
📈 ວິທີໃຊ້
- ຕິດຕາມແນວໂນ້ມ: ໃຊ້ສີຂອງເສັ້ນເພື່ອກໍານົດທິດທາງ (ຂຽວ = ຂຶ້ນ, ແດງ = ລົງ).
- ສັນຍານເຂົ້າ: ຕິດຕາມສັນຍານ Buy/Sell ທີ່ປາກົດໃນກາຟ.
- ໂອກາດ Pullback: ແທ່ງທີ່ເນັ້ນອາດຈະບອກໂອກາດໃນການເຂົ້າຕໍ່ຕາມແນວໂນ້ມ.
- ຈັດການຄວາມສ່ຽງ: ຢ່າລືມກວດສອບກັບການວິເຄາະຂອງຕົນເອງ ແລະ ຈັດການຄວາມສ່ຽງໃຫ້ດີ.
⚠️ ຄໍາເຕືອນ: ເຄື່ອງມືນີ້ເປັນໄວ້ໃຊ້ເພື່ອການສຶກສາ ແລະ ບໍ່ຮັບປະກັນຜົນກໍາໄລ. ກ່ອນນໍາໃຊ້ໃນບັນຊີຈິງ ຄວນທົດສອບໃນ Demo ກ່ອນ.
𝑨𝒔𝒕𝒂𝒓 - HelAstar – Hel is an adaptive ATR stop system that finds the best ATR length in real time.
@v1.0
Optimizes ATR length automatically within a defined range
Plots dynamic long/short stops with ATR multiplier
Option to use Super Smoother (FFT-lite) filtering
On-chart stats table with performance & win probability
Lightweight, efficient, and no repainting

Sectoral Stock Top-to-Down Screener : ⭐ Sectoral Stock Top-to-Down Screener Analysis ⭐
This Screener indicator provides a bird's-eye view of the Market's important indices, sectors and Stocks listed in those sectors.
1: It represents a Screener Table that shows the (%) percentage change of the market, Sectors and all the Stocks (listed via input) . The color represents the Trend of the Previous day and the current day compared to Nifty50 Index.
2: The %percentage change is dependent on the Time-Frame selection:
This Input allows users to look at the Major Index > sectors > stocks in their specific time frame.
3: It has a alert function, which can trigger for all symbols/securities in the table.
Irrespective of Trading View Free or Paid user, this alert works for all .
4: Compatible with All Devices (Laptop / Mobile / Tablet / PC)

ATR% | Volatility NormalizerThis indicator measures true volatility by expressing the Average True Range (ATR) as a percentage of price. Unlike basic ATR plots, which show raw values, this version normalizes volatility to make it directly comparable across instruments and timeframes.
How it works:
Uses True Range (High–Low plus gaps) to capture actual market movement.
Normalizes by dividing ATR by the chosen price base (default: Close).
Multiplies by 100 to output a clean ATR% line.
Smoothing is flexible: choose from RMA, SMA, EMA, or WMA.
Optional Feature:
For comparison, you can toggle an auxiliary line showing the average absolute close-to-close % move, highlighting the difference between simplified and true volatility.
Why use it:
Track regime shifts: identify when volatility expands or contracts in % terms.
Compare volatility across different markets (equities, crypto, forex, commodities).
Integrate into risk management: position sizing, stop placement, or volatility filters for entries.
Interpretation:
Rising ATR% → expanding volatility, potential breakouts or unstable ranges.
Falling ATR% → contracting volatility, possible consolidation or range-bound conditions.
Sudden spikes → market “shocks” worth paying attention to.

Futures Confluence Delta (FCD) - Histogram
The Futures Confluence Delta (FCD) Histogram is a powerful trend-following indicator tailored for scalping futures on 1-minute charts. Displayed in a bottom panel like RSI or volume, it visualizes cumulative volume delta to identify bullish or bearish market momentum. The histogram turns green for positive delta (buying pressure, suggesting a long trend) and red for negative delta (selling pressure, indicating a short trend), providing quick insight into market direction.
This indicator is ideal for futures traders seeking confluence with other tools, such as VWMA or order block strategies. It uses a simple yet effective delta calculation (buy volume for up candles, sell volume for down candles, smoothed with EMA) to highlight trend strength, making it perfect for fast-paced scalping environments.
Key Features:
Cumulative Delta Histogram: Tracks buying vs. selling pressure, smoothed with an EMA for clarity.
Color-Coded Trend Signals: Green for bullish (long) trends, red for bearish (short) trends.
Customizable Settings: Adjust the delta lookback period and enable/disable daily reset for flexibility.
Optimized for 1-minute charts on futures.
Alert Support: Set alerts for trend changes to stay ahead of market shifts.
How to Use:
Add the indicator to your 1-minute chart. Observe the histogram in the bottom panel:
Green bars (positive delta) suggest a bullish trend, favoring long entries.
Red bars (negative delta) indicate a bearish trend, favoring short entries.
Combine with other indicators (e.g., VWMA, order blocks, or FVGs) for confluence.
Set alerts for trend changes via the FCD Long Trend or FCD Short Trend conditions.
Adjust settings (delta lookback, daily reset) to match your trading style.
Settings:
Delta Lookback Period (default: 14): Controls the EMA smoothing of the delta. Lower values increase sensitivity; higher values smooth trends.
Reset Delta Daily (default: true): Resets cumulative delta at the start of each trading day for futures session alignment.
Long Color (default: green): Color for bullish delta.
Short Color (default: red): Color for bearish delta.
Notes:
Ensure sufficient historical data (500+ bars) for accurate delta calculations.
Test on NQ for higher volatility, as it may show stronger delta signals compared to GC or ES.
Check the Pine Logs pane (“More” > “Pine Logs”) for any NA data issues if the histogram doesn’t display.
Share your feedback or suggestions in the comments!

Market State Momentum OscillatorMarket State Momentum Oscillator (MSMO)
Overview
The MSMO combines three elements in one panel:
Momentum oscillator (gray/blue area with aqua signal line)
Market State filter (green/red background area)
Money Flow Index (orange line)
Works on all markets and all timeframes. Non-repainting at bar close.
Colors and meaning
Gray area: Momentum above 0 (bullish bias)
Blue area: Momentum below 0 (bearish bias)
Aqua line: Signal line smoothing the oscillator
Green background: Market state bullish (price above moving average)
Red background: Market state bearish (price below moving average)
Orange line: Money Flow Index (volume-weighted momentum)
How to use
Always wait for confirmation of the green or red market state before acting.
Trend alignment: Watch the slope of the Weekly and Daily 200 MA and Weekly and Daily 50 MA to understand higher-timeframe trend direction. Trade only in alignment with the broader trend.
Entries:
Long: Green state + gray histogram rising + MFI trending up
Short: Red state + blue histogram falling + MFI trending down
Exits: Histogram crossing back through 0, or state background flips against the position.
Users can add chart alerts on plot crossings if needed.
Inputs
Lengths for oscillator pivot, signal smoothing, state moving average, trend weight, return %, and Money Flow Index. Defaults work for most charts.
Note
Educational use only. Not financial advice.
Tags
trend, oscillator, market state, momentum, money flow, crypto, forex, stocks, indices, futures

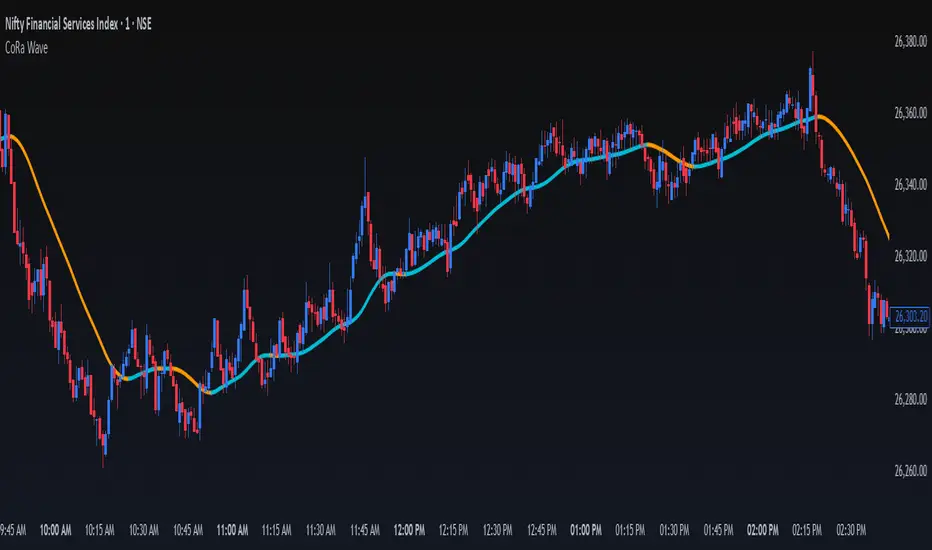
ConeWave MACoRa Wave is a custom-weighted moving average designed to adapt intelligently to market dynamics. It builds upon the foundational logic of the Comp_Ratio_MA by @redktrader, incorporating a compound ratio-based weighting curve that emphasizes recent price action while preserving smoothness and structure with pinescript version 6.
This version introduces modular enhancements, including:
A Comp Ratio Multiplier for fine-tuned responsiveness
Optional Auto Smoothing based on wave length
Streamlined plotting for clarity and performance
Whether you're confirming market structure, identifying trend shifts, or seeking a cleaner alternative to noisy indicators, CoRa Wave offers a visually intuitive and mathematically elegant solution.
🛠 Reimagined by @atulgalande75 — optimized for traders who value precision, adaptability, and clean charting. Original concept by @redktrader.
MaxAlgo - HTF Bias TableHTF Bias Tracker
Overview
The HTF Bias Tracker is a custom indicator designed to help traders monitor higher time frame (HTF) market biases while trading on lower time frames. It provides a clear visual table displaying the bias (bullish, bearish, mixed, or neutral) based on whether the current HTF candle has broken the high or low of the previous HTF candle. Additionally, it shows the current candle's condition (bullish or bearish based on close relative to open). This tool is particularly useful for multi-timeframe analysis, allowing traders to align lower time frame entries with higher time frame trends without switching charts.
The indicator does not generate buy/sell signals but offers contextual bias information to inform trading decisions. It is built for flexibility, supporting up to 5 customizable time frames (default: 1H, 4H, Daily, Weekly, Monthly) and can be used on any chart time frame.
How It Works
For each selected higher time frame (HTF):
Bias Calculation (H/L Break Column):
The indicator checks if the current HTF candle's high has exceeded the previous HTF candle's high (bullish break) or if the low has fallen below the previous HTF candle's low (bearish break).
Bullish: Current high > previous high (no low break).
Bearish: Current low < previous low (no high break).
Mixed: Both high and low breaks occur.
Neutral: No breaks yet. In this case, the text is colored based on the last completed break from the prior candle (green for bullish, red for bearish, orange for mixed) to maintain context.
Candle Condition (Candle Column):
Determines if the current HTF candle is bullish (close > open) or bearish (close <= open).
The results are displayed in a table with arrows (↑ for bullish, ↓ for bearish, ↔ for mixed) and color-coded text for quick readability.
The bias updates in real-time as the HTF candle develops, but final confirmation occurs at the HTF candle close.
This logic is rooted in price action principles: breaking a previous candle's extreme often indicates momentum. For example, historical data across various markets shows that when a candle takes the low of the previous candle, there's approximately a 70% probability it closes bearish (and vice versa for highs closing bullish). This can help gauge the likelihood of trend continuation, but results vary by asset, time frame, and market conditions—always backtest for your setup.
Features
Customizable Time Frames: Select up to 5 HTFs via inputs (e.g., "60" for 1H, "D" for Daily). Leave blank to disable.
Table Display: A compact table shows TF, H/L Break bias, and Candle condition. Includes headers for clarity.
Visual Enhancements: Color-coded text (green for bullish, red for bearish, orange for mixed, gray for neutral without prior bias). Arrows provide at-a-glance direction.
User Options:
Table Background Color: Adjust transparency and color for better visibility.
Table Position: Choose from 9 positions (e.g., Bottom Right default).
Border Width (Padding): Increase for more spacing around the table (min 0).
No Overlays: The indicator appears as a non-overlay pane, keeping your chart clean.
Supports all symbols and time frames, but best on lower TFs (e.g., 1m-15m) for monitoring HTFs.
How to Use It
Add to Chart: Search for "HTF Bias Tracker" in TradingView's indicator library and add it to your chart.
Configure Inputs: Set your desired HTFs, position, and colors.
Interpret the Table:
Look for alignment across multiple HTFs (e.g., multiple "Bullish ↑" biases suggest upward momentum).
Use the H/L Break as a directional filter: Enter long trades only when HTF bias is bullish or neutral with a prior bull break.
Combine with Candle Condition for confirmation: A bearish bias with a bearish candle might signal short opportunities.
Trading Example:
On a 1m chart, if the 1H bias shows "Bearish ↓" (low of previous 1H broken), there's ~70% chance the 1H closes lower. Wait for lower TF pullbacks to enter shorts, aligning with the HTF downtrend.
For scalping: If Daily is "Bullish ↑" but 4H is "Neutral ↓" (prior bear break), consider fading minor pullbacks but avoid counter-trend trades.
Risk Management: Always use stop-losses based on recent highs/lows and position size appropriately. This indicator aids bias assessment but should be combined with other tools like support/resistance or oscillators.
Strategy Ideas:
Trend Alignment: Trade in the direction of the majority HTF biases.
Breakout Confirmation: When a break occurs, monitor for volume or price action confirmation on your trading TF.
Reversion Plays: In ranging markets, a "Mixed ↔" bias might signal indecision—avoid trades until resolution.
Backtest the probability edge (e.g., via Pine Script strategies) to quantify performance in your markets.
Limitations and Disclaimer
The ~70% probability mentioned is a general observation from historical price action studies (e.g., across forex and indices); it is not a guarantee and should be verified with your own data. No backtesting results are provided here—users are encouraged to test independently.
The indicator relies on request.security() for HTF data, which may have minor delays in real-time.
This is not financial advice. Trading involves risk, and past performance does not predict future results. Use at your own discretion and consult a professional advisor if needed.

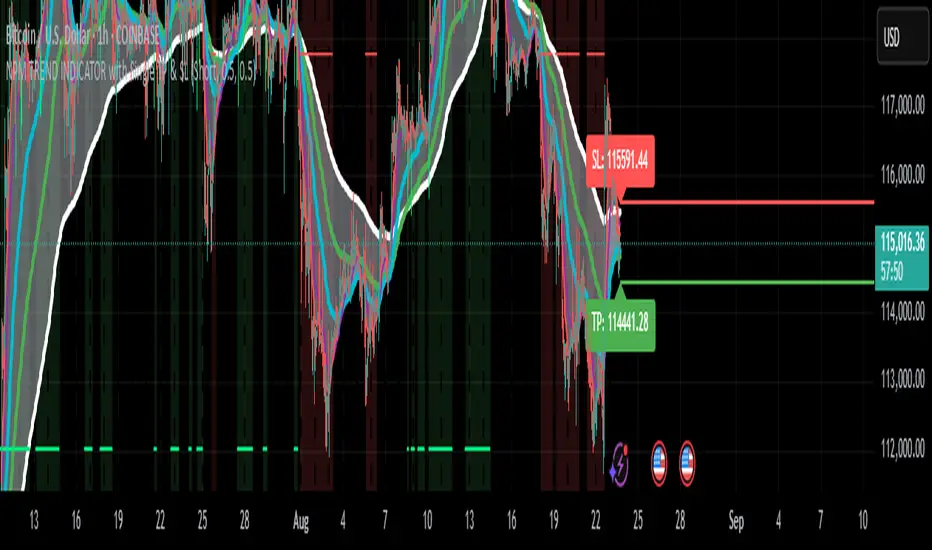
NPM Trend Indicator ProNPM Trend Indicator Pro
The NPM Trend Indicator Pro is a closed-source, professional-grade trend detection tool designed to help traders identify high-probability directional moves in the market. It combines multiple technical factors to generate clear, actionable trend signals while filtering out noise and reducing false entries.
What it does
Displays trend direction (uptrend, downtrend, or neutral) for the selected symbol.
Shows a confidence or strength score to indicate how reliable the trend signal is.
Highlights potential areas of market exhaustion or reversal based on aggregated trend analysis.
Provides visual cues on the chart to assist with trade timing and risk management.
How it works (concept-level)
Integrates multiple trend-detection methods, including moving average structures, momentum confirmation, and volatility assessment.
Uses adaptive filters to avoid false signals during sideways or choppy market conditions.
Includes zone awareness to help traders avoid entering trades too close to likely reaction points.
Aggregates all signals into a single output to give traders a concise, actionable overview.
How to use it
1. Apply the indicator to your chosen symbol.
2. Observe the trend direction and confidence score displayed on the chart.
3. Confirm that the trend aligns with your trading strategy and timeframe.
4. Use the visual cues for potential entry, exit, and risk management decisions.
Alerts
Optionally set alerts when trend direction changes or when the confidence score reaches a user-defined threshold.
Notes
Suitable for multiple markets, including forex, indices, crypto, and equities.
Can be used for intraday scalping, swing trading, or longer-term trend analysis depending on the trader’s selected timeframe.
⚠️ Disclaimer: This script is for educational purposes only and is not financial advice. Trading involves risk, and you can lose money. Always test strategies on a demo account and use proper risk management.
(ES, NQ) Trend Checker SB1(ES, NQ) Trend Checker SB1
Stay ahead of the market by tracking whether the E-mini S&P 500 (ES) and the Nasdaq 100 (NQ) are moving in sync.
📊 How it works:
The script checks whether each index is bullish (close > open) or bearish (close < open).
If both are aligned (all bullish or all bearish), conditions are stable.
If they diverge, the indicator instantly flags a mismatch in trend.
🎯 Features:
Background shading to highlight mismatched conditions.
Real-time alerts when ES and NQ fall out of sync.
Works on any timeframe.
🔥 Why it matters:
When ES and NQ move together, market momentum is usually stronger and cleaner.
But when they disagree, expect choppiness, fakeouts, or caution zones — the perfect heads-up before entering trades.
Indexed Gann Fan“This indicator automatically builds an unique trend-based Gann fan by selecting swing high/swing low ubased on price fluctuation index over time for each segment of the chart.
It helps traders identify the true market trend and pinpoint key support and resistance levels at precise angles.
Designed for traders familiar with Gann’s methodology who want a clearer understanding of market structure and greater confidence in their trading decisions.”
__________________________________________________________________________________
Индикатор автоматически по выбору экстремума строит уникальный трендовый веер Ганна, используя индекс колебаний цены во времени для каждого участка графика.
Помогает видеть направление тренда и определять ключевые углы поддержки и сопротивления.
Инструмент создан для трейдеров знакомых с методологией Ганна, которые хотят получать более ясное понимание рыночной структуры и принимать решения с максимальной уверенностью.
200 EMA w/ Ticker Memory200 EMA w/ Ticker Memory — Multi-Symbol & Multi-Timeframe EMA Tracker with Alerts
Overview
The 200 EMA w/ Ticker Memory indicator allows you to monitor the 200-period Exponential Moving Average (EMA) across multiple symbols and timeframes. Designed for traders managing multiple tickers, it provides customizable timeframe inputs per symbol and instant alerts on price touches of the 200 EMA.
Key Features
Multi-symbol support: Configure up to 20 different symbols, each with its own timeframe setting.
Flexible timeframe input: Assign specific timeframes per symbol or use a default timeframe fallback.
Accurate 200 EMA calculation: Uses request.security to fetch 200 EMA from the symbol-specific timeframe.
Visual EMA plots: Displays both the EMA on the selected timeframe and the EMA on the current chart timeframe for comparison.
Touch alerts: Configurable alerts when price “touches” the 200 EMA within a user-defined sensitivity percentage.
Ticker memory: Remembers your configured symbols and displays them in an on-chart table.
Compact info table: Displays current symbol status, alert settings, and timeframe in a clean, transparent table overlay.
How to Use
Configure Symbols and Timeframes:
Input your desired symbols (up to 20) and their respective timeframes under the “Symbol Settings” groups in the indicator’s settings pane.
Set Default Timeframe:
Choose a default timeframe to be used when no specific timeframe is assigned for a symbol.
Adjust Alert Settings:
Enable or disable alerts and set the touch sensitivity (% distance from EMA to trigger alerts).
Alerts
Alerts trigger once per bar when the price touches the 200 EMA within the defined sensitivity threshold.
Alert messages include:
Symbol / Current price / EMA value / EMA timeframe used / Chart timeframe / Timestamp
Customization
200 EMA Color: Change the line color for better visibility.
Touch Sensitivity: Fine-tune how close price must be to the EMA to count as a touch (default 0.1%).
Enable Touch Alerts: Turn on/off alert notifications easily.
For:
- Swing traders monitoring multiple stocks or assets.
- Day traders watching key EMA levels on different timeframes.
- Analysts requiring a quick visual and alert system for 200 EMA touches.
- Portfolio managers tracking key technical levels across various securities.
Limitations
Supports up to 20 configured symbols (can be extended manually if needed).
Works best on charts with reasonable bar frequency due to request.security usage.
Alert frequency is limited to once per bar for clarity.
Disclaimer
This indicator is provided “as-is” for educational and informational purposes only. It does not guarantee trading success or financial gain.

ADVANCED EMA RIBBON SUITE PRO [Multi-Timeframe + Alerts + Dash]🎯 ADVANCED EMA RIBBON SUITE PRO
📊 DESCRIPTION:
The most comprehensive EMA Ribbon indicator on TradingView, featuring 14 customizable
EMAs (5-200), multi-timeframe analysis, gradient ribbon visualization, smart alerts,
and a real-time dashboard. Perfect for trend following, scalping, and swing trading.
🔥 KEY FEATURES:
• 14 EMAs with Fibonacci sequence option (5, 8, 13, 21, 34, 55, 89, 144, 200)
• Multi-Timeframe (MTF) analysis - see higher timeframe trends
• Dynamic gradient ribbon with trend-based coloring
• Golden Cross & Death Cross detection with alerts
• Professional themes (Dark/Light) with 6 visual styles
• Real-time information dashboard
• Customizable transparency and colors
• Trend strength visualization
• Price position analysis
• Smart alert system for all major crossovers
📈 USE CASES:
• Trend Identification: Ribbon expansion/contraction shows trend strength
• Entry/Exit Signals: EMA crossovers provide clear trade signals
• Support/Resistance: EMAs act as dynamic S/R levels
• Multi-Timeframe Confluence: Combine timeframes for higher probability trades
• Scalping: Use faster EMAs (5-20) for quick trades
• Swing Trading: Focus on 50/200 EMAs for position trades
🎯 TRADING STRATEGIES:
1. Ribbon Squeeze: Trade breakouts when ribbon contracts
2. Golden/Death Cross: Major trend reversals at 50/200 crosses
3. Price Above/Below: Long when price above most EMAs, short when below
4. MTF Confluence: Trade when multiple timeframes align
5. Dynamic S/R: Use EMAs as trailing stop levels
⚡ OPTIMAL SETTINGS:
• Scalping: 5, 8, 13, 21 EMAs on 1-5 min charts
• Day Trading: Full ribbon on 15-60 min charts
• Swing Trading: Focus on 50, 100, 200 EMAs on daily charts
• Position Trading: Use weekly timeframe with monthly MTF
📌 KEYWORDS:
EMA, Exponential Moving Average, Ribbon, Multi-Timeframe, MTF, Golden Cross,
Death Cross, Trend Following, Scalping, Swing Trading, Dashboard, Alerts,
Support Resistance, Fibonacci, Professional, Advanced, Suite, Indicator
*Created using PineCraft AI (Link in Bio)

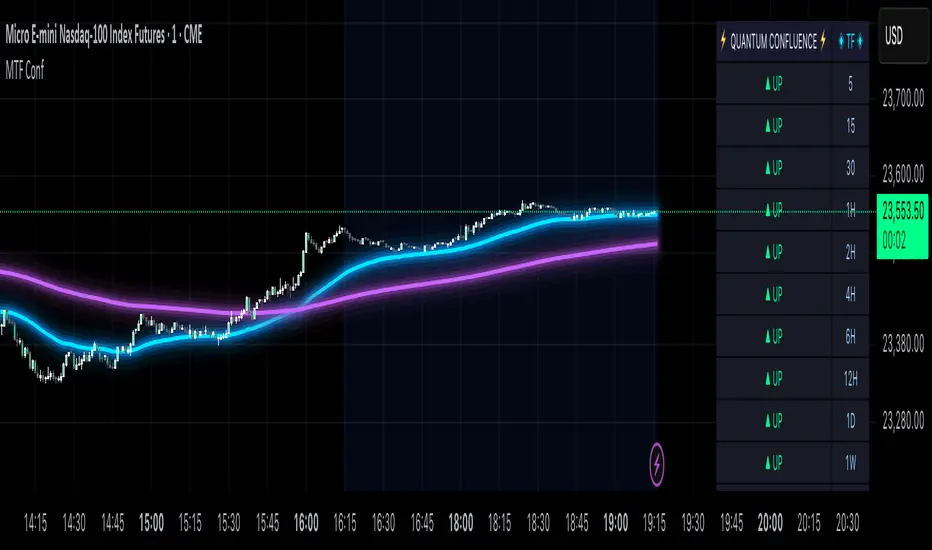
MTF Confluence Dashboard (Multi‑Timeframe Trend/Bias)MTF Confluence Dashboard — Multi‑Timeframe Trend/Bias Table + EMA
The MTF Confluence Dashboard is a fast, non‑repainting multi‑timeframe (MTF) confluence tool that shows higher‑timeframe trend and bias alignment in a compact, on‑chart table. It’s built for prop‑firm challenges and futures day traders who need instant top‑down confirmation without switching charts. Get a clean read of trend direction across your selected timeframes, plus on‑chart MAs for timing.
Why traders use it
* MTF Confluence at a glance: Trend/Bias table aggregates short vs long MA on 1m→1W (you pick which TFs show).
* Non‑repainting: Uses closed-bar higher‑TF data; reliable for alerts and evaluations.
* Futures + prop‑firm friendly: Minimal lag, lightweight, session‑agnostic; perfect for ES/NQ/CL/GC scalping or intraday swings.
Core features
* Trend/Bias Table: “Up / Down” per timeframe and an overall AVG sentiment.
* MA Engine: Choose MA type (SMA/EMA/WMA/HMA) and lengths (e.g., 50/200) to define bias.
* On‑Chart Confirmation: Plots short/long MAs for entry timing on your trading TF.
* Smart Alerts: Built‑in alerts for Strong Up/Up/Neutral/Down/Strong Down average bias.
* Custom Layout: Vertical or Horizontal table, resizable text (Tiny → Huge), corner positioning.
* Pro Visual Themes:
* Dark Intergalactic (neon/futuristic for dark charts)
* Light Minimal (clean light mode)
* Pro Modern (low‑saturation, desk‑ready)
How to trade it
* Scalps (1m–5m): Only take longs when 5m/15m/1H/D are “Up” and AVG is Up/Strong Up; use MA crosses/pulls for entries.
* Intraday swings (5m–15m–1H): Wait for a higher‑TF flip to align; trail under the long MA.
* Risk discipline: If AVG shifts to Neutral/Down, stop looking for longs until bias realigns.
Settings you’ll care about
* Timeframes to display (1m, 2m, 3m, 5m, 10m, 15m, 30m, 1H, 2H, 4H, 6H, 12H, 1D, 1W).
* MA Type: SMA / EMA / WMA / HMA.
* Short/Long lengths (defaults 50/200).
* Theme, orientation, and size.
Notes
* Works on all symbols and timeframes.
* No repainting; alerts trigger on closed conditions.
* Built by PineProfits.
ZenAlgo - ADXThis open-source indicator builds upon the official Average Directional Index (ADX) implementation by TradingView. It preserves the core logic of the original ADX while introducing additional visualization features, configurability, and analytical overlays to assist with directional strength analysis.
Core Calculation
The script computes the ADX, +DI, and -DI based on smoothed directional movement and true range over a user-defined length. The smoothing is performed using Wilder’s method, as in the original implementation.
True Range is calculated from the current high, low, and previous close.
Directional Movement components (+DM, -DM) are derived by comparing the change in highs and lows between consecutive bars.
These values are then smoothed, and the +DI and -DI are expressed as percentages of the smoothed True Range.
The difference between +DI and -DI is normalized to derive DX, which is further smoothed to yield the ADX value.
The indicator includes a selectable signal line (SMA or EMA) applied to the ADX for crossover-based visualization.
Visualization Enhancements
Several plots and conditions have been added to improve interpretability:
Color-coded histograms and lines visualize DI relative to a configurable threshold (default: 25). Colors follow the ZenAlgo color scheme.
Dynamic opacity and gradient coloring are used for both ADX and DI components, allowing users to distinguish weak/moderate/strong directional trends visually.
Mirrored ADX is internally calculated for certain overlays but not directly plotted.
The script also provides small circles and diamonds to highlight:
Crossovers between ADX and its signal line.
DI crossing above or below the 25 threshold.
Rising ADX confirmed by rising DI values, with point size reflecting ADX strength.
Divergence Detection
The indicator includes optional detection of fractal-based divergences on the DI curve:
Regular and hidden bullish and bearish divergences are identified based on relative fractal highs/lows in both price and DI.
Detected divergences are optionally labeled with 'R' (Regular) or 'H' (Hidden), and color-coded accordingly.
Fractal points are defined using 5-bar patterns to ensure consistency and reduce false positives.
ADX/DI Table
When enabled, a floating table displays live values and summaries:
ADX value , trend direction (rising/falling), and qualitative strength.
DI composite , trend direction, and relative strength.
Contextual power dynamics , describing whether bulls or bears are gaining or losing strength.
The background colors of the table reflect current trend strength and direction.
Interpretation Guidelines
ADX indicates the strength of a trend, regardless of its direction. Values below 20 are often considered weak, while those above 40 suggest strong trending conditions.
+DI and -DI represent bullish and bearish directional movements, respectively. Crossovers between them are used to infer trend direction.
When ADX is rising and either +DI or -DI is dominant and increasing, the trend is likely strengthening.
Divergences between DI and price may suggest potential reversals but should be interpreted cautiously and not in isolation.
The threshold line (default 25) provides a basic filter for ignoring low-strength conditions. This can be adjusted depending on the market or timeframe.
Added Value over Existing Indicators
Fully color-graded ADX and DI display for better visual clarity.
Optional signal MA over ADX with crossover markers.
Rich contextual labeling for both divergence and threshold events.
Power dynamics commentary and live table help users contextualize current momentum.
Customizable options for smoothing type, divergence display, table position, and visual offsets.
These additions aim to improve situational awareness without altering the fundamental meaning of ADX/DI values.
Limitations and Disclaimers
As with any ADX-based tool, this indicator does not indicate market direction alone —it measures strength, not trend bias.
Divergence detection relies on fractal patterns and may lag or produce false positives in sideways markets.
Signal MA crossovers and DI threshold breaks are not entry signals , but contextual markers that may assist with timing or filtering other systems.
The table text and labels are for visual assistance and do not replace proper technical analysis or market context.
