The Systems Lab: PRX StrategyLike the PRX Indicator (which is also available) this PRX Strategy includes all the elements necessary to run the PRX Trading System or to incorporate any of its elements into your own analysis. But since this is a strategy it also includes all of the system entry and exit orders which allows them to be displayed on the charts and backtested in different configurations to see how specific configurations of the system could have performed in the past.
The primary concept is the identification of trends by way of a customized PSAR (Parabolic Stop and Reverse) calculation that uses linear regression to reduce market noise and highlight trends for longer using a method pioneered by Dr Ken Long. This means that price can penetrate the PSAR dots without causing a trend reversal to occur (flipping the dots over to the opposing side) which would normally occur with the traditional PSAR idea.
The intent is to help identify and stick with trends longer, adapt to changes in volatility by using linear regression as a noise filter and potentially capture large outlier moves. A linear regression curve is plotted as well in order to help identify when a change in trend will occur by it crossing the PSAR dots.
In order to make the trend as clear as possible the bars can be colored as either up-trend or down-trend with user selectable colors.
A moving average filter is also included as a longer term market condition filter in order to avoid periods when the market is against this average which is an inherent part of the system.
The strategy is currently long only (though we’re working on the short side) and includes standard entries along with a trailing stop using the customized PSAR. It also includes multiple options to re-enter with an existing trend if the trailing stop is hit but the trend remains in place.
Multiple parameters are available for customisation including the Linear Regression length, the Moving Average Filter lookback, enabling of the re-entry and continuation entry signals as well as a date range filter for more specific and repeatable backtesting over different markets and timeframes.
Risk Management is at the core of our system design principles and as such we set and limit the loss for every trade (which is also configurable as a parameter that defaults to $100/trade) and also trail the stop to both reduce risk and capture profit. The position size is calculated automatically and is volatility adjusted based on the initial stop.
Finally, there is a custom dashboard which shows all the relevant details for the current trade at a glance on the chart such as entry, initial stop (size and price), current trailing stop level and P/L in units of R-multiples (’R’ being the initial risk on the trade).
TSL

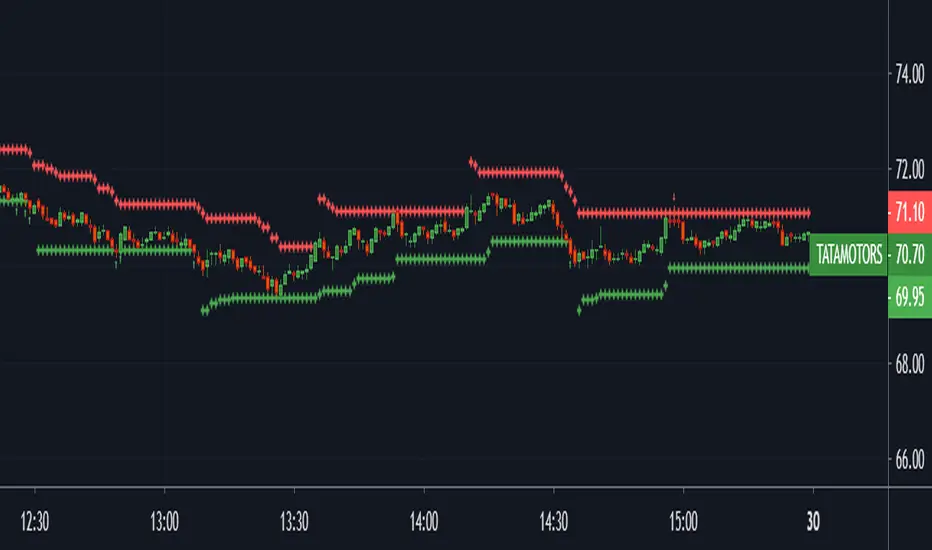
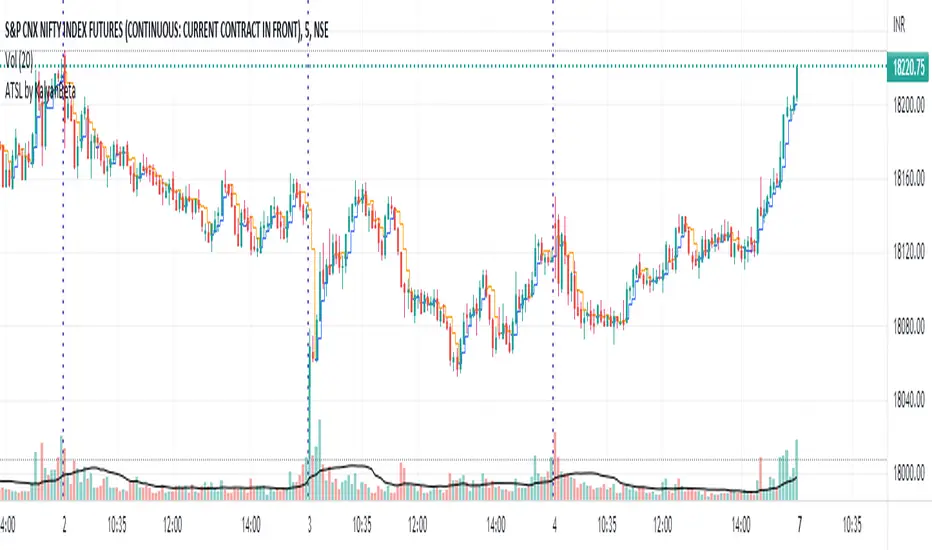
Anti-trap Trailing Stop Loss by KalyanBetaAnti-trap Trailing Stop Loss by KalyanBeta or ATSL
ATSL changes color when there it identifies price manipulation/ SL Hunting / Traps by Smart Money.
Change in color may be an exit signal for your trade in current direction.
This is a very simple indicator which can be used to predict Traps or Stop-loss hunting.
This can help in Trailing Stop-loss and in Exit decisions along with your own strategy.
ATSL may be used in all timeframes.
Please back-test it along with your strategy and then use it for Trailing the Stop-loss without getting trapped by operators and stop-loss hunters.
All the best.
Do post your feedback in comments below. Thank you.
Scalping using RSI 2 indicator with TP and TSLThis study implements a simply scalping using the RSI (calculated on two periods), the slopes of two MAs (EMA or SMA) having different lengths (by default, I use 50 and 200).
A take profit (%) and a trailing stop loss (%) are used.
Entry conditions:
.) Fast MA > Slow MA and Price > Slow MA and RSI < Oversold Threshold ------> go Long
.) Fast MA < Slow MA and Price < Slow MA and RSI > Overbought Threshold ------> go Short
Exit conditions:
.) Long entry condition is true and (close >= TP or close <= TSL) ----> close short position
.) Short entry condition is true and (close <= TP or close >= TSL) ----> close long position
The strategy performed best on Bitcoin and the most liquid and capitalized Altcoins but works excellent on volatile assets, mainly if they often go trending.
Works best on 3h - 4h time frame.
There's also an optional Volatility filter, which opens the position only if the difference between the two slopes is more than a specific value, which can be set in the study inputs. The purpose is not opening positions if the price goes sideways and the noise is way > than the signal.
Note:
.) the RSI length is 2;
.) the oversold Threshold is 90%;
.) the overbought Threshold is 10%;
.) by default, the take profit per cent is 0.5%;
.) by default, the trailing stop loss per cent is 0.5%;
.) by default, the fast MA length is 50;
.) by default, the slow MA length is 200;
.) by default, the MA used is EMA.
Cheers.

Percent Trailing Stop (%) - For Study Scripts===========
Percent Trailing Stop (%) - { FOR STUDY SCRIPTS }
===========
Wow - this is an example of how to implement Alerts relating to a Trailing Stop (%) within your Study Script. It's taken a bit of effort to get this working but I think we got there!
Alerts include Open Long/Short, Trailing Stop Hit, and (the most important one) Movement of Trailing Stop! <- this is actually really quite good, by the way! :)
You can ignore the actual entry/exit orders - they're based on a simple MA cross and are therefore NOT relevant, NOT profitable and NOT recommended!
You should be using this code as a way of adding a Trailing Stop to your own scripts - hope it helps!
Set your "Open Long/Short" Alert to "Once per Bar Close" - Set your "Trailing Stop Hit" Alert to "Once per Bar" - Set your "Move TSL" Alert to "Once per Bar Close". - You're all done! Enjoy.
-----------
Good Luck and Happy Trading!

Percent Trailing Stop %===========
Percent Trailing Stop %
===========
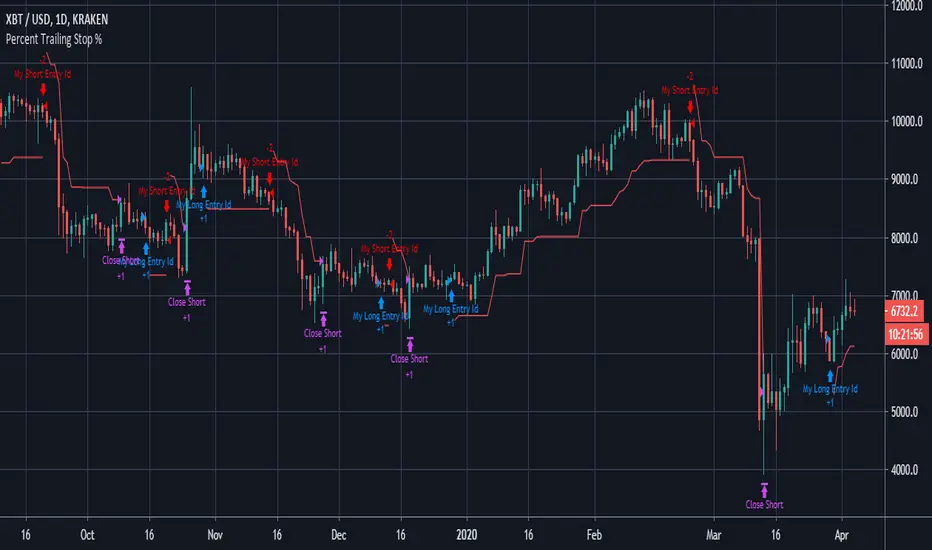
Another Stop Loss Indicator today - our last Fixed SL/TP script went down quite well, this one is for adding a Percent Trailing Stop from Entry Price to your own strategy.
You can ignore the actual entry/exit orders - they're based on a simple MA cross and are therefore NOT relevant, NOT profitable and NOT recommended!
You should be using this code as a way of adding a % Trailing Stop to your own scripts - hope it helps!
You should also notice that a generally considered losing strategy (a simple MA cross) could actually become profitable with careful money management - try combining this Trailing Stop script with our Fixed Stop/Take Profit script for really accurate management of your capital.
-----------
Good Luck and Happy Trading!
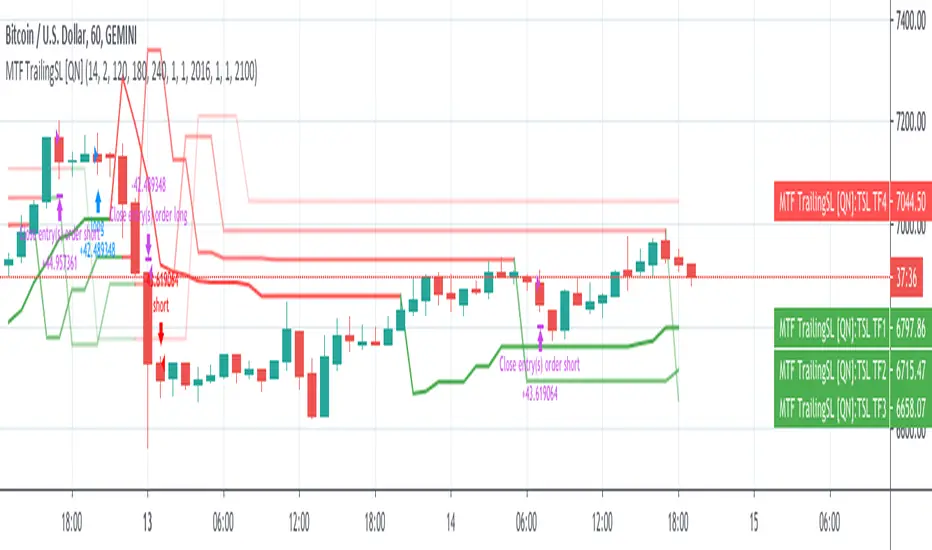
MTF Trailing SL Strategy [QuantNomad]This is a Multi-Timeframe version of my Trailing SL Strategy.
Few weeks ago I published Trailing SL Strategy. There I used only basic Trailing SL to enter positions.
It worked pretty well so I tried to work on it a bit. I thought what if you can use the same ATR TSL on different timeframes and combine them into one signal.
In this strategy you can use only ATR stops and choose 3 other higher timeframes in addition to your current timeframe.
You'll see Trailing SL plotted on the chart form all these timeframes.
Entry Long position if all 4 time-frames agree on long signal.
Exit Long positions when at least 2 time-frames disagree on long signal.
Entry to Short position if all 4 time-frames agree on Short signal.
Exit from Short positions when at least 2 time-frames disagree on Short signal.
Here is the link to my basic Trailing SL Strategy:
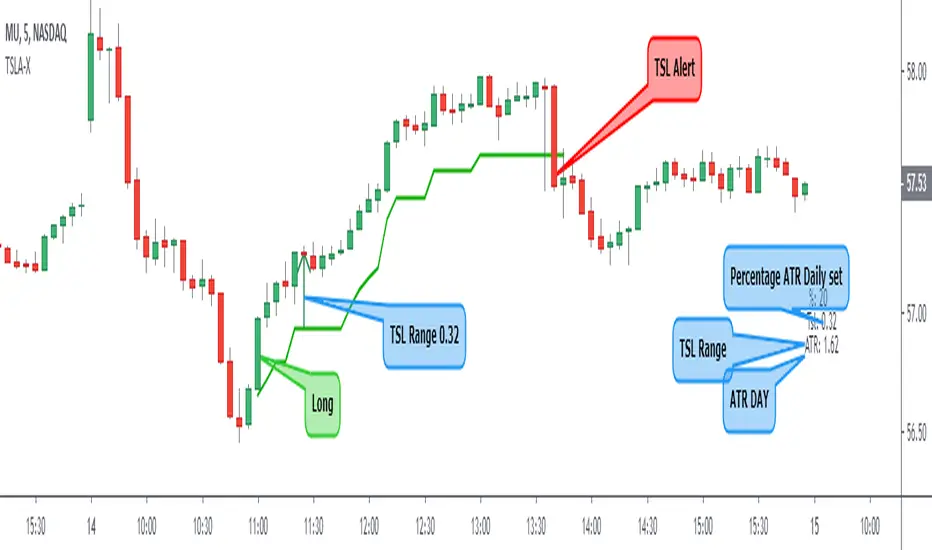
Trailing Stop Loss ATR + AlertI share this TSL indicator with alert (I use it only for Stocks), the configuration is very simple, you must select if it is a Short or Long operation, time at which the operation was opened,% of the daily ATR for TSL. It also contains:
- Alert
- Panel Info
Trailing Sl Both Side How To Work? (long Side Stoploss)
This Indicator Calculate Every New Candle Open Price
For Example, Candle Open Price 50 And You Set 1 Point Stoploss Then Your Stoploss Automatically Add
49 Then Next Candle Open Price 52 Your Stoploss Automatically Trail 51 Then Next Candle Price 51.5 But
Your Stoploss 51 Fix Because Price Down But Stop Loss Not Down Without Trigger
Alerts Condition
Long Side Stoploss
1 Click Alerts and By Default Select Symbol
2 Crossing
3 Select indicator
4 select first plot
Short Side Stoploss
1 Click Alerts and By Default Select Symbol
2 Crossing
3 Select indicator
4 select second plot