Vegas TunnelThis indicator is based on the "Vegas Tunnel" system from FTMO, please check out their site here for some good documentation: ftmo.com
I give FTMO full credit for this indicator, all I did here was make it easy to throw it up on a chart.
Personally, I've had some success trading with this method. I encourage doing some back and forward testing to see if it is something that would fit your trading style.
Tunnel
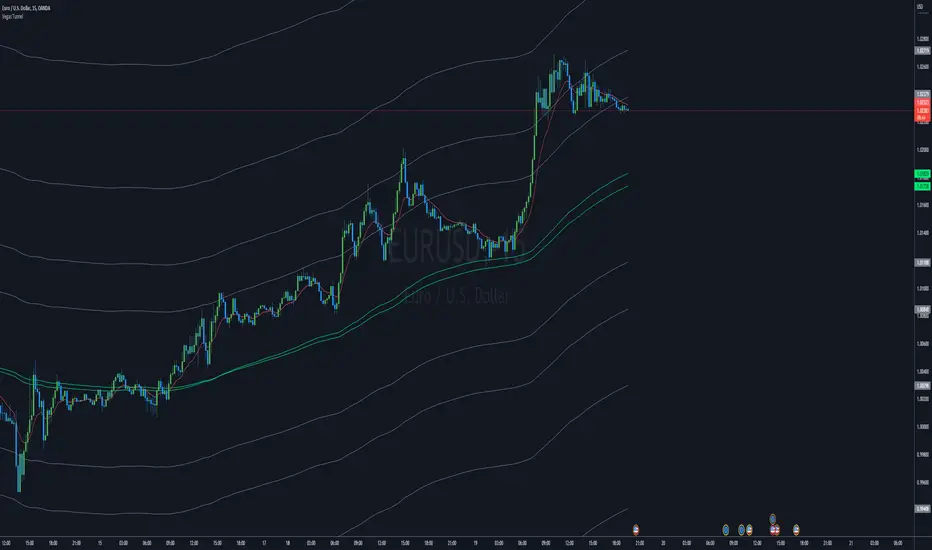
OB EMA Fibo TunnelThis indicator plots a base EMA and then plot many lines above and below according to the Fibonacci levels, creating a tunnel where it is possible to see the price respecting some levels.
It is similar the concept of Vegas Tunnel, but with my numbers.
The Base EMA is 26 for daily charts and 8 for Weekly charts. The smaller timeframes use a variation of 26, like 26*4 for 4h charts.
It is also possible to choose if you want to color candle bars and what levels of Fibo lines you want to see. I created that to have a clean chart.
*** To enable the colored candles, you should choose the visual order and move to top!
Please leave a comment if you liked and if you have any suggestion.
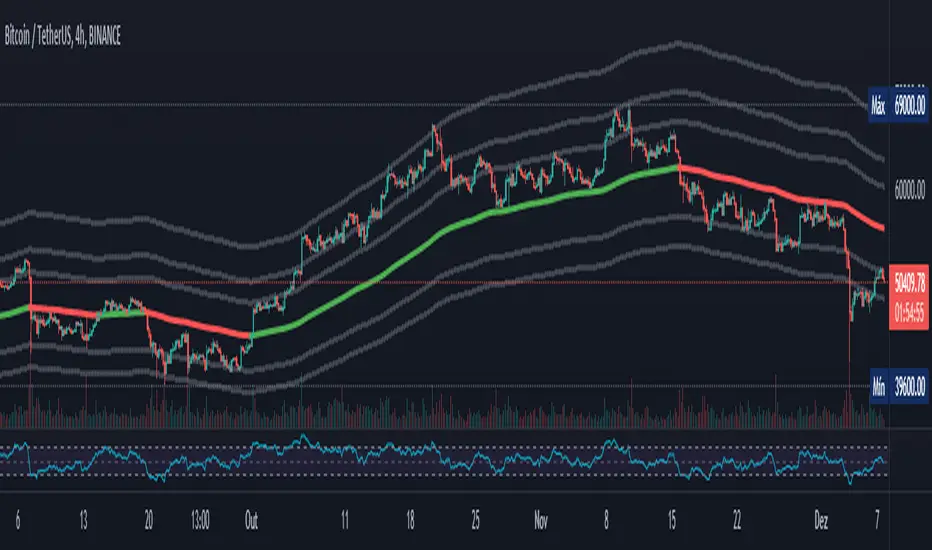
High - Low Trend TunnelHigh - Low Trend Tunnel Experiment.
Using latest pinescript Array support!
Plotting Highest highs and Lowest lows for specific length (can be defined in settings).
The blue line is whom determinate the direction.
Blue line is the average of the highest highs and lowest lows smoothed by EMA.
Green - Up Trending.
Red - Down Trending.
Yellow - Squeeze, a reversal might be coming.
Any suggestions/comments are welcome as this is an experiment.

High/Low meterUsing the new 'pinescript' array support to build an High/Low tunnel meter.
Using the Array to save only X HIGHEST HIGHS and Y LOWEST LOWS.
By the X and Y i build a tunnel - X is the top line (highs) and Y bottom line (lows)
Green - Up Trending
Red - Down Trending
Yellow - Reversal / drawback might occur.


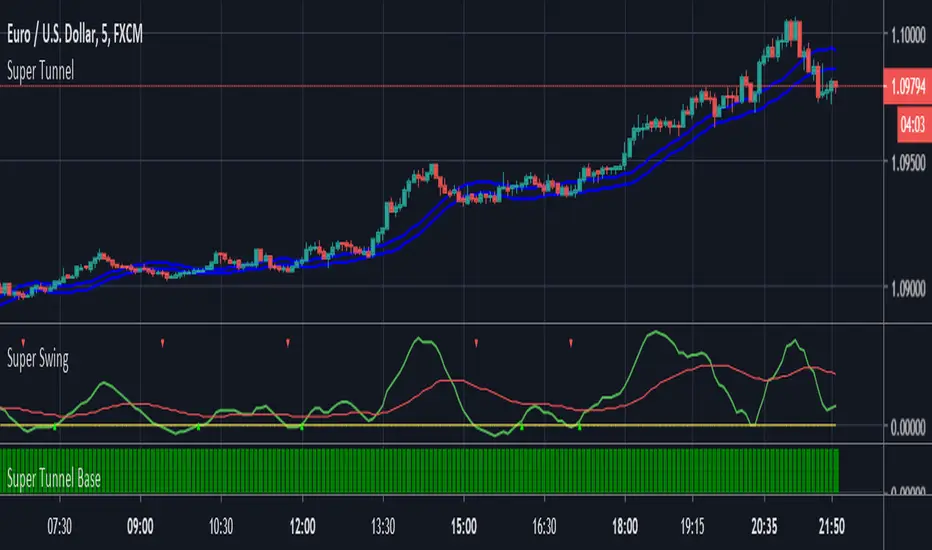
Super Tunnel by JP Goswami
One of the most accurate trend following indicator I have used till now. You yourself can test it by using on multiple charts and time frame. However, I have found it more accurate on intraday charts, may be 5 min & 15 min TF.
Highlights are:
> High Prediction rates
> Non repainting
> Can be used on MTF
> Simplicity
> Give stoploss levels
Disadvantage:
> Just like any other trend following indicator, volatility and spikes are enemy of this indicator
How to Use
Long:
When Price closes above the tunnel & background is Lime
Stoploss: Just below lower line of the tunnel
Short: When price closes below the tunnel & background is yellow
Stoploss: Just above upper line of the tunnel
No trades: When background doesn't have any colors
Reentry: if Price moves back to long and short rules
All the best
© JP Goswami
Vegas Tunnel V1.0Step 1: Create a 1 hour chart on whatever currency pairs interest. I personally use MT4 platform on Oanda to follow my trades. Overlay 3 time periods: 169 EMA, 144 EMA and a 12 period EMA ( all 1 hour.) The 144 and 169 EMA’s create the tunnel. The 12 EMA is the filter and crossover indicator.
Step 2. Fibonacci numbers are very crucial to trading with the tunnel especially 55,89,144, 233, and 377.
Step 3. Wait for the market to come into the tunnel “area”. When it breaks above the upper tunnel boundary, you go long. When it breaks below the lower tunnel boundary you go short.
Step 4. Stops and reverses are placed on the other side of the tunnel.
Step 5. As the market trades in your direction, you take partial profits at the successive Fib numbers. The final portion of your position is left on until one of the following conditions occur: 1) market hits the last Fib number 377 pips from the EMA’s or 2) the market eventually comes back to the tunnel and violates the other side.
Vegas used the following moving averages, as filters:
5-period Simple Moving Average (SMA)
12-period Exponential Moving Average (EMA)
21-period Exponential Moving Average (EMA)

Vegas Wave - BronzeThe bronze edition of my code will be the most basic of a series of Vegas Wave codes which I will publish.
EMA 144, 169, 233
Vegas Tunnel - Highlights the price band between the 144 and 169 EMA.
Identifies support and resistance areas
Target price bounces and aid identifying EW counts.
Wave 2 retrace through the waves. Wave 4 bounce off Vegas Tunnel for example.
Provides confluence when used with fib targets and other indicators.
Identify EMA cross-overs and price crosses.
Easy to customise colours and shading for all time periods.
Multiple indicators in one (for those with TV limits).
Silver/Gold versions
I will include highlights/alerts for EMA/Price crossovers.
I hope its helpful and hopefully the first of many scripts to come.
Feel free to leave ideas and tips for future versions.

Wavy TunnelEasy Wave Tunnel
Wavy Line ;
ema34 3 lines = High, Close , Low
Tunnel Line ;
ema144 , close and ema169, close
5 Rules to use WaveTunnel
1. Wavy Lines and Tunnel Lines are the natural Resistant and Support line.
2. Price above both Wavy & Tunnel = Uptrend , Price below both Wavy & Tunnel = Downtrend
3. Break Wavy Line , price run to Tunnel Line
4. Not Pass Tunnel Line, price run back Wave Line
5. Hit Tunnel and retrace less then 61.8% , then Break out, Price go AB=CD pattern
Wavy Tunnel By Wave Riders Styles
