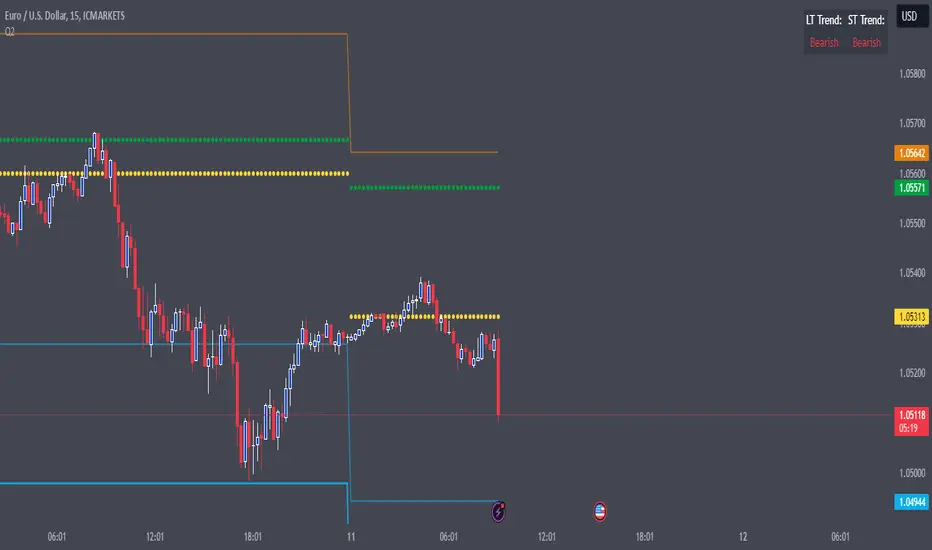
Resistance & SupportThis indicator combines multiple analytical methods to calculate potential support and resistance levels for the upcoming trading day, leveraging historical price data. The calculations are based on three key areas:
Pivot Points: These are calculated using the previous day's high, low, and close values to provide central price levels, along with first and second-level support and resistance (S1, S2, R1, R2). These levels are commonly used in technical analysis and can serve as reference points for market entries and exits.
3-Day Price Average (3DBP): This value provides a short-term trend signal by averaging the high, low, and close prices over the past three days. The indicator helps identify whether the market has been trading at higher or lower levels recently, which can signal bullish or bearish trends.
Trend Detection: The script also includes a short-term and long-term trend analysis:
Short-Term Trend: The prior day’s 3DBP is compared to the previous day’s 3DBP to gauge the market's short-term direction.
Long-Term Trend: The prior close is compared to the open from 50 days ago, offering an indication of the overall market trend.
These components work together to provide actionable insights on potential entry points. For example:
In a bullish market, support levels may act as potential entry points for long trades when the price retraces.
In a bearish market, resistance levels may act as potential entry points for short trades upon price rejection.
The Trend Table at the top right of the chart displays the short-term and long-term trend information for quick reference. It shows whether the trends are bullish or bearish based on the calculations above.
While originally optimized for the EUR/USD currency pair, this indicator can be applied to other forex pairs. However, results may vary depending on the instrument, and further testing is recommended for non-EUR/USD pairs.
Usage Notes:
Pivot points can often act as both support and resistance. While they provide useful reference levels, in volatile markets, these levels may not always hold. Tight stop-losses are recommended if trading near these levels.
The 3DBP offers insight into past market behavior, and although it’s not guaranteed to act as support or resistance, it can help identify zones of interest in the short term.
This indicator is designed to provide a structured approach to price action analysis, incorporating widely-recognized methods like pivot points and trend detection, while adding unique elements like the 3DBP to enhance its utility.
Turningpoint
convolution
Description:
Convolution indicators aim to identify a major reversal in the price direction so that one can trade the market primarily in the direction of the ensuing trend, as described in the Cycle Analytics for Traders, by John F. Ehlers pg. 165. The notion is based on the concept of the two price segments are perfectly correlated (cross-correlated) that have been folded at the horizontal point, since high correlation exists only at the market turning point, e.g. price decreases linearly until the bottom is reached and then increases linearly after the bottom occurs and vice versa. The vertical scale is the lookback period, while the value is converted to colors.
Features:
High-pass filter and Smoothing function on the input data
Major reversals are identified by plumes pointing backward to the time of the price reversal
Bullish reversal identified by the green color of the indicator,
while Bearish reversal identified by a red color dominated the indicator

Price & Time SquaredHi Traders..
This is one of Gann's trading method, called Price & Time Squared. When price & time meets, price will reverse."
as you see, those lines (past & future) represent the forecast of 'potential' swing (swing high/low or turning up/ down)
here are some examples:
Weekly
Daily
H1
M30
M15
M5
How to trade (very simple):
- if the trend is down and tomorrow there is a 'Price & Time Squared Line', we can prepare to take long position (combine with your favorite price action)
- if the trend is up and tomorrow there is a 'Price & Time Squared Line', we can prepare to take short position (combine with your favorite price action)
- stop loss if the chart makes Lower Low (for Long Position)
- stop loss if the chart makes Higher High (for Short Position)
you can use those lines as guidance in your trading (just like Traffic Light)
PS:
-if you see 2 or 3 lines close together, or 2 or 3 lines stack in 1 line (cluster), it means the Time Factor is 'Strong'
the stronger the cluster the stronger the Time Factor
- due to time delay & time lag, the turning can be +/- 1 bar
- PM for trial access
“Time is the most important factor of all and not until sufficient time has expired does any big move start up or down. The time factor will overbalance both space and volume. When time is up, space movement will start and large volume will begin, either up or down.


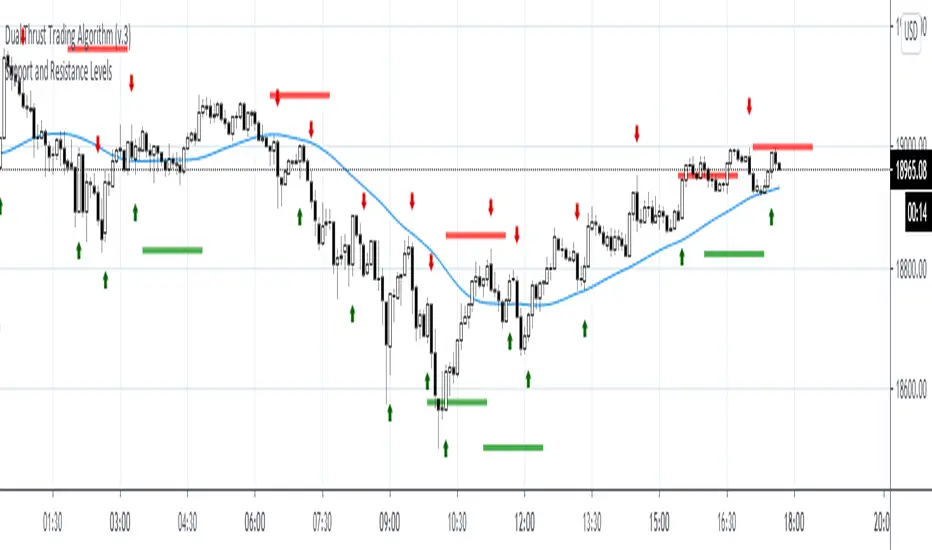
Support and Resistance LevelsDetecting Support and Resistance Levels
Description:
Support & Resistance levels are essential for every trader to define the decision points of the markets. If you are long and the market falls below the previous support level, you most probably have got the wrong position and better exit.
This script uses the first and second deviation of a curve to find the turning points and extremes of the price curve.
The deviation of a curve is nothing else than the momentum of a curve (and inertia is another name for momentum). It defines the slope of the curve. If the slope of a curve is zero, you have found a local extreme. The curve will change from rising to falling or the other way round.
The second deviation, or the momentum of momentum, shows you the turning points of the first deviation. This is important, as at this point the original curve will switch from acceleration to break mode.
Using the logic laid out above the support&resistance indicator will show the turning points of the market in a timely manner. Depending on level of market-smoothing it will show the long term or short term turning points.
This script first calculates the first and second deviation of the smoothed market, and in a second step runs the turning point detection.
Style tags: Trend Following, Trend Analysis
Asset class: Equities, Futures, ETFs, Currencies and Commodities
Dataset: FX Minutes/Hours/Days
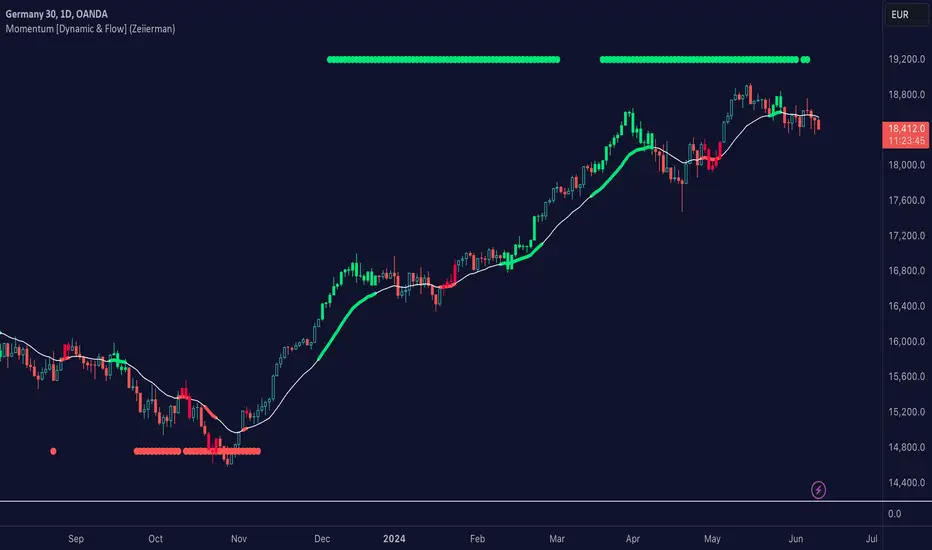
Momentum [Dynamic & Flow] (Expo)Momentum Dynamic & Flow (Expo) is a useful indicator that displays the momentum - as dynamic & flow, as well as where the momentum begins to stall.
♢ Momentum -Dynamic can be used to identify overbought and oversold areas.
♢ Momentum -Flow can be used to identify if the current trend has strong momentum.
♢ When momentum begins to stall it can be identifiable turning points, areas of congestion. However, it's not a sign that the trend is over, see it as "heads up" This is displayed with green and red colors on the moving average.
Momentum can be displayed at the top/bottom of the chart or above/below the bars. The user can also display momentum as BGcolor.
The indicator can be used standalone or as a part of your current trading strategy
HOW TO USE
1. Use the indicator to identify where the momentum stall.
2. Use the indicator to identify overbought/oversold areas with momentum -Dynamic.
3. Use the indicator to confirm the existence, or a continuation, of a trend with momentum -Flow.
INDICATOR IN ACTION
1-hour chart
4-hour chart
I hope you find this indicator useful , and please comment or contact me if you like the script or have any questions/suggestions for future improvements. Thanks!
I will continually work on this indicator, so please share your experience and feedback as it will enable me to make even better improvements. Thanks to everyone that has already contacted me regarding my scripts. Your feedback is valuable for future developments!
-----------------
Disclaimer
Copyright by Zeiierman.
The information contained in my scripts/indicators/ideas does not constitute financial advice or a solicitation to buy or sell any securities of any type. I will not accept liability for any loss or damage, including without limitation any loss of profit, which may arise directly or indirectly from the use of or reliance on such information.
All investments involve risk, and the past performance of a security, industry, sector, market, financial product, trading strategy, or individual’s trading does not guarantee future results or returns. Investors are fully responsible for any investment decisions they make. Such decisions should be based solely on an evaluation of their financial circumstances, investment objectives, risk tolerance, and liquidity needs.
My scripts/indicators/ideas are only for educational purposes!
Support and Resistance Multi Time frameSimple indicator showing the support and resistance on Daily, Weekly and Monthly time frames no matter what time frame you're currently on by highlighting the highest and lowest points on each over the last 34 bars.
Daily support and resistance are coloured green.
support and resistance are coloured yellow.
Monthly support and resistance are coloured red.
For best results check where multiple support and resistance areas line up and combine with another indicator for example oscillators to gauge if the support or resistance will reverse the market.

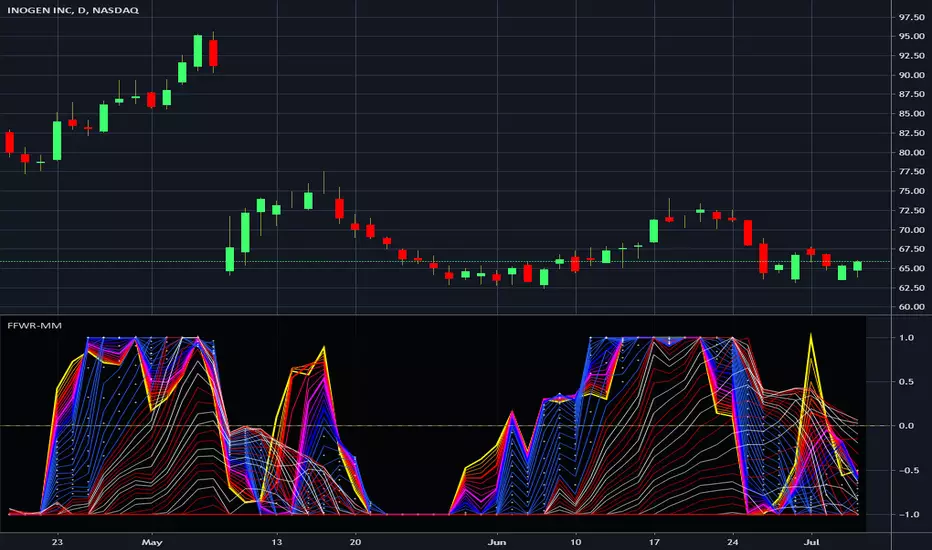
Financial Freedom WaveRipper - Momentum MulticatorIn the Spirit of '76 commemorating this day on July 4th, this is my third indicator released using Pine Script version 4.0, something I contributed to often in a small role, and will continue to do, in my free time. Without revealing my American secret sauce ingenuity excessively, this indicator uses a high performance momentum algorithm that blows most momentum algorithms out the water. It's characteristics display blatantly the swift momentum at which directional high speed wind driven swells create rip tides in an asset. Not being drug out to sea and quickly going "under water" so to speak, is best mitigated by very timely, accurate information. Regarding the use of this script, the bright yellow line has a damping factor of 4 and the longest adjustable damping factor is 66.
My idea initially was... while there is great "one liner indicators" to use, I thought, why not multi-line "multicators" with little to adjust concerning dominant cycle fluctuations in the market. And voila, another radical experiment, turned visually compelling, similar to tumultuous ocean waves and how incredibly fast turning points can wax and wane, yet be anticipated. Living in America, I was once again determined to attain a replica of "Old Glory" in this companion multicator as well. It's embedded artwork makes it an articator too. Which is why I waited to release this sibling appropriately on July 4th too, a day of celebration of freedom, an empowering idea that has reached dessimenation world wide to so many other nations and peoples.
I once again would personally like to thank the talented individuals at TV for providing a platform that embraces an initial free membership, which I first obtained myself, for people like me to freely code in Pine with mathemagical ideas and mental wizardry, creating ultimately, inventions like this eye candy display above.
Features List Includes:
"Source" Selection
Enable/disable dark background for enhanced visibility
Longest period adjustment providing any adjustable period setting
A subtly adjustable multiplier tweak
Minimalized enable/disable adjustment for the theme
This is not a freely available indicator, FYI. To witness my Pine poetry in action, properly negotiated requests for unlimited access, per indicator, may ONLY be obtained by direct contact with me using TV's "Private Chats" or by "Message" in my member name above. The comments section below is solely just for commenting and other remarks, ideas, compliments, etc... If you do have any questions or comments regarding this indicator, I will consider your inquiries, thoughts, and ideas presented below in the comments section, when time provides it. As always, "Like" it if you like it, and also return to my scripts list occasionally for additional postings. Have a profitable future everyone!

Support/Resistance PivotsSupport/Resistance bars based on previous pivot points (no repainting) with added filters.
Looking at potential improvements. Updates to come.

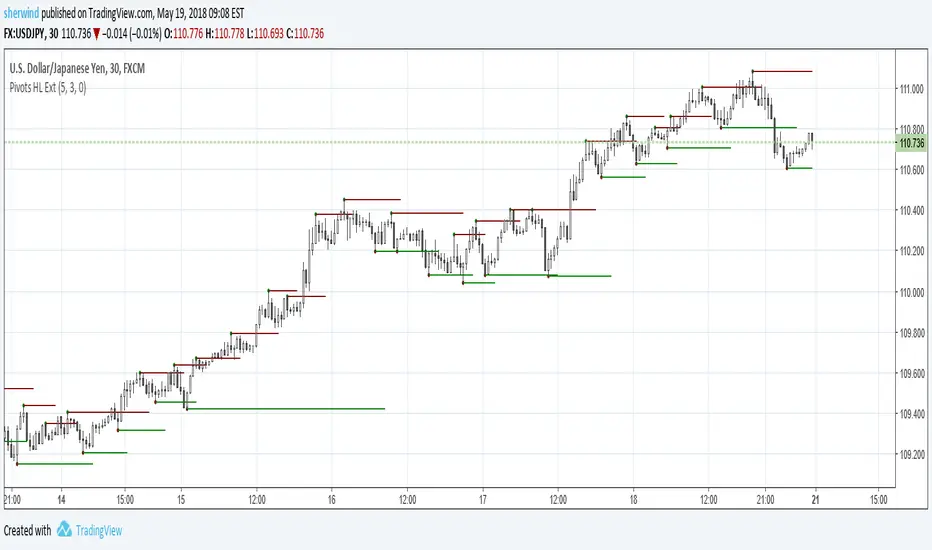
Pivot Points High Low ExtensionPivot Points High Low Extension
See Also:
- A Simple 1-2-3 Method for Trading Forex
- The Classic 1-2-3 Pattern: An Underestimated Powerhouse
- Bulkowski's 1-2-3 Trend Change