Oscillator buy and sellThe oscillator in the provided script is a custom indicator designed to help identify choppy market conditions and generate buy and sell signals based on the direction of the price movement. It is derived from the ATR (Average True Range) and the percentage of the ATR relative to the closing price. When the ATR percentage is below the specified threshold, the market is considered choppy. In this script, the oscillator has a value of 1 when the closing price is higher than the opening price, and -1 when the closing price is lower than the opening price.
How to use the buy and sell signals:
1. Buy Signal: When the oscillator transitions from a negative value to a positive value, a buy signal is generated. This indicates that the price is moving upwards, and it might be a good opportunity to enter a long position. A green arrow will appear below the candlestick where the buy signal is generated.
2. Sell Signal: When the oscillator transitions from a positive value to a negative value, a sell signal is generated. This indicates that the price is moving downwards, and it might be a good opportunity to enter a short position or close an existing long position. A red arrow will appear above the candlestick where the sell signal is generated.
It is essential to remember that this oscillator is a simple tool and should not be solely relied upon for making trading decisions. It is recommended to use this oscillator in conjunction with other technical analysis tools and indicators to improve the accuracy of your trading decisions. Additionally, always consider your risk tolerance and trading strategy before entering or exiting trades.
Unitedstates

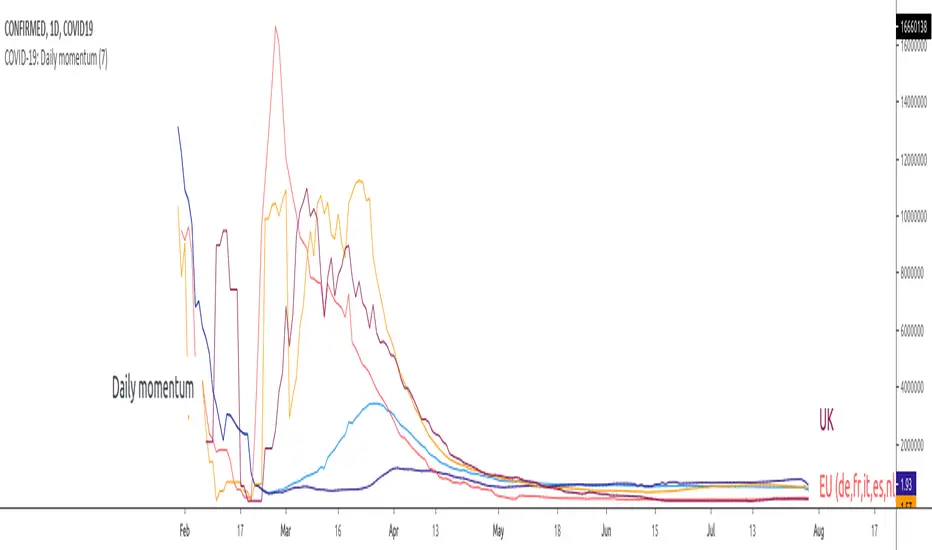
COVID-19: Daily momentumThis indicator shows 14-days moving average of daily rate of change (momentum, acceleration), in other words:
- up trends means that virus accelerates at the rate displayed on the right scale
- consolidation/horizontal movement - virus spreads at constant rate
- down trend - virus looses momentum IMPORTANT: the virus STILL accelerates but at a lower rate
By default the graphic displays World vs. EU vs. US vs. Asia while individual countries are available in Settings.
- EU includes the following countries (DE, FR, IT, ES, CH), all with more than 10k confirmed cases and more than 1k new daily infections.
- Asia includes CH and KR
To use the indicator it is important to disconnect main chart from the right scale, on main chart click on More (the 3 dots) -> Pin to scale -> Select "No Scale".
COVID-19: Daily changeNew daily infections (daily change) of COVID-19.
The chart shows new daily cases across the entire planet, the US, EU (de+fr+it+es only) and a small country (RO) that does not matter to anybody but me. You can show/hide different country in Settings.
Select "COVID-19: CONFIRMED" data in main chart and add the indicator.

USO - Adam Smith - Moving Average Cross StrategySimple Moving Average strategy for USO - United States Oil Fund . This strategy can be used on stocks and currencies but will need to tweak frequency on chart and backtest Max Draw Down to Net Profit ratios for maximum dollar gains.
