Williams Percent Range with Trendlines and BreakoutsHere is my "Williams Percent Range with Trendlines and Breakouts" indicator, a simple yet powerful tool for traders. This indicator combines the classic Williams %R oscillator, which helps identify overbought and oversold levels, with added trendlines for easier trend analysis at a glance.
It's designed to make spotting potential breakouts easier by drawing attention to significant price movements. With customizable settings for the Williams %R period and trendline sensitivity, it's a flexible tool for various symbols and trading styles.
Whether you're looking to refine your trading strategy or just need a clearer view of market trends, this indicator should offer a straight forward approach to hopefully enhance your trading decisions.
Disclaimer: This indicator is intended for educational and informational purposes only. Always conduct your own research and analysis before making trading decisions.
Crude Oil WTI

BE - Golden Cross Crude KeyTraders, i have been observing crude oil for about 3 months now and somehow I can see that crude is respecting 42 days Moving average and crosses have created massive spikes most of the time.
However you need to be mindful of the time to trade and timeframe since not all crosses creates spikes.
Note: I have been testing on a 15min timeframe.
Keeping this in mind, this indicator is a automated solution which takes trade entries on crosses plus buffer and exits based on the specified Sl type.
Enjoy!
DISCLAIMER: No sharing, copying, reselling, modifying, or any other forms of use are authorized for our documents, script / strategy, and the information published with them. This informational planning script / strategy is strictly for individual use and educational purposes only. This is not financial or investment advice. Investments are always made at your own risk and are based on your personal judgement. I am not responsible for any losses you may incur. Please invest wisely.
Happy to receive suggestions and feedback in order to improve the performance of the indicator better.

EIA Crude Oil Stock StatisticsJapanese below / 日本語説明は下記
Dear Oil Traders/Investors,
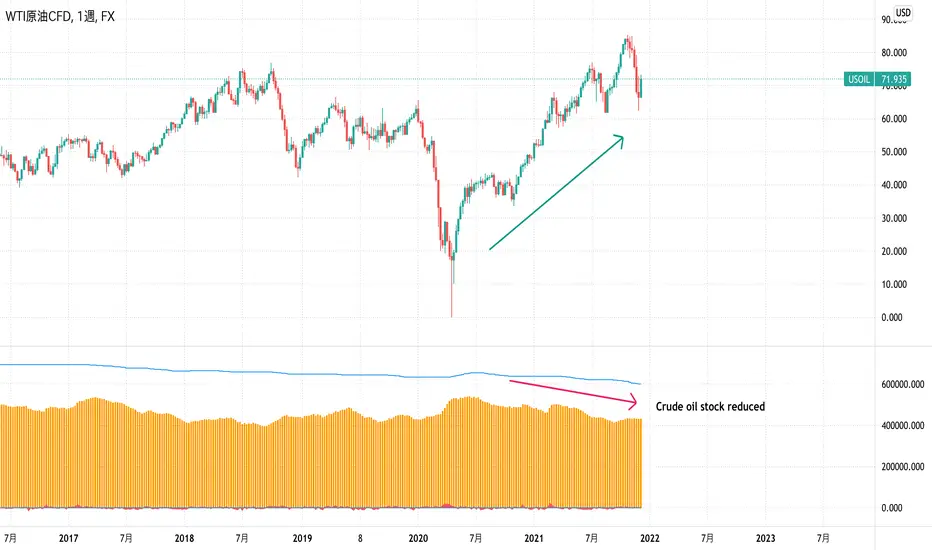
I have created this indicator which shows EIA crude oil stock statistics provided by EIA(U.S. Energy Information Administration).
Like other commodities, oil prices are highly affected by demand and supply and increase/decrease of crude oil stock cause crude oil price fluctuation.
This indicator is created to help oil traders/investors easily analyze crude oil statistics along with price movement.
It displays the following data as per data released by EIA on weekly basis. (Data source is quandle.com)
-Crude Oil Ending Stock
-Crude Oil SPR Ending Stock
-Stock changes from previous week(Calculated by the indicator)
-% changes(Calculated by the indicator)
Enjoy!
============================
原油トレーダー/投資家の皆さん
EIA(米エネルギー省エネルギー情報局)が公表している原油在庫統計をサブウィンドウに表示するインジケーターを開発しました。
他のコモディティと同様に、原油価格は需要と供給に大きく影響を受けます。
特に原油在庫の増減は原油価格を変動させる要因の一つです。
このインジケーターは原油トレーダー/投資家が原油在庫統計を価格の動きとともに容易に分析できることを目的としています。
EIAから週単位で公開されるデータのうち、以下のデータを表示します。(データソースはquandle.comです。)
-原油在庫
-SPR在庫
-原油在庫変動数(対前週比)
-原油在庫変動率(%)(対前週比)
Intraday BUY/SELLBUY & SELL Scalp Signals for Crude Oil Future Contracts (Or it can be used with any scrip with good amount of Volume) based on Sma & RSI overbought/oversold alert (!) for possible reversal indication.
Take Buy position only if candle breaks the high of alert candle & for Sell positions, take position if candle breaks low of the alert candle.
Best to perform with 3 min timeframe on Crude Oil Futures

ZoneBand (@Mido_yuiya)Bollinger band is converted to EMA , and support and resistance bands are made into regions

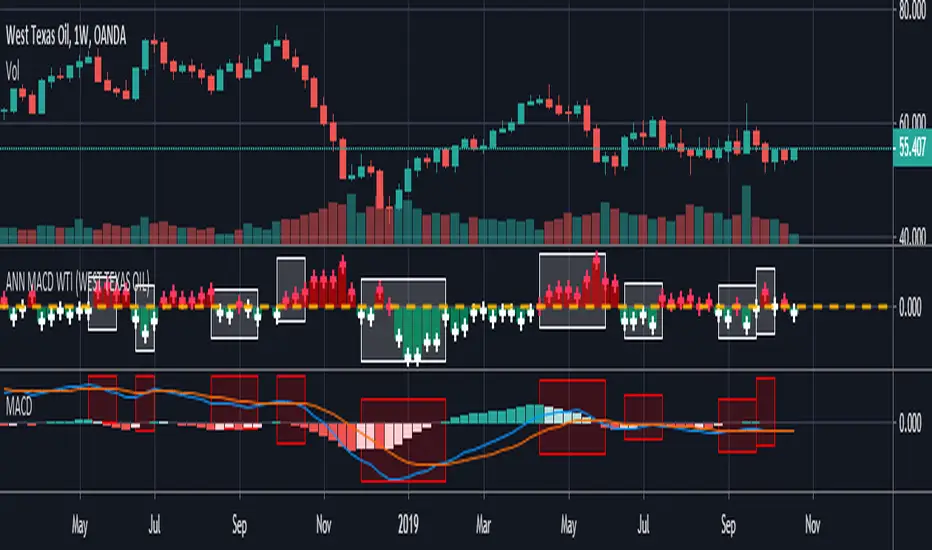
ANN MACD WTI (West Texas Intermediate) This script created by training WTI 4 hour data , 7 indicators and 12 Guppy Exponential Moving Averages.
Details :
Learning cycles: 1
AutoSave cycles: 100
Training error: 0.007593 ( Smaller than average target ! )
Input columns: 19
Output columns: 1
Excluded columns: 0
Training example rows: 300
Validating example rows: 0
Querying example rows: 0
Excluded example rows: 0
Duplicated example rows: 0
Input nodes connected: 19
Hidden layer 1 nodes: 2
Hidden layer 2 nodes: 6
Hidden layer 3 nodes: 0
Output nodes: 1
Learning rate: 0.7000
Momentum: 0.8000
Target error: 0.0100
Special thanks to wroclai for his great effort.
Deep learning series will continue. But I need to rest my eyes a little :)
Stay tuned ! Regards.
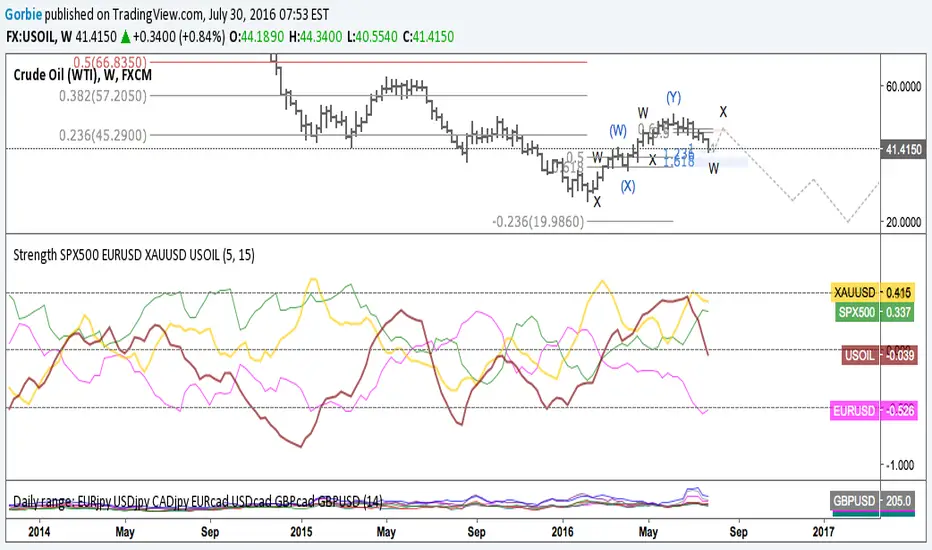
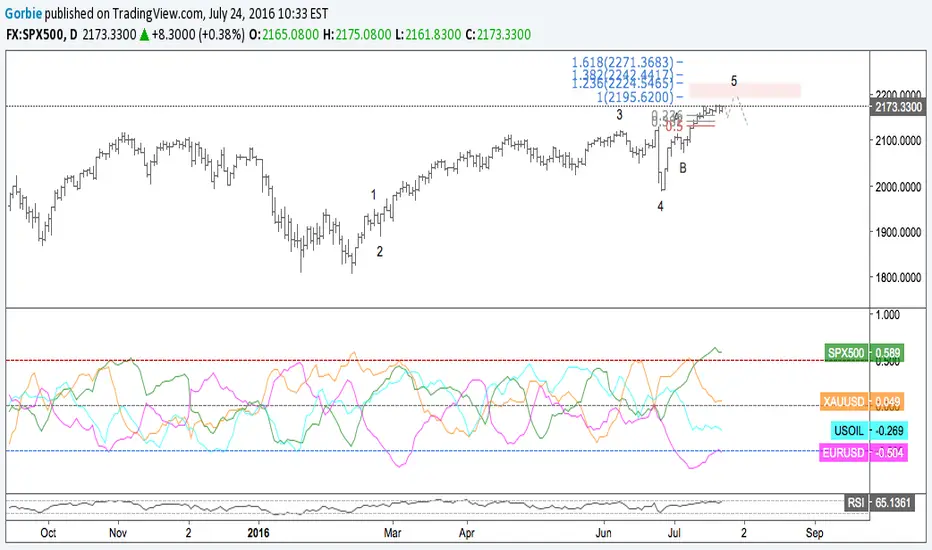
Strength SPX500 EURUSD XAUUSD USOILStrength of SPX500, EURUSD, XAUUSD and US OIL.
Buy or sell on extreme of strength into the overbought or the oversell.