HMA Pro Flow [Mladen] + SignalsThis indicator is an enhanced version of the classic Hull Moving Average (HMA), based on the logic developed by Mladen. It improves upon the standard HMA by allowing users to adjust the "speed" of the curve using a custom Divisor, and it integrates a secondary Trend Filter to generate high-probability entries and distinct exit signals.
The script is designed to help traders identify the trend direction while filtering out noise during choppy markets.
How It Works
1. The "Mladen" Calculation
The standard Hull Moving Average uses a fixed formula involving a divisor of 2 (n/2). This script exposes that divisor as a variable input.
2. Dual-HMA System
This indicator runs two separate HMA calculations simultaneously:
Entry HMA (Fast): Reacts quickly to price changes to generate immediate signals.
Trend Filter (Slow): A longer-term HMA used to determine the overall market bias.
Signal Logic
The indicator generates three types of signals based on the alignment of the Fast Entry HMA and the Slow Trend Filter.
🟢 BUY Signal (Green Label)
Condition: The Fast HMA turns green (rising) AND the Trend Filter is also green (rising).
Meaning: Momentum and Trend are aligned. Safe to enter Long.
🔴 SELL Signal (Red Label)
Condition: The Fast HMA turns red (falling) AND the Trend Filter is also red (falling).
Meaning: Momentum and Trend are aligned. Safe to enter Short.
❌ STOP / CLOSE Signal (Orange 'X')
Condition: The Fast HMA changes color, but it conflicts with the Trend Filter.
Example (Long): You are in a Buy trade. The Fast HMA turns Red, but the Trend Filter is still Green.
Meaning: This is likely a pullback, not a reversal. The indicator suggests closing the current position (Stop) but does not issue a signal to reverse into a new position. This prevents getting trapped in counter-trend trades.
Settings
Entry HMA Settings
Entry Period: Length of the fast signal line (Default: 14).
Entry Divisor: Controls smoothness. Lower values (e.g., 0.1) result in a very smooth line; higher values result in sharper turns.
Trend Filter Settings
Use Trend Filter: If unchecked, the indicator acts like a standard HMA (Buying/Selling on every color change).
Filter Period: Length of the slow trend line (Default: 300).
Show Filter: Toggles the visibility of the thick trend line on the chart.
Visuals
Toggle visibility for Buy, Sell, and Stop signals individually to keep your chart clean.
Credits
Original HMA logic by Alan Hull.
Variable divisor concept adapted from Mladen's work on MT4/MT5.
Custom pine scripting for trend filtering and signal logic - Vdubus
Vdubus

Expansion Setup: Entries & structure + AlertsThis is a specific market condition often called a Broadening Formation or an Expansion Move, where volatility increases enough to break both the previous structural low and then immediately break the previous structural high (or vice versa).
1. LL to HH: A New Lower Low is formed, followed immediately by a New Higher High.
2. HH to LL: A New Higher High is formed, followed immediately by a New Lower Low.
3. Entry Levels: When a setup is detected (LL ➔ HH or HH ➔ LL), the script now draws two specific entry lines extending forward:
The "Breaker" Level: The previous structure point that was broken. (Often a safe retest entry).
The 50% Retracement: The midpoint of the expansion move (The "Equilibrium" or "Discount" entry).

Smart Signals [Vdubus]Smart Signals
Concept & Philosophy
Smart Signals is a "Regime-Filtered" oscillator designed to solve the biggest problem with standard indicators: Counter-trend noise.
Most oscillators (like Stochastic or RSI) are "dumb" to market context—they will signal "Sell" continuously during a strong uptrend simply because the price is high. Smart Signals fixes this by first determining the Market Regime (Bullish or Bearish) and then strictly filtering out any signal that contradicts that trend.
It creates a "Tiered" trading system that separates standard trend-following entries from high-probability "Sniper" entries (Hidden Divergence), all presented in a clean, color-blind-friendly visual interface.
Core Functions
1. The "Sheriff" (Trend Filter)
At the heart of the indicator is a heavy, modified Hull Moving Average (HMA 200) that acts as the trend baseline.
Bullish Regime: When the baseline is sloping UP, the indicator enters "Buy Only" mode. All Sell signals are mathematically deleted.
Bearish Regime: When the baseline is sloping DOWN, the indicator enters "Sell Only" mode. All Buy signals are mathematically deleted.
The Math: It uses a custom difference-weighted formula (wmaHalf = Length / 1) to create a stable, chop-resistant trend anchor.
2. Dual-Signal Engine
The indicator scans for two distinct types of entries simultaneously:
♦ Standard Signals (Blue/Red Diamonds):
Logic: A classic Stochastic pullback (Cross 20/80) aligned with the trend.
Use Case: These are frequent "Bread and Butter" trend entries. They are excellent for scaling into a position or adding to a winner as the trend continues.
Location: Plotted at the top (Sell) and bottom (Buy) edges of the panel.
+ Sniper Signals (Gold Crosses):
Logic: Hidden Divergence. The script detects when Price holds structure (Higher Low) while Momentum resets (Lower Low). This is a "Slingshot" setup.
Use Case: These are rare, high-conviction entries. They often mark the end of a complex correction and the resumption of the main trend.
Location: Plotted on the Zero Line to indicate structural strength.
3. Smart Momentum Histogram
The histogram visualizes the "Energy" of the move (MACD 21, 34, 7), but with a twist. It is color-coded to the signal priority:
Gold Bars: A Sniper (Divergence) setup is active.
Solid Blue/Red Bars: A Standard Signal is active.
Faded Blue/Red Bars: The trend is active, but momentum is resetting (waiting mode).
Gray Bars: Counter-trend noise (Ignore).
How to Trade It
Check the "Road": Look at the general color of the histogram columns.
Blue Columns: Look for Longs.
Red Columns: Look for Shorts.
The "Sniper" Entry: Wait for a Gold Cross (+) on the zero line. This is your primary signal to enter a trade with normal risk.
The "Pyramid" Entry: If the trend continues and you see Blue/Red Diamonds (♦) appear at the edges, these are safe places to add to your position.
The Exit: Since this is a trend-following tool, exit when the histogram color flips (e.g., from Blue to Red/Gray), or use your own support/resistance targets.
Alerts Configuration
The indicator comes with a full suite of alerts for automation:
Gold Buy / Gold Sell: Notifies you only for the high-probability Hidden Divergence setups.
Standard Buy / Standard Sell: Notifies you for every trend pullback.
ANY BUY / ANY SELL: A combo alert that triggers on either signal type (useful for simplifying your alert limits).
Accessibility
Color Blind Friendly: The default palette uses High-Contrast Blue (#2962FF) and Soft Red (#FF5252) instead of standard Green/Red, ensuring visibility for all users.
Zero Clutter: No text labels or confusing lines. Just clear, distinct shapes (Diamonds and Crosses) at fixed locations.

Vdubus TrixStoch + HMA FilterThe Bottom Indicator: "Vdubus TrixStoch HMA"
Purpose: Precision timing. It shows you exactly when the pullbacks happen.
The Top Indicator: "Vdubus Momentum Lock (Overlay)"
The Trigger Zones (48 / 52):
Buy Zone (Below 48): When the Blue line dips into this zone, the market is "reloading" for a buy.
Sell Zone (Above 52): When the Blue line pops into this zone, the market is "reloading" for a sell.
The Confluence Circles:
Green Dot ("Dip"): Appears only if HMA is Green AND Trix is Rising. This filters out bad buy signals during downtrends.
Red Dot ("Rally"): Appears only if HMA is Red AND Trix is Falling. This filters out bad sell signals during uptrends.
3. The Strategy:
A. Entry Logic (The Sniper)
Trend Check: Is HMA 100 Green or Red?
Momentum Check: Is TRIX 34 agreeing with the HMA?
Trigger:
Buy: Stoch K crosses under 48.
Sell: Stoch K crosses over 52.
Pulse Re-Entry: If Trix momentum was lost briefly but snaps back into alignment, re-enter immediately (even without a Stoch signal).
B. Exit Logic (The Safety)
Momentum Exit: If the TRIX slope flips against you (e.g., you are Long, but Trix turns down), CLOSE IMMEDIATELY.
Hard Deck (HMA Flip): If the HMA line changes color, CLOSE EVERYTHING. This is the emergency brake.

Vdubus Momentum Lock (Overlay)The Top Indicator: "Vdubus Momentum Lock (Overlay)"
The Bottom Indicator: "Vdubus TrixStoch HMA"
Purpose: Precision timing. It shows you exactly when the pullbacks happen.
The Trigger Zones (48 / 52):
Buy Zone (Below 48): When the Blue line dips into this zone, the market is "reloading" for a buy.
Sell Zone (Above 52): When the Blue line pops into this zone, the market is "reloading" for a sell.
The Confluence Circles:
Green Dot ("Dip"): Appears only if HMA is Green AND Trix is Rising. This filters out bad buy signals during downtrends.
Red Dot ("Rally"): Appears only if HMA is Red AND Trix is Falling. This filters out bad sell signals during uptrends.
3. The Strategy:
A. Entry Logic (The Sniper)
Trend Check: Is HMA 100 Green or Red?
Momentum Check: Is TRIX 34 agreeing with the HMA?
Trigger:
Buy: Stoch K crosses under 48.
Sell: Stoch K crosses over 52.
Pulse Re-Entry: If Trix momentum was lost briefly but snaps back into alignment, re-enter immediately (even without a Stoch signal).
B. Exit Logic (The Safety)
Momentum Exit: If the TRIX slope flips against you (e.g., you are Long, but Trix turns down), CLOSE IMMEDIATELY.
Hard Deck (HMA Flip): If the HMA line changes color, CLOSE EVERYTHING. This is the emergency brake.

HMA 34 Dual-Fractal Projections - VdubusVdubus MacD Divergence Trend Break Signal Generator :Here:-
HMA 18 Dual-Fractal Projections
Overview
The HMA 18 Dual-Fractal Projections is a technical analysis tool designed to identify market structure and potential breakout patterns by analyzing the pivots of a Hull Moving Average (HMA).
Unlike standard trendline indicators that struggle to balance "big picture" trends with immediate price action, this indicator utilizes a Dual-Fractal approach. It simultaneously calculates two separate timelines—Macro and Micro—to visualize both the dominant channel and the developing chart patterns (such as wedges or triangles) in real-time.
Visual Guide
The indicator plots three key elements on the main chart:
The HMA Line (Blue): A smooth, fast-acting moving average (default length 34) that serves as the baseline for all calculations.
Macro Structure (Solid, Thick Lines):
Red (Solid): Major Resistance.
Green (Solid): Major Support.
Purpose: Identifies the long-term trend channel. These lines react slowly and filter out noise.
Micro Structure (Dashed, Thin Lines):
Red (Dashed): Immediate Resistance.
Green (Dashed): Immediate Support.
Purpose: Identifies the short-term market structure. These lines react quickly to show forming wedges, triangles, or flags.
How It Works
The indicator applies a "Pivot High/Low" algorithm directly to the HMA data rather than raw price data. This filters out candle wicks and volatility, ensuring lines are drawn based on established momentum shifts.
Layer 1 (Macro): Uses a large "Lookback" period (default 44 bars) to find significant peaks and valleys. It connects the most recent major pivot to the previous one, projecting a line forward to show where the major trend channel lies.
Layer 2 (Micro): Uses a small "Lookback" period (default 10 bars) to find local peaks and valleys. This allows you to see how price is behaving within the larger channel.
Settings & Configuration
HMA Settings
HMA Length: The length of the Hull Moving Average.
Default: 34 (Matches the "visually pleasing" setting from recent testing).
Note: Set to 18 for a faster, more reactive baseline (scalping).
Layer 1: Macro (Big Channel)
Macro Lookback: Determines how many bars must pass before a peak is confirmed.
Default: 44. High values find broad, established channels.
Max Macro Lines: How many historical lines to keep on the chart.
Default: 1 (Keeps the chart clean, showing only the current structure).
Extend Macro Lines: Projects the lines infinitely to the right to predict future support/resistance zones.
Layer 2: Micro (Current Pattern)
Micro Lookback: A lower sensitivity setting to catch immediate structure.
Default: 10. Low values will pinpoint the exact boundaries of small wedges or flags forming right now.
Trading Strategy & Interpretation
1. The "Squeeze" (Wedge Identification) This is the primary use case.
Look for scenarios where the Macro Lines (Solid) are wide/parallel, but the Micro Lines (Dashed) are rapidly converging (pointing towards each other).
This indicates that while the main trend is intact, momentum is compressing. A breakout is imminent where the dashed lines intersect.
2. Trend Channels
When both Solid and Dashed lines are roughly parallel and sloping in the same direction, the trend is healthy and strong. Price is respecting both the short-term and long-term momentum.
3. Divergence / Early Reversal Warning
If the Macro Line is sloping UP, but the Micro Line starts sloping DOWN (crossing inside), it indicates a loss of momentum and a potential reversal before the price actually breaks the major trendline.
===========================================================================
2. Micro/Macro Cross Alert
A new input, Enable Micro/Macro Cross Alert, has been added under the "Alerts & Features" section.
This alert condition is triggered when the momentum of the Micro Structure exceeds the momentum of the Macro Structure, which is a high-probability signal for a breakout:
Bullish Alert: The Micro High (dashed red line) crosses above the Macro High (solid red line).
Bearish Alert: The Micro Low (dashed green line) crosses below the Macro Low (solid green line).
To set up the actual alert on your chart:
Right-click on the chart.
Select "Add alert on HMA 34 Dual-Fractal Projections".
In the Condition dropdown, select the indicator's name.
For the main alert criteria, choose "Any alert()".
Select your preferred alert actions (e.g., notification, email).

Vdubus Divergence Wave Pattern Generator V1The Vdubus Divergence Wave Theory
10 years in the making & now finally thanks to AI I have attempted to put my Trading strategy & logic into a visual representation of how I analyse and project market using Core price action & MacD. Enjoy :)
A Proprietary Structural & Momentum Confluence SystemPart 1: The Strategic Concept1. The Core Philosophy: "Geometry + Physics"Traditional technical analysis often fails because traders confuse location with timing.Geometry (Price Patterns): Tells us WHERE the market is likely to reverse (e.g., at a resistance level or harmonic D-point).Physics (Momentum): Tells us WHEN the energy driving the trend has actually shifted. The Vdubus Theory posits that a trade should never be taken based on Geometry alone. A valid signal requires a specific, fractal decay in momentum—a "Handshake" between price structure and energy exhaustion.2. The 3-Wave Momentum Filter (The Engine)Most traders look for simple divergence (2 points). The Vdubus Theory demands a 3-Wave Structure to confirm the true state of the market.A. The Standard Reversal (Exhaustion)This is the "Safe" entry, catching the slow death of a trend.Wave 1 $\rightarrow$ 2 (The Warning): Price pushes higher, but momentum is lower (Standard Divergence). This signals that the trend is tapping the brakes.Wave 2 $\rightarrow$ 3 (The Confirmation): Price pushes to a final extreme (often a stop-hunt), but momentum is flat or lower than Wave 2 ("No Divergence").The Logic: This confirms that the buyers have expended all remaining energy. The engine is dead.
B. The Climax Reversal (The Trap)This is the "Aggressive" entry, catching V-shape reversals.Wave 1 $\rightarrow$ 2 (The Bait): Price pushes higher, and momentum is Stronger/Higher (No Divergence). This sucks in retail traders who believe the trend is accelerating.Wave 2 $\rightarrow$ 3 (The Snap): Price pushes again, but momentum suddenly collapses (Divergence).The Logic: A "Strong to Weak" shift. The market traps traders with a show of strength before hitting a "concrete wall" of limit orders.C. The Predator (The Trend Continuation)The Logic: Trends rarely move in straight lines. The "Predator" looks for Hidden Divergence during a pullback.The Signal: Price makes a Higher Low (Trend Structure Intact), but Momentum makes a Lower Low (Oversold Trap). This signals the end of the correction and the resumption of the main trend.3. The "Clean Path" PrincipleA trade is only valid if there is no opposing force. If you are looking to Sell (Bearish Reversal), the opposing Bullish momentum must be weak or neutral. If the "Enemy" is strong, the trade is skipped.
Part 2: The Indicator Breakdown
Tool Name: Vdubus Divergence Wave Pattern Generator V1
This script automates your analysis by combining ZigZag Pattern Recognition (Geometry) with your Custom MACD Logic (Physics).
1. The "Golden" Settings
The physics engine is tuned to your specific discovery:
Fast Length: 8
Slow Length: 21
Signal Length: 5
Lookback: 3 (Sensitive enough to catch the exact pivot points).
2. Signal Generation Logic
The indicator scans for four distinct setups. Here is the exact logic code translated into English:
Signal 1: Standard Reversal (Green/Red Pattern)
Geometry: The ZigZag algorithm identifies a 5-point structure (X-A-B-C-D), such as a Gartley, Bat, or Butterfly.
Physics Check:
Finds the last 3 momentum peaks matching the price highs.
Rule: Momentum Peak 2 must be < Peak 1 (Divergence).
Rule: Momentum Peak 3 must be <= Peak 2 (Confirmation/No Div).
Output: Draws the colored pattern and labels it (e.g., "Bearish Gartley (Exhaustion)").
Signal 2: Climax Reversal (Orange Pattern)
Geometry: Identifies the same 5-point structures.
Physics Check:
Rule: Momentum Peak 2 is >= Peak 1 (Strength/No Div).
Rule: Momentum Peak 3 is < Peak 2 (Sudden Failure/Div).
Output: Draws the pattern in Orange labeled "⚠️ CLIMAX REVERSAL". This is your "Trap" detector.
Signal 3: Rounded Top/Bottom (Navy/Maroon Label)
Geometry: Price is compressing or rounding over.
Physics Check:
Scans for 4 consecutive waves of momentum decay.
Rule: Peak 1 > Peak 2 > Peak 3 > Peak 4.
Output: Places a label indicating a "Multi-Wave Decay," identifying turns that don't have sharp pivots.
Signal 4: The Predator (Purple Pattern)
Geometry: Identifies a trend pullback (Higher Low for Buys).
Physics Check:
Rule: Momentum makes a Lower Low while Price makes a Higher Low (Hidden Divergence).
Output: Draws a Purple pattern labeled "🦖 PREDATOR" to signal trend continuation.
3. The Confluence Dashboard
Located in the corner of the screen, this provides a final "Safety Check."
Logic: It compares the absolute value (strength) of the most recent Bearish Momentum Peak vs. the most recent Bullish Momentum Low.
Output:
Green (Bulls Strong): Buying pressure is dominant. Safe to Buy, Dangerous to Sell.
Red (Bears Strong): Selling pressure is dominant. Safe to Sell, Dangerous to Buy.
Grey (Neutral): Forces are balanced.
Summary of Potential
This system solves the "Trader's Dilemma" of entering too early or too late. By waiting for the 3rd Wave, you effectively filter out the market noise and only commit capital when the opposing side has structurally and physically collapsed. It transforms trading from a guessing game into a disciplined execution of identifying Geometric Exhaustion.
Logic 1 / PREVIOUS DIVERGENCE PROJECTS future TREND BREAKS / Reversals *Not in script*
Logic 2 / Wave 1 to 2 = Divergence / Wave 2 to 3 = NO divergence = Signal
Reverse logic: Wave 1 to 2 = NO Divergence / Wave 2 to 3 = Divergence = Signal

Vdub FX SniperVX3 / Strategy Alerts BetaThis is nothing other than a simple alert script I created for Vdub FX Sniper VX3 / Strategy by Vdubus
Thank you to WillowGoLightly for coming to me with the idea.
Change Log:
Removed plots & layover
Added a simple alert indicator to match original
Be sure to give Vdubus a big thanks!
Original Sniper Script by Vdubus:
Disclaimer: I have never used this indicator or alert script. There may be several unknown bugs. If found, please feel free to comment below and I will attempt to fix them. Use at your own risk.

Binary Options Tester w/ Vdubus money managementAdded implementation of vdubus's money management strategy to binary options tester. As before, the entry/exit strategy is just there for an example, modify go_down and go_up for your strategy as the short and long entry points. Also as before, do not use present variables (i.e. close, close , ema_6_min in the example) in go_up and go_down, as this is akin to having future information. Calling past forms of compound present variables (ema(close,6) ) is fine.

Nadex Fx Volume Indicator Vv1By request
Nadex Fx Volume Indicator Vv1
Original source code & Credit goes to: Pip Foundry - Forex Market Volume from IDC
modified & replaced fx pairs to corrospond with Nadex spot/fx instruments // www.nadex.com

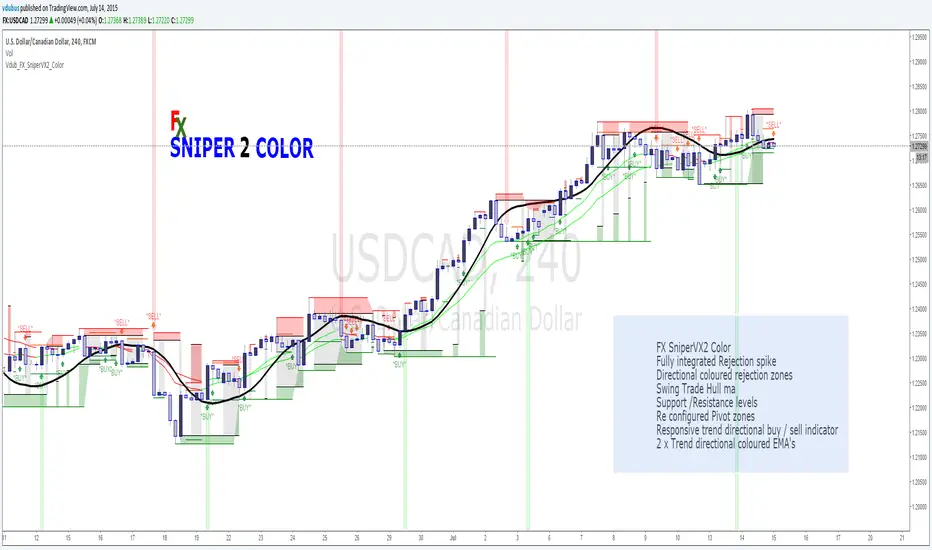
Vdub FX SniperVX2 Color v2FX SniperVX2 Color
Fully integrated Rejection spike
Directional coloured rejection zones
Swing Trade Hull ma
Support /Resistance levels
Re configured Pivot zones
Responsive trend directional buy / sell indicator
2 x Trend directional coloured EMA's
Sniper series
Vdub_BinaryBands_v1Combined 3 x Bollinger Bands With BUY & SELL zones
EMA,
Wma
SMA
Multiplier adjustment

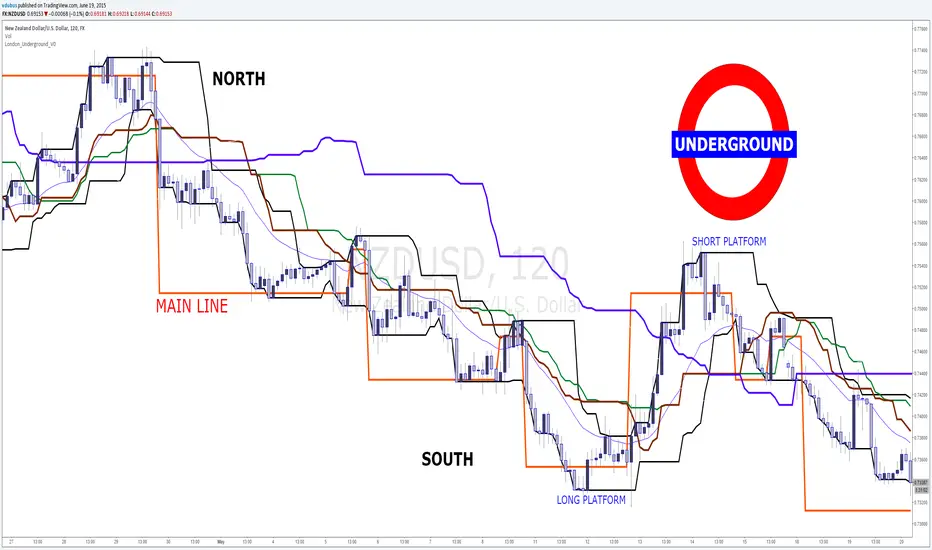
London_Underground_V0www.vdubus.co.uk
Another coding mashup experiment
It's as simple as London Underground, when price exits the 'RED' main line board the train & get off at the next platform :)
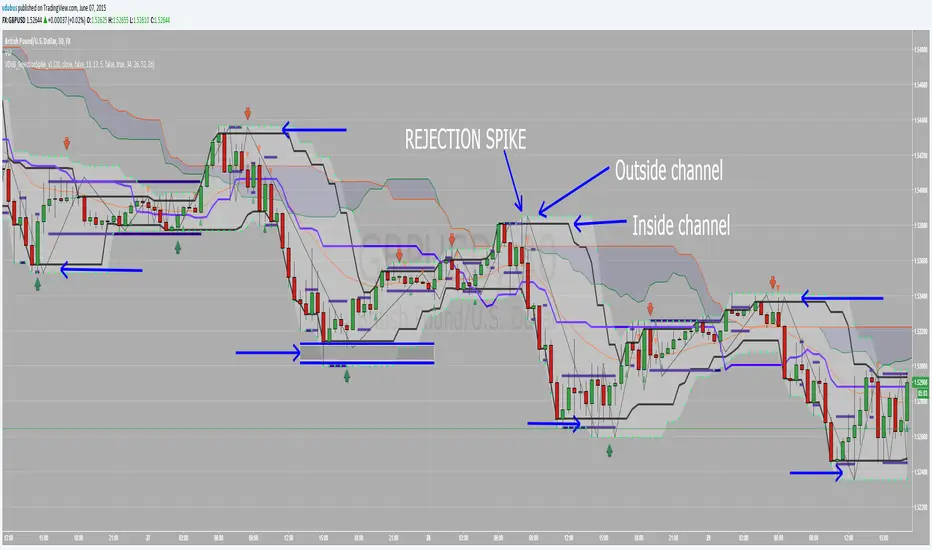
VDUB_RejectionSpike_v1 this indicator is for use with the Rejection Spike Strategy I recently publish
Have't had chance to test it yet so feel free to try.
Details of the strategy are listed in the link below
VDUB_BINARY_PRO_3NEW UPDATED BINARY PRO 3_V2 HERE -
VDUB_BINARY_PRO_3_V1 UPGRADE from binary PRO 1 / testing/ / experimental / Trade the curves / Highs -Lows / Band cross over/ Testing using heikin ashi
//Linear Regression Curve
//Centre band
//CM_Gann Swing HighLow V2/Modified////// MA input NOT WORKING ! - I broke it :s
//Vdub_Tetris_V2/ Modified
*Update Tip /Optional
Set the centre band to '34 to run centre line

vdubongCustom script I fabricated which I use for Binary Trading on the 1m & 3m charts together with Price action & Time management but the principles are the same for all mediums. Use Price action buy/sell in the clear zones. Use the outer 'pink' horizontal lines (highs / lows / pivots points) to place SL's.
I personally run an additional BB 50/2 for clearer BB higher highs & lower low perspective, but it's not part of the script. Script variables are fully customisable.
I don't take ownership of any part of the script, I not a programmer /script writer just a dabbler. Enjoy :) - VDUBONG UPDATED
