Wavelet-Trend ML Integration [Alpha Extract]Alpha-Extract Volatility Quality Indicator
The Alpha-Extract Volatility Quality (AVQ) Indicator provides traders with deep insights into market volatility by measuring the directional strength of price movements. This sophisticated momentum-based tool helps identify overbought and oversold conditions, offering actionable buy and sell signals based on volatility trends and standard deviation bands.
🔶 CALCULATION
The indicator processes volatility quality data through a series of analytical steps:
Bar Range Calculation: Measures true range (TR) to capture price volatility.
Directional Weighting: Applies directional bias (positive for bullish candles, negative for bearish) to the true range.
VQI Computation: Uses an exponential moving average (EMA) of weighted volatility to derive the Volatility Quality Index (VQI).
Smoothing: Applies an additional EMA to smooth the VQI for clearer signals.
Normalization: Optionally normalizes VQI to a -100/+100 scale based on historical highs and lows.
Standard Deviation Bands: Calculates three upper and lower bands using standard deviation multipliers for volatility thresholds.
Signal Generation: Produces overbought/oversold signals when VQI reaches extreme levels (±200 in normalized mode).
Formula:
Bar Range = True Range (TR)
Weighted Volatility = Bar Range × (Close > Open ? 1 : Close < Open ? -1 : 0)
VQI Raw = EMA(Weighted Volatility, VQI Length)
VQI Smoothed = EMA(VQI Raw, Smoothing Length)
VQI Normalized = ((VQI Smoothed - Lowest VQI) / (Highest VQI - Lowest VQI) - 0.5) × 200
Upper Band N = VQI Smoothed + (StdDev(VQI Smoothed, VQI Length) × Multiplier N)
Lower Band N = VQI Smoothed - (StdDev(VQI Smoothed, VQI Length) × Multiplier N)
🔶 DETAILS
Visual Features:
VQI Plot: Displays VQI as a line or histogram (lime for positive, red for negative).
Standard Deviation Bands: Plots three upper and lower bands (teal for upper, grayscale for lower) to indicate volatility thresholds.
Reference Levels: Horizontal lines at 0 (neutral), +100, and -100 (in normalized mode) for context.
Zone Highlighting: Overbought (⋎ above bars) and oversold (⋏ below bars) signals for extreme VQI levels (±200 in normalized mode).
Candle Coloring: Optional candle overlay colored by VQI direction (lime for positive, red for negative).
Interpretation:
VQI ≥ 200 (Normalized): Overbought condition, strong sell signal.
VQI 100–200: High volatility, potential selling opportunity.
VQI 0–100: Neutral bullish momentum.
VQI 0 to -100: Neutral bearish momentum.
VQI -100 to -200: High volatility, strong bearish momentum.
VQI ≤ -200 (Normalized): Oversold condition, strong buy signal.
🔶 EXAMPLES
Overbought Signal Detection: When VQI exceeds 200 (normalized), the indicator flags potential market tops with a red ⋎ symbol.
Example: During strong uptrends, VQI reaching 200 has historically preceded corrections, allowing traders to secure profits.
Oversold Signal Detection: When VQI falls below -200 (normalized), a lime ⋏ symbol highlights potential buying opportunities.
Example: In bearish markets, VQI dropping below -200 has marked reversal points for profitable long entries.
Volatility Trend Tracking: The VQI plot and bands help traders visualize shifts in market momentum.
Example: A rising VQI crossing above zero with widening bands indicates strengthening bullish momentum, guiding traders to hold or enter long positions.
Dynamic Support/Resistance: Standard deviation bands act as dynamic volatility thresholds during price movements.
Example: Price reversals often occur near the third standard deviation bands, providing reliable entry/exit points during volatile periods.
🔶 SETTINGS
Customization Options:
VQI Length: Adjust the EMA period for VQI calculation (default: 14, range: 1–50).
Smoothing Length: Set the EMA period for smoothing (default: 5, range: 1–50).
Standard Deviation Multipliers: Customize multipliers for bands (defaults: 1.0, 2.0, 3.0).
Normalization: Toggle normalization to -100/+100 scale and adjust lookback period (default: 200, min: 50).
Display Style: Switch between line or histogram plot for VQI.
Candle Overlay: Enable/disable VQI-colored candles (lime for positive, red for negative).
The Alpha-Extract Volatility Quality Indicator empowers traders with a robust tool to navigate market volatility. By combining directional price range analysis with smoothed volatility metrics, it identifies overbought and oversold conditions, offering clear buy and sell signals. The customizable standard deviation bands and optional normalization provide precise context for market conditions, enabling traders to make informed decisions across various market cycles.
Volatilityanalysis

Neural Pulse System [Alpha Extract]Neural Pulse System (NPS)
The Neural Pulse System (NPS) is a custom technical indicator that analyzes price action through a probabilistic lens, offering a dynamic view of bullish and bearish tendencies.
Unlike traditional binary classification models, NPS employs Ordinary Least Squares (OLS) regression with dynamically computed coefficients to produce a smooth probability output ranging from -1 to 1.
Paired with ATR-based bands, this indicator provides an intuitive and volatility-aware approach to trend analysis.
🔶 CALCULATION
The Neural Pulse System utilizes OLS regression to compute probabilities of bullish or bearish price action while incorporating ATR-based bands for volatility context:
Dynamic Coefficients: Coefficients are recalculated in real-time and scaled up to ensure the regression adapts to evolving market conditions.
Ordinary Least Squares (OLS): Uses OLS regression instead of gradient descent for more precise and efficient coefficient estimation.
ATR Bands: Smoothed Average True Range (ATR) bands serve as dynamic boundaries, framing the regression within market volatility.
Probability Output: Instead of a binary result, the output is a continuous probability curve (-1 to 1), helping traders gauge the strength of bullish or bearish momentum.
Formula:
OLS Regression = Line of best fit minimizing squared errors
Probability Signal = Transformed regression output scaled to -1 (bearish) to 1 (bullish)
ATR Bands = Smoothed Average True Range (ATR) to frame price movements within market volatility
🔶 DETAILS
📊 Visual Features:
Probability Curve: Smooth probability signal ranging from -1 (bearish) to 1 (bullish)
ATR Bands: Price action is constrained within volatility bands, preventing extreme deviations
Color-Coded Signals:
Blue to Green: Increasing probability of bullish momentum
Orange to Red: Increasing probability of bearish momentum
Interpretation:
Bullish Bias: Probability output consistently above 0 suggests a bullish trend.
Bearish Bias: Probability output consistently below 0 indicates bearish pressure.
Reversals: Extreme values near -1 or 1, followed by a move toward 0, may signal potential trend reversals.
🔶 EXAMPLES
📌 Trend Identification: Use the probability output to gauge trend direction.
📌Example: On a 1-hour chart, NPS moves from -0.5 to 0.8 as price breaks resistance, signaling a bullish trend.
Reversal Signals: Watch for probability extremes near -1 or 1 followed by a reversal toward 0.
Example: NPS hits 0.9, price touches the upper ATR band, then both retreat—indicating a potential pullback.
📌 Example snapshots:
Volatility Context: ATR bands help assess whether price action aligns with typical market conditions.
Example: During low volatility, the probability signal hovers near 0, and ATR bands tighten, suggesting a potential breakout.
🔶 SETTINGS
Customization Options:
ATR Period – Defines lookback length for ATR calculation (shorter = more responsive, longer = smoother).
ATR Multiplier – Adjusts band width for better volatility capture.
Regression Length – Controls how many bars feed into the coefficient calculation (longer = smoother, shorter = more reactive).
Scaling Factor – Adjusts the strength of regression coefficients.
Output Smoothing – Option to apply a moving average for a cleaner probability curve

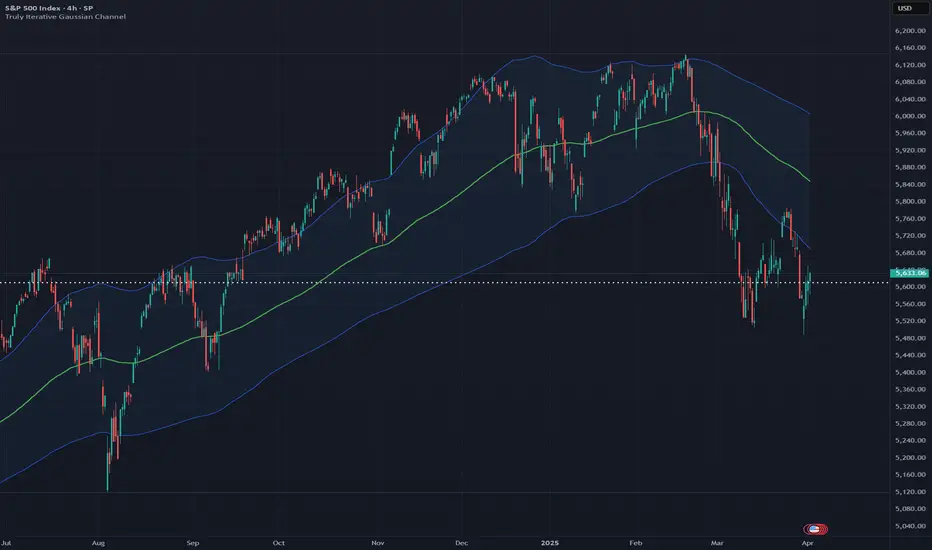
Truly Iterative Gaussian ChannelOVERVIEW
The Truly Iterative Gaussian Channel is a robust channeling system that integrates a Gaussian smoothing kernel with a rolling standard deviation to create dynamically adaptive upper and lower boundaries around price. This indicator provides a smooth, yet responsive representation of price movements while minimizing lag and dynamically adjusting channel width to reflect real-time market volatility. Its versatility makes it effective across various timeframes and trading styles, offering significant potential for experimentation and integration into advanced trading systems.
TRADING USES
The Gaussian indicator can be used for multiple trading strategies. Trend following relies on the middle Gaussian line to gauge trend direction: prices above this line indicate bullish momentum, while prices below signal bearish momentum. The upper and lower boundaries act as dynamic support and resistance levels, offering breakout or pullback entry opportunities. Mean reversion focuses on identifying reversal setups when price approaches or breaches the outer boundaries, aiming for a return to the Gaussian centerline. Volatility filtering helps assess market conditions, with narrow channels indicating low volatility or consolidation and suggesting fewer trading opportunities or an impending breakout. Adaptive risk management uses channel width to adjust for market volatility, with wider channels signaling higher risk and tighter channels indicating lower volatility and potentially safer entry points.
THEORY
Gaussian kernel smoothing, derived from the Gaussian normal distribution, is a cornerstone of probability and statistics, valued for its ability to reduce noise while preserving critical signal features. In this indicator, it ensures price movements are smoothed with precision, minimizing distortion while maintaining responsiveness to market dynamics.
The rolling standard deviation complements this by dynamically measuring price dispersion from the mean, enabling the channel to adapt in real time to changing market conditions. This combination leverages the mathematical correctness of both tools to balance smoothness and adaptability.
An iterative framework processes data efficiently, bar by bar, without recalculating historical value to ensure reliability and preventing repainting to create a mathematically grounded channel system suitable for a wide range of market environments.
The Gaussian channel excels at filtering noise while remaining responsive to price action, providing traders with a dependable tool for identifying trends, reversals, and volatility shifts with consistency and precision.
CALIBRATION
Calibration of the Gaussian channel involves adjusting its length to modify sensitivity and adaptability based on trading style. Shorter lengths (e.g., 50-100) are ideal for intraday traders seeking quick responses to price fluctuations. Medium lengths (e.g., 150-200) cater to swing traders aiming to capture broader market trends. Longer lengths (e.g., 250-400+) are better suited for positional traders focusing on long-term price movements and stability.
MARKET USAGE
Stock, Forex, Crypto, Commodities, and Indices.
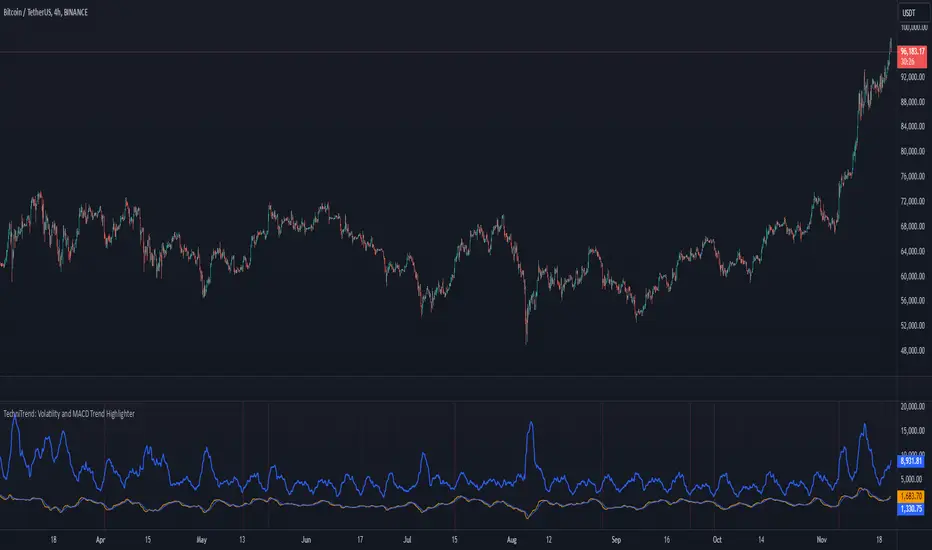
TechniTrend: Volatility and MACD Trend Highlighter🟦 Overview
The "Candle Volatility with Trend Prediction" indicator is a powerful tool designed to identify market volatility based on candle movement relative to average volume while also incorporating trend predictions using the MACD. This indicator is ideal for traders who want to detect volatile market conditions and anticipate potential price movements, leveraging both price changes and volume dynamics.
It not only highlights candles with significant price movements but also integrates a trend analysis based on the MACD (Moving Average Convergence Divergence), allowing traders to gauge whether the market momentum aligns with or diverges from the detected volatility.
🟦 Key Features
🔸Volatility Detection: Identifies candles that exceed normal price fluctuations based on average volume and recent price volatility.
🔸Trend Prediction: Uses the MACD indicator to overlay trend analysis, signaling potential market direction shifts.
🔸Volume-Based Analysis: Integrates customizable moving averages (SMA, EMA, WMA, etc.) of volume, providing a clear visualization of volume trends.
🔸Alert System: Automatically notifies traders of high-volatility situations, aiding in timely decision-making.
🔸Customizability: Includes multiple settings to tailor the indicator to different market conditions and timeframes.
🟦 How It Works
The indicator operates by evaluating the price volatility in relation to average volume and identifying when a candle's volatility surpasses a threshold defined by the user. The key calculations include:
🔸Average Volume Calculation: The user selects the type of moving average (SMA, EMA, etc.) to calculate the average volume over a set period.
🔸Volatility Measurement: The indicator measures the body change (difference between open and close) and the high-low range of each candle. It then calculates recent price volatility using a standard deviation over a user-defined length.
🔸Weighted Index: A unique index is created by dividing price change by average volume and recent volatility.
🔸Highlighting Volatility: If the weighted index exceeds a customizable threshold, the candle is highlighted, indicating potential trading opportunities.
🔸Trend Analysis with MACD: The MACD line and signal line are plotted and adjusted with a user-defined multiplier to visualize trends alongside the volatility signals.
🟦 Recommended Settings
🔸Volume MA Length: A default of 14 periods for the average volume calculation is recommended. Adjust to higher periods for long-term trends and shorter periods for quick trades.
🔸Volatility Threshold Multiplier: Set at 1.2 by default to capture moderately significant movements. Increase for fewer but stronger signals or decrease for more frequent signals.
🔸MACD Settings: Default MACD parameters (12, 26, 9) are suggested. Tweak based on your trading strategy and asset volatility.
🔸MACD Multiplier: Adjust based on how the MACD should visually compare to the average volume. A multiplier of 1 works well for most cases.
🟦 How to Use
🔸Volatile Market Detection:
Look for highlighted candles that suggest a deviation from typical price behavior. These candles often signify an entry point for short-term trades.
🔸Trend Confirmation:
Use the MACD trend analysis to verify if the highlighted volatile candles align with a bullish or bearish trend.
For example, a bullish MACD crossover combined with a highlighted candle suggests a potential uptrend, while a bearish crossover with volatility signals may indicate a downtrend.
🔸Volume-Driven Strategy:
Observe how volume changes impact candle volatility. When volume rises significantly and candles are highlighted, it can suggest strong market moves influenced by big players.
🟦 Best Use Cases
🔸Trend Reversals: Detect potential trend reversals early by spotting divergences between price and MACD within volatile conditions.
🔸Breakout Strategies: Use the indicator to confirm price breakouts with significant volume changes.
🔸Scalping or Day Trading: Customize the indicator for shorter timeframes to capture rapid market movements based on volatility spikes.
🔸Swing Trading: Combine volatility and trend insights to optimize entry and exit points over longer periods.
🟦 Customization Options
🔸Volume-Based Inputs: Choose from SMA, EMA, WMA, and more to define how average volume is calculated.
🔸Threshold Adjustments: Modify the volatility threshold multiplier to increase or decrease sensitivity based on your trading style.
🔸MACD Tuning: Adjust MACD settings and the multiplier for trend visualization tailored to different asset classes and market conditions.
🟦 Indicator Alerts
🔸High Volatility Alerts: Automatically triggered when candles exceed user-defined volatility levels.
🔸Bullish/Bearish Trend Alerts: Alerts are activated when highlighted volatile candles align with bullish or bearish MACD crossovers, making it easier to spot opportunities without constantly monitoring the chart.
🟦 Examples of Use
To better understand how this indicator works, consider the following scenarios:
🔸Example 1: In a strong uptrend, observe how volume surges and volatility highlight candles right before price consolidations, indicating optimal exit points.
🔸Example 2: During a downtrend, see how the MACD aligns with volume-driven volatility, signaling potential short-selling opportunities.