Scott’s volatility histogramATR shows volatility. SMA of ATR measures the average volatility over a chosen look-back period (default 200).
Divergence of ATR and sma is represented as a histogram.
Low periods of volatility are below the zero line. High periods of volatility are above the zero line.
Average volatility over a 200 period look-back is the zero value.
Volatily

ATR Short [zauoyds]This script was made to calculate in real time the stop and take profit based on ATR to SHORT positions. By default, the number is 1,5 ATR to stop-loss and 3 ATR to take profit. You can change according to your trading system.

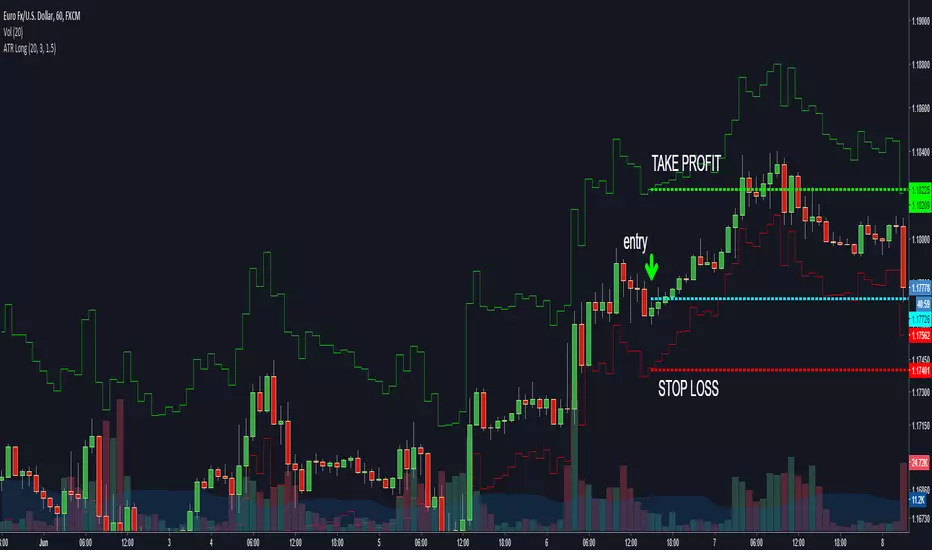
ATR Long [zauoyds]This script was made to calculate in real time the stop and take profit based on ATR to LONG positions. By default, the number is 1,5 ATR to stop-loss and 3 ATR to take profit. You can change according to your trading system.