Discovery IndexThe Discovery Index is an original technical indicator which attempts to display directional market pressure and momentum based on accumulated candle-over-candle measurements.
Discovery , in this context, is the act of finding (discovering) New Highs and Lows.
> What is 'Discovery'
Not to be confused with "Price Discovery", the term for setting the spot price of an asset.
The term 'Discovery' in Discovery Index is used based on the literal definition of 'Discovery', such as, the action of finding what was previously unknown.
Given this definition,
Discovery is the difference between highs or lows only when the current high is higher than the previous high or the current low is lower than the previous low.
Below is a visual example of exactly where Discovery is seen from each candle.
Since discovery is only based on points of the candle, and not specifically the direction of the candle; it is possible for discovery to occur in both directions from the same candle.
It is also possible for no discovery to occur from a candle.
> Calculation
The Discovery Index is the Net Total of discovery data over a specified length of bars.
Discovery Index = Sum of Upwards Discovery + Sum of Downwards Discovery
Note: Upwards Discovery is always Positive, and Downwards Discovery is always Negative. By adding both together, their Net Total is produced. This value is the "Discovery Index".
Wick Calculation Example
> Volume Discovery
Using Volume for the Discovery Index Calculation allows for a different dimension to be added to the data for new analysis opportunities.
While volume data is only a single value, by accumulating this data over time, we are able to fabricate a candle body from the data by accounting for the direction of the chart candles.
This allows for the Calculation of the Discovery Index based on volume data.
Volume Example
> Display
The display uses a "Candlestick histogram" display. The bodies and wicks from the display represent the discovery data from the respective points in each candle. (Wick Discovery & Candle Body Discovery).
This style of histogram allows for the display of both data sources, preserving the accuracy and distinction between each type, while also providing a clean display.
> Considerations
Discovery index is not an Oscillator, since there are no upper or lower boundaries to its rotations.
There are not (at this time) any "Over-bought" or "Over-sold" Areas, this is partially due to the previous consideration since any levels for these could potentially change from chart to chart. Additionally, it would generally be better to read the data based on the context of the current market.
Non-directional movements effect the Discovery Index as well. Since Discovery does not occur from every bar, the Index reflects hesitations as well as movements in market direction.
With the option to input a symbol, the Discovery Index Indicator is not constrained to one chart ticker for its calculation and could help to see shifts between different symbols, making it easier to compare different assets.
With the separation of wicks and candle body data, a stronger move may be observed by its full-bodied movements, while a potentially more speculative move may be seen from large wick movements. Since wicks are often interpreted as either, Rejection for reversal OR as Testing for continuation, the interpretation for Wick Discovery generally varies based on context.
Discovery Index ⇾ Divergences! Due to its calculation, price (and/or volume) data is displayed in such a way that makes it useful as a tool for identifying divergence opportunities.
Remember, this indicator is lookback based. An immediate significant change from the data source (if not offset by a similar opposite change) will be represented for multiple bars after its occurrence. Due to this, data is likely to be skewed or biased from these occurrences for a period of time after.
Throughout development, "Discovery" has been shortened to just "Disco", therefore, this indicator is also an attempt to bring Disco Back.
Enjoy!
Volumeanalysis

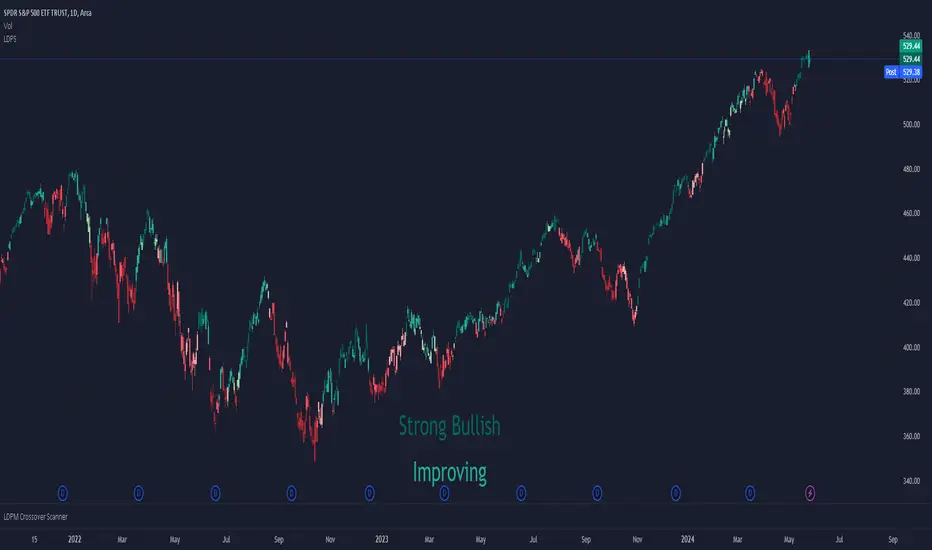
Liquidity Dependent Price Stability AlgorithmThe Liquidity Dependent Price Stability (LDPS) indicator is designed to measure liquidity levels on an equity and, from those measurements, provide Bullish or Bearish outlooks for future price action. These outlooks are given via reporting the equity's Liquidity Condition and Liquidity Flow.
Interpretation
Liquidity Condition (LC) and Liquidity Flow (LF) measurements are displayed with color-specific chart colors and/or with text output.
LC can be reported as "Weak Bullish", "Bullish", or "Strong Bullish" for Bullish outlooks and "Weak Bearish", "Bearish" or "Strong Bearish" for Bearish outlooks. LC can also just be reported as "Bullish" or "Bearish".
Bullish LCs have a statistical correlation with future price appreciation, and Bearish LCs have a statistical correlation with price depreciation. When LC is “Bullish”, the price is likely to go up, and if LC is “Bearish”, the price is likely to go down.
Liquidity Flow (LF) is a measure of how LC is changing. When LC is becoming more bullish, LF is reported as “Improving”. When LC is becoming more bearish, LF is reported as “Worsening”. LF is only displayed via text output.
Settings and Configurations
LDPS Sensitivity and Reactivity: Determines if you want LDPS to be more sensitive to changing conditions or less sensitive. This choice affects how certain LDPS is when forming its future outlooks. LDPS achieves this increase in sensitivity and reactivity by lowering the bar for what LDPS considers a significant change.
Aggressive : LDPS will optimize reporting early changes in LC and LF at the expensive of accuracy. Aggressive is good for low-risk trading styles that prefer to exit a position early rather than deal with increased risk of oppositional movement.
Balanced : LDPS will try to balance reporting changes in LC and LF with maintaining accuracy. Balanced style is a good setting to start out with and is applicable across the widest range of equity’s and timeframes.
Conservative : LDPS will optimize accuracy over being sensitive to changes in LC or LF. Conservative is a good choice for lower timeframes and traders who only want to change or exit positions with the greatest confidence.
LDPS Reporting Style: Determines how you want LC to be reported.
Simplified : LDPS will only report LC as “Bullish” or “Bearish”.
Full : LDPS will increase its reporting details and include the “Strong” and “Weak” pre-fixes, when appropriate.
LDPS Candle Coloring: There are three different ways that LC can be reported on the chart via coloring.
LDPS Candle Replacement: This will replace the chart’s default candles with those created by LDPS. Note: In order to see LDPS’ candles and not the chart’s, you have to disable to chart’s candles. This can be done in Settings -> Symbol and unchecking “Body”, “Borders” and “Wick” boxes.
LDPS Candle Coloring: This will just color the bodies of the chart’s default candles. Note: This setting should not have the chart’s candle’s disabled.
LDPS Background Coloring: This will color the chart’s background rather than any candles.
LDPS Text Output: LC and LF are reported via a text box that can be moved several places on the chart, or the text box can be removed.
LDPS Measurements – Display: When selected, LC and LF will be reported via the text box.
LDPS Measurement – Text Location: Determines where the text box with LC and LF are located.
LDPS Measurement – Text Size: Determines the size of LC and LF within the text box.
LDPS Measurement – Background Color: Determines the background color of the text box with LC and LF.
LDPS Condition Color Selection – Bullish / Bearish: Color selection for each type of LC. Note: If the Simplified reporting style is selected, the “Full Bullish” and “Full Bearish” are the bullish and bearish color choices, respectively.
Frequently Asked Questions:
Where can I get additional Information?
Please check the “Author’s Instructions” section below.
Where can I find the results of the LDPS research?
Please check the “Author’s Instructions” section below.
Help! Something’s not working!
Apologies. Please see the email listed in “Author’s Instructions” below and let’s get started on solving the issue.
Which Sensitivity setting should I use?
The author’s preference is Conservative in most cases, but the answer for you depends on your preferred style.
An analogy might help: the aggressive setting will ensure LDPS is early to the party – every party. Of the parties that really kick off, you can be certain LDPS is there, but they had to visit a several of parties before finding the right one.
The Conservative setting won’t bring LDPS to every party – it will gladly stay at the one it’s at but when it detects the next real big hit, LDPS will move to that party instead. It won’t be the first one there, but it is definitely earlier than most.
Should I use the Full or Simplified reporting style?
Depending on how engaged you are with the particular equity or position, either choice can be beneficial. The Full reporting style will let you detect changes in LC before they might show with the Simplified reporting style. Some enjoy the additional data, some (like the Author) enjoy keeping things simple.
I can see LDPS’ colors in the chart’s candlesticks when the settings are open, but not when the settings are closed. How come?
If you are using the “LDPS Candle Replacement” setting, be sure to turn off the Chart’s default candles by right-clicking on the chart, going to Settings, then Symbol and then un-checking “Body”, “Border” and “Wick”. This should fix the issue.
I think there’s a bug – where do I report it?
Thank you for reaching out about a potential bug or issue! Please see the email below in “Author’s Instructions” to report the issue.
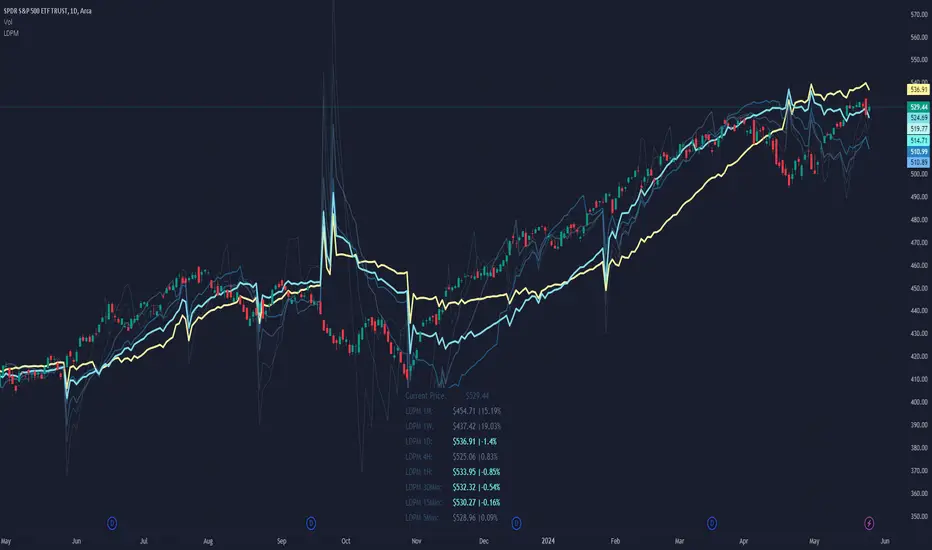
Liquidity Dependent Price Movement AlgorithmLiquidity-Dependent Price Movement (LDPM) is a metric designed to directly measure liquidity on a equity in real time, and to translate those measurements into signals to provide insights into where the anticipate price-direction is headed.
Liquidity can be characterized as a way of measuring how smoothly things are running in the market. When things are running smoothly – such as when there is good agreement as to the price of an asset, then things are considered liquid. Conversely, when things are not running smoothly, just as when the bid or the ask do not agree with each other, then things are considered not liquid. These different states have different outcome liklihoods.
In a liquid environment, a stock can trade a lot of shares without moving the price. On the other hand, when a stock is not liquid, even small volumes can move the price substantially.
It is therefore helpful to know when a stock is liquid to the upside or to the downside, or even, when a stock is not liquid to the upside or the downside. These data have statistical associations with future price movement and volatility.
The use of LDPM is straightforward:
If the price is above LDPM: bullish outlooks.
If the price is below LDPM: bearish outlooks.
There are a few key differences about LDPM as compared to other indicators, namely that timeframe matters . That means, LDPM will tailor its output to the timeframe selected. The advantage of this is that it allows LDPM to be "tailored" to the specific timeframe as desired, without having to do any conversions or adaptations mentally.
Key Settings and Configurations:
Setting - Smoothing Type of LDPM :
Default: KF.
LDPM can be smoothened if desired. There are 5 different types of smoothing available:
EMA : Exponential Smoothing
SMA : Simple Smoothing
WMA : Weighted Smoothing
RMA : Modified Smoothing
KF : Kellman Smoothing
The default is "KF" for Kellman Smoothing.
Setting - Include LDPM-Granular :
Default: Off.
LDPM-Granular is the more "raw" form of LDPM that displays the candle-specific result, rather than the smoothened result. This can be toggled on or off, if desired. LDPM granular is helpful for looking at candle-specific
Setting - Place LDPM Standard :
Default: Off.
An additional, single, LDPM line can be placed via this toggle. Settings for this LDPM can be configured directly below toggle.
Setting - Place LDPM-Fib :
Default: On.
LDPM-Fib is a default setting for displaying 5 LDPMs (LDPM-13, LDPM-21, LDPM-34, LDPM-55, and LDPM-89) whose lookbacks are spaced via the Fib sequence. Useful for those who enjoy a static relationship between the different "layers" of LDPM.
Setting - Place LDPM-Reference :
Default: Off.
Since LDPM is time-interval dependent, there may be times when a higher-order timeframe is desired to act as a reference. For instance, suppose you want to go long if the 1-Hour LDPM experiences a bullish crossover, but you want to scalp shorts on the 15-minute timeframe until then. Then you could place the chart on the 15-minute interval for your scalping, and then place a 1-Hour reference LDPM that will show you when the 1-Hour LDPM and price experience a crossover.
Note: The reference must be a higher-order timeframe. So if your chart is on the 15-minute, you can only reference timeframes greater than 15.
Setting - LDPM Box Creation :
Default: On.
Instead of implementing a reference LDPM, it is possible to display the other timeframes in a data table with conditional coloring for if the overall LDPM-Price relationship is bullish or bearish.
Why Chose LDPM
There are no other Liquidity-measuring indicators available to the retail investor. Measuring liquidity often requires the use of expensive data and high-throughput computing to be used in real-time. Neither of these requirements apply to utilizing LDPM.
Additionally, the data are supportive that LDPM provides statistically significant, price-direction-correct outlooks.
Volume Breaker Blocks [UAlgo]The "Volume Breaker Blocks " indicator is designed to identify breaker blocks in the market based on volume and price action. It is a concept that emerges when an order block fails, leading to a change in market structure. It signifies a pivotal point where the market shifts direction, offering traders opportunities to enter trades based on anticipated trend continuation.
🔶 Key Features
Identifying Breaker Blocks: The indicator identifies breaker blocks by detecting pivot points in price action and corresponding volume spikes.
Breaker Block Sensitivity: Traders can adjust breaker block detection sensitivity, length to be used to find pivot points.
Mitigation Method (Close or Wick): Traders can choose between "Close" and "Wick" as the mitigation method. This choice determines whether the indicator considers closing prices or wicks in identifying breaker blocks. Selecting "Close" implies that breaker blocks will be considered broken when the closing price violates the block, while selecting "Wick" implies that the wick of the candle must violate the block for it to be considered broken.
Show Last X Breaker Blocks: Users can specify how many of the most recent breaker blocks to display on the chart.
Visualization: Volume breaker blocks are visually represented on the chart with customizable colors and text labels, allowing for easy interpretation of market conditions. Each breaker block is accompanied by informational text, including whether it's bullish or bearish and the corresponding volume, aiding traders in understanding the significance of each block.
🔶 Disclaimer
Educational Purpose: The "Volume Breaker Blocks " indicator is provided for educational and informational purposes only. It does not constitute financial advice or a recommendation to engage in trading activities.
Risk of Loss: Trading in financial markets involves inherent risks, including the risk of loss of capital. Users should carefully consider their financial situation, risk tolerance, and investment objectives before engaging in trading activities.
Accuracy Not Guaranteed: While the indicator aims to identify potential reversal points in the market, its accuracy and effectiveness may vary. Users should conduct thorough testing and analysis before relying solely on the indicator for trading decisions.
Past Performance: Past performance is not indicative of future results. Historical data and backtesting results may not accurately reflect actual market conditions or future performance.

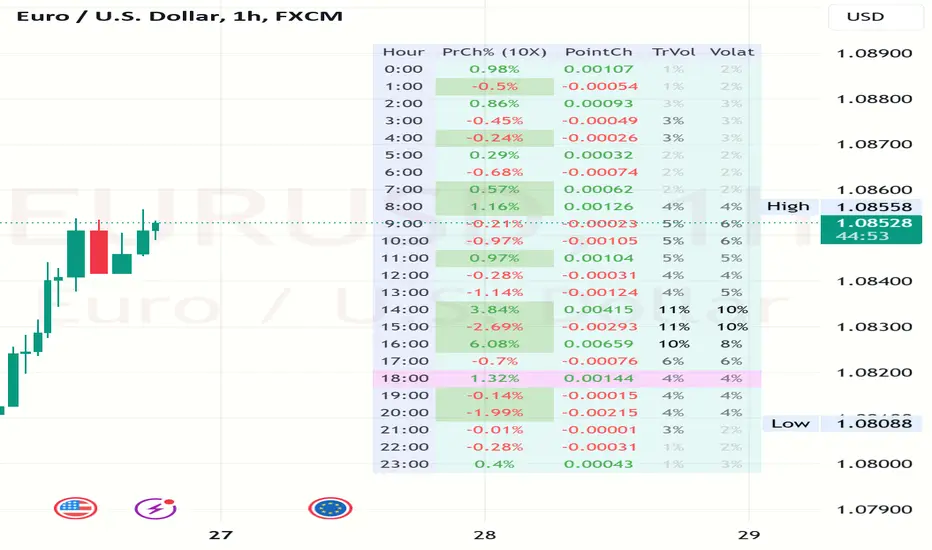
Volatility and Volume by Hour EXT(Extended republication, use this instead of the old one)
The goal of this indicator is to show a “characteristic” of the instrument, regarding the price change and trading volume. You can see how the instrument “behaved” throughout the day in the lookback period. I've found this useful for timing in day trading.
The indicator creates a table on the chart to display various statistics for each hour of the day.
Important: ONLY SHOWS THE TABLE IF THE CHART’S TIMEFRAME IS 1H!
Explanation of the columns:
1. Volatility Percentage (Volat): This column shows the volatility of the price as a percentage. For example, a value of "15%" means the price movement was 15% of the total daily price movement within the hour.
2. Hourly Point Change (PointCh): This column shows the change in price points for each hour in the lookback period. For example, a value of "5" means the price has increased by 5 points in the hour, while "-3" means it has decreased by 3 points.
3. Hourly Point Change Percentage (PrCh% (LeverageX)): This column shows the percentage change in price points for each hour, adjusted with leverage multiplier. Displayed green (+) or red (-) accordingly. For example, a value of "10%" with a leverage of 2X means the price has effectively changed by 5% due to the leverage.
4. Trading Volume Percentage (TrVol): This column shows the percentage of the daily total volume that was traded in a specific hour. For example, a value of "10%" would mean that 10% of the day's total trading volume occurred in that hour.
5. Added New! - Relevancy Check: The indicator checks the last 24 candle. If the direction of the price movement was the same in the last 24 hour as the statistical direction in that hour, the background of the relevant hour in the second column goes green.
For example: if today at 9 o'clock the price went lower, so as at 9 o'clock in the loopback period, the instrument "behaves" according to statistics . So the statistics is probably more relevant for today. The more green background row the more relevancy.
Settings:
1. Lookback period: The lookback period is the number of previous bars from which data is taken to perform calculations. In this script, it's used in a loop that iterates over a certain number of past bars to calculate the statistics. TIP: Select a period the contains a trend in one direction, because an upward and a downward trend compensate the price movement in opposite directions.
2. Timezone: This is a string input that represents the user's timezone. The default value is "UTC+2". Adjust it to your timezone in order to view the hours properly.
3. Leverage: The default value is 10(!). This input is used to adjust the hourly point change percentage. For FOREX traders (for example) the statistics can show the leveraged percentage of price change. Set that according the leverage you trade the instrument with.
Use at your own risk, provided “as is” basis!
Hope you find it useful! Cheers!
RunRox - Advanced SMC⭐️ Introducing Our Advanced SMC Indicator: Elevate Your Smart Money Concept Trading
We are excited to present our innovative indicator, specifically designed for the Smart Money Concept (SMC). Our approach goes beyond the traditional SMC strategy by offering significant enhancements that can help you achieve stronger trading performance.
We employ a more sophisticated SMC structure, incorporating improved IDM (Inducement) logic, both internal and external structures, and four types of order blocks. This allows for deeper insights into market trends and a clearer understanding of how major market participants may be manipulating price action.
🟠 Indicator Features:
Structure
HTF Structure – Choose any timeframe and display its structure on your current chart.
CHoCH | BOS | IDM – Display any components from this structure.
Market Minor Structure – Swing and Minor structure.
BOS/CHoCH Breaking by (Body | Wick) – Choose the principle for building the structure, either by the candle body or by their wicks.
BOS/CHoCH Move if Swept – When liquidity is taken, decide whether to move the structure line higher or consider it a structural break.
Move CHoCH/BOS – Relocate key points on the chart if the structure becomes too large.
FVG Concept
HTF FVG – Choose any timeframe from which you want to display FVG on your current chart
Three Types of FVG – Classic FVG, Double FVG, Implied Imbalance
Reaction to FVG – Show the market’s reaction to FVG on the chart
Mitigation Method – Select the fill method that suits your approach (Touch/Midline/Complete)
Remove Filled FVG – Remove FVGs from the chart once they have been filled
Combine FVG – Merge several consecutive FVGs into one
Length FVG – Adjust the number of candles that define the FVG
OrderBlock Concept
HTF OrderBlock – Choose any timeframe from which you want to display orderblocks on your current chart
Swing and Minor Orderblocks – Display only the orderblocks you need, whether from the Swing or Minor structure
Four Types of Order Blocks – Advanced OB, Classic OB, BTS/STB zones, Extremum Candle
Block Based on – Decide whether to base the orderblock on candle highs/lows or candle open/close
Mitigation Method – Define when an orderblock is considered filled (Touch/Midline/Complete)
Remove Blocks Older – Remove older orderblocks from the chart
Hide Overlap – Disable overlapping orderblocks when they appear in the same area
Eat Young Blocks – Reduce the size of an orderblock until it fully forms
Hide Distant Blocks – Remove orderblocks that are too far from the current price
Previous Highs & Lows
Four Level Types – Day, Week, Month, Quarter
Style Customization – Choose line color, line style, and transparency
Fibonacci Retracements
10 Template Options – Ten different bases on which you can build your Fibonacci grid
Up to 7 Levels – Add up to seven Fibonacci levels for your convenience
Fibo Inversion – Option to invert the Fibonacci grid
Style Customization – Choose line colors, line styles, and transparency
Additional Functions
Premium & Discount Zones – A popular concept we’ve incorporated to help identify potential trading areas within premium or discount prices
Equal Highs & Lows – High-liquidity levels where market makers may seek liquidity
Color Candles – Automatically colors candles based on the current trend
Market Structure ZigZag – Offers a clear visual of the zigzag pattern on which the structure is built
Key Point Labels – Displays important swing high/low points directly on the chart
General Styling – Customize any chart element, including size, style, color, and transparency
Alert Customization – Over 16 types of alerts, easily configured in a few clicks. Receive only the notifications you need. Custom alerts are also available for developers.
Next, we will provide a detailed overview of all the indicator’s features, accompanied by chart examples.
📈 Structure
What Is IDM?
IDM, or the Institutional Distribution Model, is an advanced concept within SMC that focuses on how institutional players distribute their positions in the market. By analyzing IDM, traders can better anticipate price movements and potential turning points, thereby gaining a meaningful edge in their trading.
In our structure concept, IDM can form under specific conditions. The market does not always provide a high-liquidity point to work with, so we’ve adopted a flexible approach. We generate IDM when a certain type of liquidity appears during the impulse and BOS break, allowing for a potential future liquidity sweep.
Below, I will provide an example that illustrates when IDM forms as a liquidity magnet within the structure - and when it does not.
As shown in the example above, we focus on the initial impulse after the BOS. If liquidity forms during this impulse - liquidity that needs to be taken out during the structural move - we mark an IDM level as a price magnet. However, if this liquidity does not appear, we do not create an IDM. In that case, the same point might serve as an FVG or play a different role, depending on your trading approach.
This concept makes the structure more flexible and better able to respond immediately to market movements and key structural points.
Above is an example on the chart illustrating what the structure looks like both with and without IDM. As you can see, when the structural move includes pullbacks and consolidation, there is an opportunity to form an IDM as a price magnet. However, if the impulses are strong and lack pullbacks, FVG becomes the only magnet in that move. Depending on the chart, our indicator adapts to the current market conditions and highlights potential liquidity collection points.
📊 Swing and Minor Structure
In the new version of the indicator, the minor structure and the swing structure differ from each other.
Swing structure - In this structure, as mentioned earlier, the IDM concept remains a price magnet and is formed at certain points on the chart if the conditions allow. If these points do not appear, IDM might not form at all.
Minor structure - Here, we have completely removed IDM and only kept BOS and CHoCH for structure formation. We found that for a minor structure, this approach allows faster reactions to trend changes, depending on market movements.
By making these adjustments, we have resolved the main issue of the advanced structure, which was the large distance between BOS and CHoCH that sometimes resulted in a month-long consolidation between these levels. In this version, those problems no longer occur.
If, for some reason, your settings result in a larger swing structure, you can still work with the minor structure using the same POI as in the swing structure. OrderBlock and FVG remain the primary drivers of order flow.
Shown above is a screenshot of the main structure settings you can adjust. These settings are highly flexible and can be tailored to fit a wide range of trading preferences.
⚖️ FVG Concept
A new feature of our indicator is the FVG concept. We automatically detect three types of FVG at the moment, which will be explained below.
FVG - the standard Fair Value Gap
Double FVG - a double FVG, also referred to as BPR (Balanced Price Range)
Implied Imbalance - a type of imbalance that arises from buyer or seller demand
Below, we will look at examples of the FVG types we currently identify.
All price inefficiencies work in real time, immediately appearing on the chart and allowing traders to quickly respond to FVG reactions.
We have also enhanced this concept by displaying FVG reactions on the chart. If an FVG triggers a reaction and the price responds to that range, we highlight it on the chart, so you can recognize the reaction and make timely trading decisions. A screenshot below shows how this looks in practice.
Below is a screenshot illustrating the main settings of this concept, along with detailed descriptions.
📦 OrderBlock Concept
OrderBlocks provide an effective way to identify areas of interest and make informed decisions. We have dedicated significant effort to refining this section’s functionality and have achieved strong results in doing so.
Order Block Types
Advanced OrderBlock – A specialized type of order block generated by our internal algorithm. This can help traders aim for tighter entries and potentially more favorable risk-reward ratios within a narrow price range.
OrderBlock – The classic type, formed at the highs or lows of a structure when a BOS or CHoCH occurs. It can still be an effective entry method but typically spans a wider price range.
Extremum Candle – Based on liquidity grabs. The candle creating this order block must collect liquidity before making an impulsive move that breaks the BOS or CHoCH.
BTS / STB (Buy To Sell / Sell To Buy) – This concept may appear when market makers manipulate price to buy or sell an asset. It often covers a larger price range because it relies on a brief impulsive move to form.
Each type of order block has its own strengths and weaknesses. We provide traders with the flexibility to choose which types suit their trading style and preferences.
Above is an example of how you can apply OrderFlow alongside our structure and orderblocks, which can produce solid results when combined with the Smart Money concept.
In this demonstration, we have highlighted the Advanced Orderblock as an illustration.
Above is a screenshot of all the settings related to this section. They can be customized to suit your specific needs, ensuring you only see what is genuinely relevant on your chart.
📏 Previous Highs and Lows
You can select four levels to display on the chart as some of the most liquid zones:
Daily Highs and Lows
Weekly Highs and Lows
Monthly Highs and Lows
Quarterly Highs and Lows
This feature helps you identify important levels on lower timeframes and focus on these zones for potential trading opportunities. Below is an example of how it appears on the chart.
Below, you can see the settings available in this section.
📐 Fibonacci Levels
Likewise, a new section in our indicator is Fibonacci Levels, a well-known tool recognized as a reliable source of important levels on the chart. We have added this functionality with the option to choose how you want to generate these levels and which specific levels you want to display.
You can plot Fibonacci levels based on the Swing structure, Minor structure, previous or current day, month, and more. In total, there are 10 different options for constructing the Fibonacci grid.
Above, you can see an example of how it appears on the chart, and below you will find the settings available in this section.
🈹 Premium and Discount
Another useful feature for all traders is the Premium and Discount zones based on structure. This makes it easy to identify areas of interest—whether in a discount or premium zone, or in an equilibrium area.
Below, you can also see the settings available in this section.
✅ Additional Function
We have also separated a few functions into their own section:
Color Candles – Colors the candles according to the current trend.
Market Structure ZigZag – Visually highlights the zigzag used to form the structure.
Key Point Labels – Displays the points on the chart from which the structure is built.
Equal Highs & Lows – Identifies equal highs and lows as areas of potential liquidity for larger market players, as price often aims to sweep these zones.
Below are a few screenshots showing how these features appear on the chart.
Color Candles
Market Structure ZigZag and Key Point Labels
Equal Highs & Lows
Below, you can see a screenshot displaying all the settings available in this section.
🎨 General Styling
We have devoted considerable effort to providing flexible customization for each element on the chart, so you can design the exact look you want. That’s why we created an additional section where you can adjust any element’s size, style, and more.
Combined with extensive color and transparency options, this feature provides a flexible appearance for the indicator on any chart.
Below, you can see the settings available in this section
🔔 Alert Customization
You can configure over 16 types of reactions to various events on the chart. Additionally, you can set up alerts to trigger at specific fill levels and explore numerous other alert options, as shown in the screenshot below.
🟠 Usage Examples
We have also prepared several examples of how to use the indicator. These are standard entry models taken from the classic Smart Money concept.
First Example
In the screenshot above, the market displays a downward structure until a manipulation occurs, followed by a CHoCH break. This is a standard entry model featuring an entry at the nearest FVG, a stop-loss placed beyond the manipulation, and a target at the nearest liquidity zone—whether session-based or, as in our case, a gap (one of the FVG types) that price commonly revisits.
This is considered a more aggressive entry because we only waited for a single confirmation of the trend change—the CHoCH break—and then entered immediately afterward. While the WinRate might be lower in such trades, the Risk-Reward ratio is typically very high if you correctly identify the manipulation.
Second Example
This approach is more conservative and less risky, typically offering a higher WinRate but with a lower Risk-Reward ratio.
Here, we use the 4H FVG as our decision point (POI). With the indicator, we plot the 4-hour FVG on our current chart without needing to switch back and forth between timeframes.
Once price reaches our POI, we look for an entry model that includes three confirmations:
First Confirmation – A CHoCH break.
Second Confirmation – A manipulation.
Third Confirmation – A second BOS break.
We wait for all these confirmations before entering the trade, ensuring our stop-loss is well-protected since the remaining liquidity has been swept and the 4-hour FVG has been fully filled.
Our target is the full fill of a higher timeframe FVG or other high-liquidity levels below.
In a conservative setup, it is crucial to allow a complete OrderFlow to develop, including manipulations and clear breaks of lower levels. This approach helps protect the trade and often results in a higher WinRate.
🟠 Disclaimer
Past performance is not indicative of future results. To trade successfully, it is crucial to have a thorough understanding of the market context and the specific situation at hand. Always conduct your own research and analysis before making any trading decisions.
To gain access to the indicator, please review the author's instructions below this post

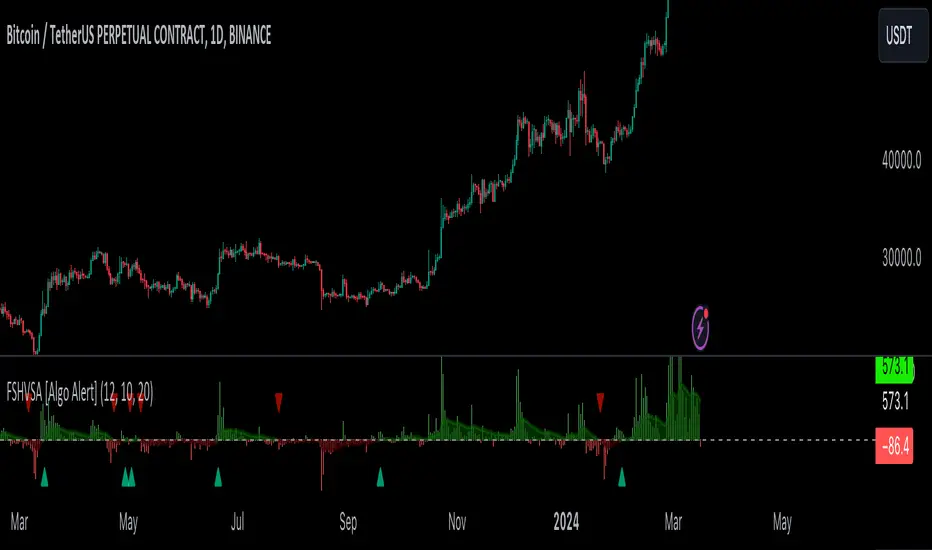
Volume Surge Analysis [UAlgo]The "Volume Surge Analysis " indicator is designed to detect significant volume surges in the market. By analyzing volume relative to its moving average and incorporating a comparison of the true range of price movements, this script highlights potential bullish and bearish volume spikes. Traders can utilize these signals to identify moments of heightened market activity that may indicate strong buying or selling pressure.
🔶Features
Volume Multiplier: Customizable setting to define the threshold for what constitutes a volume surge.
Volume SMA Length: Adjustable length for the Simple Moving Average (SMA) of volume.
Price Movement Analysis
Enhances the volume analysis by adding an additional layer of context, helping to confirm whether a volume surge is associated with buying or selling pressure.
True Range Calculation: Measures the range of price movement to understand volatility.
Positive Movement (DM+): Calculated when the current high minus the previous high is greater than the previous low minus the current low. This helps identify strong upward movements.
Negative Movement (DM-): Calculated when the previous low minus the current low is greater than the current high minus the previous high. This helps identify strong downward movements.
Integration with Volume Analysis: By combining the volume analysis with price movement analysis, the script can more accurately determine whether a volume surge is likely driven by bullish or bearish sentiment. This integration helps filter out false signals and provides more reliable indications of market activity.
Median Volume Comparison: Compares the current volume against the median volume multiplied by the volume multiplier to identify significant volume spikes.
Bullish and Bearish Surge Signals: Plots circles above or below bars where significant volume surges occur, indicating potential bullish or bearish movements.
Color Customization: Options to set specific colors for bullish and bearish signals to enhance visual clarity.
Bar Coloring: Optional feature to change the color of bars based on detected volume surges.
Alerts: Configurable alerts for bullish and bearish volume spikes to notify traders in real-time.
🔶Interpretation:
Bullish Volume Surges ( Teal Circles ): These circles appear above the bar when the current volume exceeds the median volume by the specified Volume Multiplier, and the smoothed Positive Directional Index (PDI) is greater than the smoothed Negative Directional Index (NDI). This suggests a potential uptrend with strong buying pressure.
Bearish Volume Surges ( Red Circles ): These circles appear below the bar when the current volume exceeds the median volume by the specified Volume Multiplier, and the smoothed NDI is greater than the smoothed PDI. This suggests a potential downtrend with strong selling pressure.
Overall, the "Volume Surge Analysis " indicator serves as a valuable tool for traders seeking to identify potential trend reversals or strong continuations based on with an above-average rise in volume and directional momentum.
🔶Disclaimer
This indicator is intended for informational and educational purposes only and should not be construed as financial or investment advice. Trading involves substantial risk, and it is essential to conduct your own research and consult with a qualified financial advisor before making any trading decisions.

KillZones & Sessions [TradingFinder] Volume | Asia, London & NY🔵 Introduction
🟣 Session
The forex market operates 24 hours a day, 5 days a week, with only Saturdays and Sundays being off; traders often focus on one of the forex trading sessions instead of trying to trade in all markets 24 hours a day.
Trading sessions are time intervals during which a specific financial market is active and trades are conducted. The Asia, London, and New York sessions are the most important trading sessions throughout the 24-hour period, during which a significant amount of money and liquidity enters the market.
🟣 Kill Zone
Traders in financial markets profit from the difference between the price at which they buy or sell and the current market price. Traders have different time horizons for trading.
Among these, some traders engage in daily or even hourly trading and must operate during times when the market has desirable trading volumes and significant price movements.
Kill zones are segments of a session with higher trading volumes and price fluctuations compared to the rest of the session.
🔵 How to Use
🟣 Session Time
The "Asia Session" consists of two sessions: "Sydney" and "Tokyo." The beginning of this session, according to the "UTC" time zone, is at 23:00 and ends at 06:00. Similarly, the beginning of the "Asia KillZone," according to the "UTC" time zone, is at 23:00, and it ends at 03:55.
The "London Session" consists of two sessions: "Frankfurt" and "London." The beginning of this session, according to the "UTC" time zone, is at 07:00, and it ends at 14:25. Similarly, the beginning of the "London KillZone," according to the "UTC" time zone, is at 07:00, and it ends at 09:55.
The beginning of the "New York am" session, according to the "UTC" time zone, is at 14:30, and it ends at 19:25. Similarly, the beginning of the "New York am KillZone," according to the "UTC" time zone, is at 14:30, and it ends at 16:55.
The beginning of the "New York pm" session, according to the "UTC" time zone, is at 19:30, and it ends at 22:55. Similarly, the beginning of the "New York pm KillZone," according to the "UTC" time zone, is at 19:30, and it ends at 20:55.
Important : To prevent session overlap, the working hours of each session have slightly changed.
🔵 Features
🟣 Simultaneous Session and Kill Zone
With this indicator, you can simultaneously view the kill zone and session. High and low lines are used to indicate sessions, while filled areas with color represent kill zones. If you do not want to see kill zones, you can turn off the display settings.
🟣 Candle, Time, and Volume
Using the "More Info" feature, you can see the number of candles, elapsed time, and traded volume within the colored filled area.
🔵 Settings
•Show More Info: To display "More Info," you need to turn on this feature and turn it off whenever you don't need it.
• You can also customize these settings for each session separately :
o Display or hide session.
o Choose session color.
o Set session time range.
o Display or hide kill zone.
o Set kill zone time range.

Volume Spectrum Candles"Volume Spectrum Candles" is a visually intuitive trading indicator that enhances candlestick charts by incorporating trading volume directly into the color of each candle.
Purpose and Utility:
This tool assigns a unique color gradient to candlesticks, which varies from light to dark based on the volume of trades executed. This feature allows traders to immediately recognize and differentiate periods of varying trading activity at a glance.
Target User:
It is specifically designed for traders who integrate volume analysis into their trading strategies, offering a seamless blend of visual cues and technical data.
Benefits:
By providing a visual representation of volume intensity, traders can more effectively identify key market movements, helping to determine optimal entry and exit points. The color gradation adds a layer of quick analysis, making it easier to spot trends in trading volume without the need for additional indicators.
Application and Versatility:
Whether used by day traders to capture short-term price movements or by long-term investors to gauge broader market sentiment, "Volume Spectrum Candles" serves as a valuable addition to any trading setup.

Volume Profile with Node Detection [LuxAlgo]The Volume Profile with Node Detection is a charting tool that allows visualizing the distribution of traded volume across specific price levels and highlights significant volume nodes or clusters of volume nodes that traders may find relevant in utilizing in their trading strategies.
🔶 USAGE
The volume profile component of the script serves as the foundation for node detection while encompassing all the essential features expected from a volume profile. See the sub-sections below for more detailed information about the indicator components and their usage.
🔹 Peak Volume Node Detection
A volume peak node is identified when the volume profile nodes for the N preceding and N succeeding nodes are lower than that of the evaluated one.
Displaying peak volume nodes along with their surrounding N nodes (Zones or Clusters) helps visualize the range, typically representing consolidation zones in the market. This feature enables traders to identify areas where trading activity has intensified, potentially signaling periods of price consolidation or indecision among market participants.
🔹 Trough Volume Node Detection
A volume trough node is identified when the volume profile nodes for the N preceding and N succeeding nodes are higher than that of the evaluated one.
🔹 Highest and Lowest Volume Nodes
Both the highest and lowest volume areas play significant roles in trading. The highest volume areas typically represent zones of strong price acceptance, where a significant amount of trading activity has occurred. On the other hand, the lowest volume areas signify price levels with minimal trading activity, often indicating zones of price rejection or areas where market participants have shown less interest.
🔹 Volume profile
Volume profile is calculated based on the volume of trades that occur at various price levels within a specified timeframe. It divides the price range into discrete price intervals, typically known as "price buckets" or "price bars," and then calculates the total volume of trades that occur at each price level within those intervals. This information is then presented graphically as a histogram or profile, where the height of each bar represents the volume of trades that occurred at that particular price level.
🔶 SETTINGS
🔹 Volume Nodes
Volume Peaks: Toggles the visibility of either the "Peaks" or "Clusters" on the chart, depending on the specified percentage for detection.
Node Detection Percent %: Specifies the percentage for the Volume Peaks calculation.
Volume Troughs: Toggles the visibility of either the "Troughs" or "Clusters" on the chart, depending on the specified percentage for detection.
Node Detection Percent %: Specifies the percentage for the Volume Troughs calculation.
Volume Node Threshold %: A threshold value specified as a percentage is utilized to detect peak/trough volume nodes. If a value is set, the detection will disregard volume node values lower than the specified threshold.
Highest Volume Nodes: Toggles the visibility of the highest nodes for the specified count.
Lowest Volume Nodes: Toggles the visibility of the lowest nodes for the specified count.
🔹 Volume Profile - Components
Volume Profile: Toggles the visibility of the volume profile with either classical display or gradient display.
Value Area Up / Down: Color customization option for the volume nodes within the value area of the profile.
Profile Up / Down Volume: Color customization option for the volume nodes outside of the value area of the profile.
Point of Control: Toggles the visibility of the point of control, allowing selection between "developing" or "regular" modes. Sets the color and width of the point of control line accordingly.
Value Area High (VAH): Toggles the visibility of the value area high level and allows customization of the line color.
Value Area Low (VAL): Toggles the visibility of the value area low level and allows customization of the line color.
Profile Price Labels: Toggles the visibility of the Profile Price Levels and allows customization of the text size of the levels.
🔹 Volume Profile - Display Settings
Profile Lookback Length: Specifies the length of the profile lookback period.
Value Area (%): Specifies the percentage for calculating the value area.
Profile Placement: Specify where to display the profile.
Profile Number of Rows: Specify the number of rows the profile will have.
Profile Width %: Adjusts the width of the rows in the profile relative to the profile range.
Profile Horizontal Offset: Adjusts the horizontal offset of the profile when it is selected to be displayed on the right side of the chart.
Value Area Background: Toggles the visibility of the value area background and allows customization of the fill color.
Profile Background: Toggles the visibility of the profile background and allows customization of the fill color.
🔶 RELATED SCRIPTS
Supply-Demand-Profiles
Liquidity-Sentiment-Profile
Thanks to our community for recommending this script. For more conceptual scripts and related content, we welcome you to explore by visiting >>> LuxAlgo-Scripts .

Volume Flow ImbalanceVolume Flow Imbalance (VFI) Indicator
The Volume Flow Imbalance (VFI) indicator is designed to provide traders with insights into the market's buying and selling pressure by calculating the imbalance between buy and sell volumes over a user-defined lookback period. This indicator is particularly useful for identifying potential pivot points and market sentiment shifts.
How to Use :
Setup Parameters :
Lookback Period: Set the number of bars over which the imbalance is calculated. Increasing this number provides a broader view of market trends.
Lower Timeframe Data: Optionally enable this feature to analyze volume data from lower timeframes, offering a more granified view of volume flows.
Interpreting the Indicator :
The VFI outputs a value that represents the net imbalance between buying and selling volumes. Positive values indicate a predominance of buying volume, suggesting bullish conditions, while negative values suggest bearish conditions with more selling volume.
The indicator also provides dynamic threshold lines based on the standard deviation of the calculated imbalances, helping to visually identify extreme conditions where reversals might occur.
Application :
Apply the VFI to any chart to assess the balance of trade volumes in real-time.
Use the indicator in conjunction with other technical analysis tools to confirm trends or potential reversals.
Tips :
Adjust the lookback period based on the volatility and trading volume of the asset to optimize performance.
The VFI is best used in liquid markets where volume data is a reliable indicator of market activity.
By providing a clear measure of how much buying and selling is occurring relative to the past, the VFI helps traders make informed decisions based on underlying market dynamics.

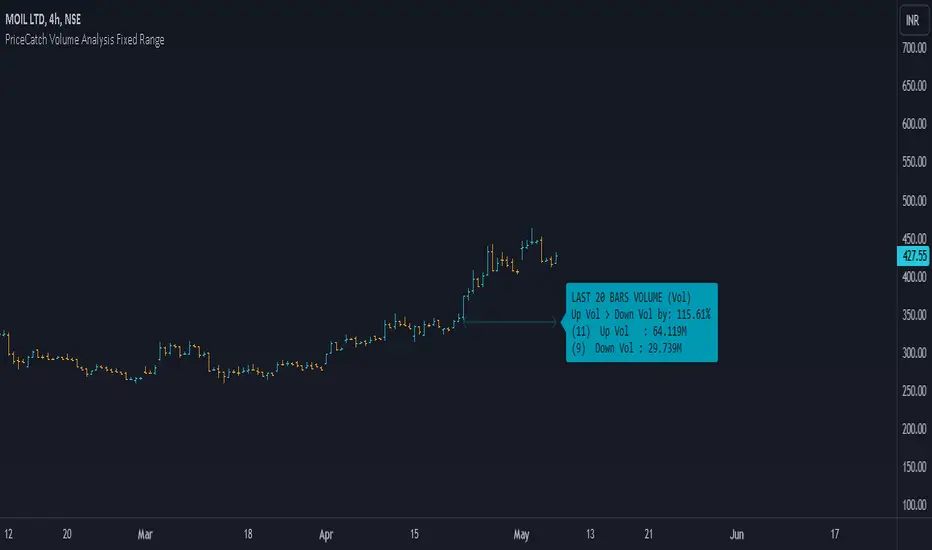
PriceCatch Volume Analysis Fixed RangeHi TV Community.
It's been sometime since I published any script / utility. But today, I am back with a new script.
Volume Analysis
Studying volume when in trade or before taking one is very important as seasoned traders would tell you. So, this script helps you to look at volume over a specific interval from current bar. You will have to set the look-back period in the settings dialog.
The script will then show over that period :
Number of Up and Down bars
Volume Ratio of Up Volume over Down Volume
Actual Up and Down Volume
Percentage of Up Volume to Down Volume
I use this information in all my trades and hope that you will also find this Script useful.
To my knowledge, I have not seen another volume analysis script that helps see volume in the way this script does.
NOTE:
This script does not give any buy or sell signal if that is what you are looking for. But if you see that Up Volume is 3 times Down Volume, then that should mean something to you. So also when price is slipping down.
Disclaimer
I am sharing this Script without any warranties as to its usability. Use it only if you like it. As always when it comes to trading you and you alone are responsible for your actions.
All the best with your trades.
PriceCatch
NZTVolumeDESCRIPTION IN ENGLISH
🔶 INTRODUCTION
NZTVolume is an advanced indicator for TradingView , inspired by the mentor Almaz . It is intended to facilitate the analytical work of traders who actively use data on real trading volumes in their analysis. The indicator also has many features that simplify operation and provide great opportunities for analysis , including the key function - identification of effective and ineffective movements, which are described below.
🔶 CONTENT
This tool provides detailed visualization of real volume . Other features such as candlestick color change depending on volume, histogram display percentage change in volume , and display candles that have gained liquidity, but the most unique function is the determination of effective and ineffective movements, alerts for them are built into the indicator, and traders will have a unique opportunity by setting alerts to wait for the first effective movement (its meaning and description below) , all this is implemented through advanced computational algorithms applied in the code.
Key features include Real Volume Histogram, Dynamic Candle Color Change, Average Volume Table, Volume Percent Change, Liquidity taken Candle, Volume Moving Averages, Effective and ineffective movements with their lines, 3 types of customizable Volume Alerts.
🔶 LOGIC
🔹 Dynamic Candle Color Change (Изменять цвет свечей)
Candles change to a contrasting color if their volume exceeds that of the previous candle , differentiated into bullish and bearish , including settings for transparency and colors . Can be configured, enabled of or disabled.
🔹 Real Volume Histogram (Показывать гистограмму объемов)
Automatically retrieves data on volumes and shows it on a chart. Can be configured, enabled of or disabled.
🔹 Liquidity Taken Candle (Показывать свечу собравшую ликвидность)
A candle that has taken/captured liquidity , which is determined in the code by the high and low prices of the candle and the volume it has , is displayed on the histogram . Can be configured, enabled or disabled.
🔹 Percent Change Volume (Показывать гистограмму процентного изменения объема)
Calculates and displays volume percent changes on a histogram. Can be configured, enabled or disabled.
🔹 Effective and Ineffective movement/column (Показывать эффективные и неэффективные движения)
By calculating the average volatility of the last bars, as well as calculating the average volume of the last bars, comparing and contrasting them, we obtain the principle of effective and ineffective movement/column. The code includes alerts that allow you to notify the user when the first effective movement/candle appears, which can significantly improve trading and maintain concentration. Basically it's a specific column on histogram, but is called movement so that's it's easier to understand its logic.
🔹 Line of efficiency and inefficiency (Показывать линии эффективности и неэффективности)
These lines connect all effective and ineffective movements' highs on the histogram, allowing traders to practice, as well as build their trading strategy for the trading day.
🔹 Average Volume Table (Показывать таблицу со средним объемом)
Displays the average volume per bar for selected time intervals with the ability to customize the period . Can be configured, enabled or disabled.
🔹 Volume Moving Averages (Показывать среднюю скользящую объема)
Three lines corresponding to users' set time intervals show the change in volume with color and thickness settings. Can be configured, enabled or disabled.
🔹 Alerts (Во сколько раз объем свечи должен превышать предыдущую для алерта)
Alerts can be triggered by 3 conditions
1. if on the selected timeframe the volume of the current candle exceeds the volume of the previous candle by a user-specified number of times , an alert will be triggered.
2. if a liquidity candle appears on the selected timeframe , an alert is triggered.
3. if an effective column/movement appears on the selected timeframe, an alert is triggered.
It can be configured, enabled or disabled.
🔶 TECHNICAL SPECIFICATION AND UNIQUENESS
At the core of NZTVolume is a series of advanced algorithms that analyze volume data in real-time.
Some of them are:
Calculate average volumes by given time period (in hours).
Candles, that took liquidity - considers high volume and wicks' size.
Percent volume change histogram - calculate percent change of volume for every bar and shows it on graph.
Effective and ineffective movement - calculates by algorithm that considers average volume and average volatility, assuming that big market players will contribute the volume.
🔶 DEMONSTRATION OF HOW THE INDICATOR WORKS ON DIFFERENT ASSETS
NZTLevel + NZTVolume Together
🔶 SETTINGS
🔹 Candles (Свечи)
Enable/disable color changes of candles based on volume . Customize colors of contrasting and standard candles, adjust transparency.
🔹 Histogram Settings (Настройки Гистограммы)
Show volume histogram , show liquidity taken candle, show volume percent change histogram, show effective, ineffective movements, show efficiency/inefficiency line.
🔹 Display settings on the Histogram (Настройки отображения на Гистограмме)
Customizable colors for bullish, bearish, liquidity taken columns as well as for effective and ineffective movement/columns and for lines that connect them.
🔹 Table (Таблица)
Toggle the display of the average volume table, customize the background, and set time ranges (3 parameters, multi-timeframe support). Tables shows "average volume over 24/48/72 hours" in translation
🔹 Lines (Линии)
Option to display/hide average volume lines , select colors and thickness for each of the three lines.
🔹 Alerts (Алерты)
As was said before, there are 3 types of alerts , that can be turned off , there is a parameter can be chosen - How many times volume of the current candle should exceeds the volume of the previous candle to trigger alert
🔶 RECOMMENDATIONS FOR USE
It is recommended to set and save the indicator settings that best match your trading preferences to ensure efficiency and ease of use.
NZTVolume stands out among other indicators for its universal functions, versatility, simplicity of installation and setup, high performance, and extensive customization capabilities, making it an indispensable tool for traders of all levels.
The indicator was developed by Temirlan Tolegenov for NZT Trader Community, April 2024, Prague, Czech Republic
ОПИСАНИЕ НА РУССКОМ ЯЗЫКЕ
🔶 ВСТУПЛЕНИЕ
NZTVolume — это продвинутый индикатор для TradingView , вдохновленный ментором Алмазом . Он предназначен для облегчения аналитической работы трейдеров, которые активно используют данные о реальных объёмах торгов в своем анализе. Индикатор также имеет множество функций, которые упрощают работу и предоставляют большие возможности для анализа , включая ключевую функцию - выявление эффективных и неэффективных движений, которые описаны ниже.
🔶 СОДЕРЖАНИЕ
Индикатор обеспечивает детальную визуализацию реального объема . Другие функции, такие как изменение цвета свечей в зависимости от объема, отображение гистограммы процентное изменение объема и отображение свечи, собравшей ликвидность, но самой уникальной функцией является определение эффективных и неэффективных движений, оповещения по ним встроены в индикатор, и у трейдеров появится уникальная возможность установить оповещения на ожидание первого эффективного движения (его смысл и описание ниже). ) , всё это реализовано посредством продвинутых вычислительных алгоритмов, примененных в коде.
Ключевые функции включают в себя гистограмму реального объема, динамическое изменение цвета свечи, таблицу среднего объема, процентное изменение объема, свечу, взявшую ликвидности, скользящие средние объема, эффективные и неэффективные движения с их линиями, 3 типа настраиваемых параметров. Оповещения об объеме.
🔶 ЛОГИКА
🔹 Динамическое изменение цвета свечей (Изменить цвет свечей)
Свечи меняют цвет на контрастный , если их объем превышает объем предыдущей свечи , дифференцируются на бычьи и медвежьи , включая настройки прозрачности и цвета . Можно настроить, включить или отключить.
🔹 Гистограмма реального объёма (Показывать гистограмму объёмов)
Автоматически извлекает данные по объемам и отображает их на графике. Можно настроить, включить или отключить.
🔹 Свеча, собравшая ликвидность (Показывать свечу собравшую ликвидность)
Свеча, собравшая ликвидность , которая определена в коде максимальной и минимальной ценой свечи и объемом, который она имеет , отображается на гистограмма . Можно настроить, включить или отключить.
🔹 Процентное изменение объема (Показывать гистограмму процентного изменения объема)
Вычисляет и отображает процентные изменения объема на гистограмме. Можно настроить, включить или отключить.
🔹 Эффективные и неэффективные движения(Показать Эффективныеи неэффективные движения)
Рассчитав среднюю волатильность последних баров, а также вычислив средний объем последних баров, сравнивая и противопоставляя их, мы получаем принцип эффективного и неэффективного движения/столбца. В код включены оповещения, которые позволяют оповещать пользователя при появлении первого эффективного движения/свечи, что позволяет существенно улучшить торговлю и сохранить концентрацию. По сути, это отдельный столбец на гистограмме, но он называется движением, потому что так, его логику будет легче понять.
🔹 Линия эффективности и неэффективности (Показывать линии эффективности и неэффективности)
Эти линии соединяют хаи всех эффективных и неэффективных движений на гистограмме, позволяя трейдерам практиковаться, а также строить свою торговую стратегию на торговый день.
🔹 Таблица среднего объема (Показать таблицу со значением определения)
Отображает средний объем на бар для выбранных временных интервалов с возможностью настройки периода . Можно настроить, включить или отключить.
🔹 Скользящие средние объёма (Показать среднюю скользящую объём)
Три линии, соответствующие установленным пользователем временным интервалам , показывают изменение объема с настройками цвета и толщины. Можно настроить, включить или отключить.
🔹 Оповещения (Во сколько раз объем свечи должен превышать предыдущую для оповещения)
Оповещения могут быть вызваны тремя условиями
1. Если на выбранном таймфрейме объем текущей свечи превысит объем предыдущей свечи в заданное пользователем количество раз , сработает оповещение
2. Если на выбранном таймфрейме появляется свеча ликвидности , срабатывает оповещение
3. Если на выбранном таймфрейме появляется эффективный столбец/движение , срабатывает оповещение.
Это можно настроить, включить или отключить.
🔶 ТЕХНИЧЕСКИЕ ХАРАКТЕРИСТИКИ И УНИКАЛЬНОСТЬ
В основе NZTVolume лежит серия продвинутых алгоритмов, которые анализируют данные об объемах в режиме реального времени.
Некоторые из них:
Рассчёт средние объёмы за заданный период времени (в часах).
Свечи, снявшие ликвидность - учитывает большой объем и размер шпилей.
Процентное изменение объема на гистограмме — рассчитывает процентное изменение объема для каждого бара и отображает его на графике.
Эффективное и неэффективное движение - рассчитывается по алгоритму, учитывающему средний объем и среднюю волатильность, предполагая, что объем крупных игроков будет сигнализировать о намерении рынка и силе движения.
🔶 НАСТРОЙКИ
🔹 Свечи
Включить/отключить изменение цвета свечей в зависимости от объема . Настройте цвета контрастных и стандартных свечей, настройте прозрачность.
🔹 Настройки гистограммы
Показать гистограмму объема , показать свечу взятой ликвидности, показать гистограмму процентного изменения объема, показать эффективные и неэффективные движения, показать линию эффективности/неэффективности.
🔹 Настройки отображения на гистограмме
Настраиваемые цвета для бычьих, медвежьих, свечей, собравших ликвидность столбцов, а также для эффективных и неэффективных движений/столбцов и линий, которые их соединяют.
🔹 Таблица
Переключайте отображение таблицы среднего объема, настраивайте фон и устанавливайте временные диапазоны (3 параметра, мультитаймфрейм).
🔹 Линии
Возможность отобразить/скрыть линии среднего объема , выбрать цвет и толщину для каждой из трех линий.
🔹 Алерты
Как было сказано ранее, есть 3 типа оповещений , которые можно отключить , можно выбрать параметр — во сколько раз объем текущей свечи должен превышать объем предыдущей свечи, чтобы сработало оповещение.
🔶 РЕКОМЕНДАЦИИ К ИСПОЛЬЗОВАНИЮ
Рекомендуется установить и сохранить настройки индикатора, которые лучше всего соответствуют вашим торговым предпочтениям, чтобы обеспечить эффективность и простоту использования.
NZTVolume выделяется среди других индикаторов своими универсальными функциями, универсальностью, простотой установки и настройки, высокой производительностью и широкими возможностями настройки, что делает его незаменимым инструментом для трейдеров всех уровней.
Индикатор разработан Темирланом Толегеновым для международного сообщества NZT Trader , Апрель 2024, Прага, Чешская Республика.
The indicator is published in accordance and respect to all House Rules of the TradingView platform.
Индикатор опубликован в соответствии и уважением ко всем внутренним правилами платформы TradingView.

sVPSA - standardized Volume Price Spread AnalysisDear Analysts and Traders,
I want to introduce my new indicator - sVPSA - standardized Volume Price Spread Analysis. For me, this script is helpfully in Technical Analysis mainly with Wyckoff and VSA methodologies. Maybe You are in circle of people who used my previous script - normalized Volume Price Spread Analysis. I work with him a lot of time, but I come to a conclusion that I can do better...
Theory concept...
What is a big volume? How big was this spread? It was extreme high or just high? How to do an answer for this and a lot other questions related to this subject? My thoughts was directed to statistics. In my first script I used to x/max normalized data. It was good, but susceptible for high deviation events. So, I choose standardization method with smaller sensitivity on violent events - z-Score standardization Description of z-Score formula:
Z = (x-mean)/standard deviation
Probability of event are descriptive by probability density function - The Normal Distribution.
en.wikipedia.org
en.Wikipedia.org
This is base of script methodology, let’s go deeper in indicator.
X axis is time, date. Y axis is standard deviation. Narrow bar represent price spread, wide one is volume. Colors are corresponding to deviation, blue < sigma, green > sigma, red > 2*sigma and fuchsia > 3*sigma. Appearance is full editable.
Data collection starts from left to right. There is two possibilities to use, constans number of bars or visible data range, also indicator permit to overscore linear regression from data. There is a possibility to set an alert.
Short introduction how put an interpretation on visualized data.
For this example I used constans value of data collection, 52 bars. So, from left I see great, fuchsia volume bar with low spread. This record respond Celsius withdrawals pause. This is bar with the biggest volume on presented chart, more than four sigmas. Spread value is near one sigma. I should consider this via one of Wyckoffs laws - effort vs result. I see a three bars in turn, they tenor tells me that bear market is possible near end. Accumulation structure near new year, spring test and bullish momentum bar near march are approval of this idea. Next high spread bars have volume near mean value. Effort is low but result is great. Interesting is last bar, with -2,8 deviation of volume. I see the lowest volume value on chart, so he’s deviation is strong to negative side. This script require a little of practise and can be a potent tool in Technical Analysis.
If You have a concept how to improve my script or You experience bug, please, send me feedback.
I hope that You consider my work as useful.
I wish You great trades and faultless analysis.
CatTheTrader
Smart Money Interest Index [AlgoAlpha]🌟 Smart Money Interest Index by AlgoAlpha 🌟
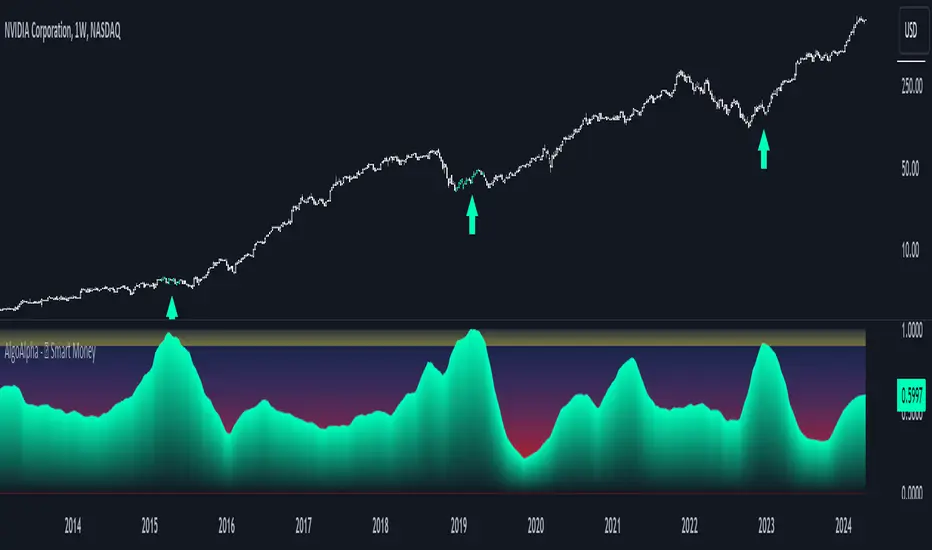
Welcome to the innovative Smart Money Interest Index indicator, designed meticulously by AlgoAlpha to revolutionize the way you trade! 📈🧠 This indicator is engineered to decipher the activities of smart money investors relative to the less informed (dumb money) and dynamically display their dominance in the trading landscape through a sophisticated visual index. 🚀💹
🔑 Key Features:
- Smart vs. Dumb Money Analysis: Tracks and compares the movements of smart money (informed investors) and dumb money (general public) within the market to identify potential investment signals.
- Relative Strength Index (RSI) Based Ratios: Utilizes RSI for both smart and dumb money to create a ratio that indicates buying or selling pressures.
- Dynamic Normalization: Employs a long-term peak normalization over a customizable period to ensure the index remains relevant regardless of market conditions.
- Visual Thresholds and Signals: Highlights significant shifts in market dynamics with color-coded thresholds, making it easier to spot changes at a glance.
🛠 How to Use the Smart Money Interest Index:
🔹 🚀 Step 1: Adding the Indicator
- Add the indicator to your favourites.
- Customize the settings according to your analysis needs:
- `Index Period`, `Volume Flow Period`, `Normalization Period`, `High Interest Threshold`
🔹 📊 Step 2: Interpretation of the Index
- Monitor the index plot; a rising index suggests increasing smart money interest, potentially indicating a buying opportunity.
- A value above the high interest threshold (in yellow) highlights significant interest by smart money, suggesting a good time to buy.
🔹 🔔 Step 3: Setting Alerts
- Configure alerts to notify you when the index crosses above the set threshold, enabling you to capitalize on trading opportunities timely and efficiently.
📐 Basic Logic Overview:
The Smart Money Interest Index by AlgoAlpha provides a unique metric that contrasts the investment behaviors of informed (smart money) and general (dumb money) investors. Utilizing the Relative Strength Index (RSI), this indicator evaluates the trading pressure exerted by both groups over specified periods, then forms a ratio of these activities to identify dominance in buying or selling trends. For example, when we see dumb money selling and smart buying, this suggests that the conditions for buying the asset is optimal as smart money is willing to buy the dip. The outputs are normalized against the highest values observed in a user-defined term to maintain consistency through varying market conditions. When the index exceeds a certain threshold, it suggests that smart money presence is particularly strong, possibly indicating that smart money is looking to enter positions on the asset. This tool serves as a sophisticated visual guide to understanding market dynamics and making well-informed trading decisions based on the activities of market-savvy investors. Smart money activity is identified during areas of low volume and the opposite for dumb money, the indicator uses the NVI and PVI metrics as its foundation for smart and dumb money analysis.
📊 Enhance Your Trading Strategy:
Leverage the Smart Money Interest Index to gain deeper insights into market dynamics and enhance your decision-making process with a powerful, data-driven approach. Whether you're looking to identify entry points or set strategic exits, this tool is designed to provide you with the competitive edge you need in the fast-paced world of trading. 🌐✨
Transform your trading with the power of smart money analysis—start using the Smart Money Interest Index today! 🚀🔔
Volume Buy/Sell Signals [EdgeTerminal]Volume Signals is an indicator based on volume moving averages and divergence to provide different types of information.
The first signal is the peak volume box shown in red or green, showing the volume peak in an uptrend or downtrend. This usually is a sign of reversal or a slowdown in the trend, depending on the direction of the price.
Peak zones assume that a movement has reached your end for the time being or a new movement is initiated. This cannot be verified by simple volume alone, that's why we have a buy/sell signal feature based on divergence.
The narrow box indicates a continuation of the trend but can be used as support or resistance.
Medium box size usually means the price is in an accumulation phase. This can act as both support and resistance, meaning if the price pushes above, a long position can be taken, and if the price drops below, a short position can be taken.
Large box size indicates a range in which the price will stay shortly. This is usually a sign of high volume volatility and depending on the direction, the price can revisit the area and drop back down or go back up fast. For example, if the large green box appears after a major volume peak and if the price goes above the box, there is a major chance that the price will revisit the box zone and will drop as fast as it went up.
The second signal is a buy/sell signal generated based on the volume divergence and volume numbers compared to average volume values. If the volume is showing signs of lower lows or higher highs, the signal will appear. This indicator is great at generating early entry and exit signals.
Additionally, the script can generate LP (lower possibility) buy/sell signals. Usually, the script looks for two moving average lower lows in volume to generate a signal but when this is turned on, the indicator will also show single confirmed (we call them lower possibility) signals. This is useful when there are not enough signals generated on screen and you want to see more data points.
The settings:
Volume Peak MA: Sets the moving average of the volume peak,
Volume Peak Box Length: Defines the box display length of the volume box across the chart
Volume Box Threshold: Threshold of volume peak detection. A lower number generates more signals and a higher number generates fewer.
First Signal MA Length: First moving average length used in the calculation of the volume signals
Second Signal MA length: Second moving average length used in the calculation of the volume signals
Volume Lookback Right: How many bars to look back on the right side (forward) to confirm the signal
Volume Lookback Left: How many bars to look back on the left side (behind) to confirm the signal
Max Lookback Range: Max lookback range for the KNN machine learning volume data of signal generation.
Min Lookback Range: Minimum lookback range for the KNN machine learning volume data of signal generation.
Show Buy Signals: It shows or hides buy signals.
Show LP Buys: It shows or hides lower possibility buy signals.
Show Sell Signals: It shows or hides sell signals.
Show LP Sells: It shows or hides lower possibility sell signals.

Volumetric Fair Value Gaps [AlgoAlpha]🎯 Introducing the Volumetric Fair Value Gaps by AlgoAlpha 🎯
Embrace the power of volume and price action with the Volumetric Fair Value Gaps (VFVG) indicator, designed meticulously by AlgoAlpha. This innovative tool enhances your charting capabilities by highlighting fair value gaps in real-time, facilitating superior market entry and exit decisions. 🚀📈
🔍 Key Features:
🔹 Fair Value Gap Detection: Utilizes price action and volume to identify significant fair value gaps, offering potential high-probability trading opportunities.
🔹 Adjustability: Customize the sensitivity with 'FVG Noise Reduction Length' and 'Noise Reduction Factor' to match the volatility and characteristics of the asset being traded.
🔹 Visual Appeal: Displays bullish gaps in a soothing Bullish Color and bearish gaps in a striking Bearish Color, making it easy to spot and analyze trends on the fly.
🔹 Overlay Feature: Plots directly on the price chart for seamless integration and analysis.
🌟 Quick Guide to Using the Volumetric Fair Value Gaps Indicator:
🛠 Add the Indicator: Add the indicator to favourites and set it up with your desired settings.
📊 Market Analysis: Watch for the appearance of colored boxes (blue for bearish, gray for bullish) which represent the fair value gaps. These are high-probability areas for reversals or continuations. FVGs with higher volume are implied to induce a stronger reaction on price.
🔔 Alerts: Set up alerts to notify you when new gaps are detected, ensuring you never miss out on potential trades!
🛠 How It Works:
The Volumetric Fair Value Gaps (VFVG) indicator identifies significant price gaps that are not just based on price action but are also substantiated by volume, which are often overlooked in typical analyses. It operates by comparing the current candle’s price range against historical averages and is calculated over a user-defined period, displayed with volume for further insights. For a gap to be recognized as significant (either bullish or bearish), it must exceed a certain size relative to these averages, which can be adjusted for sensitivity using the provided settings. Bullish gaps are identified when the current low is higher than the second previous high after surpassing the threshold, and bearish gaps are marked when the current high is below the second previous low, similarly surpassing the threshold. This dual-confirmation (volume and price deviation) approach minimizes false signals and enhances the reliability of identified gaps.
Maximize your trading strategy with the VFVG Indicator by AlgoAlpha and turn those gaps into opportunities! 🌈✨

Market Structure Volume Distribution [LuxAlgo]The Market Structure Volume Distribution tool allows traders to identify the strength behind breaks of market structure at defined price ranges to measure de correlation of forces between bulls and bears visually and easily.
🔶 USAGE
This tool has three main features: market structure highlighting, grid levels, and volume profile. Each feature is covered more in depth below:
🔹 Market Structure
The basic unit of market structure is a swing point, the period of the swing point is user-defined, so traders can identify longer-term market structures. Price breaking a prior swing point will confirm the occurrence of a market structure.
The tool will plot a line after a market structure is confirmed, by default the lines on bullish MS will be green (indicative of an uptrend), and red in case of bearish MS (indicative of a downtrend).
🔹 Grid Levels
The Grid visually divides the price range contained inside the tool execution window, into equal size rows, the number of rows is user-defined so users can divide the full price range up to 100 rows.
The main objective of this feature is to help identify the execution window and the limits of each row in the volume profile so traders can know in a simple look what BoMS belongs to each row.
There is however another use for the grid, by dividing the range into equal-sized parts, this feature provides automatic support and resistance levels as good as any other.
Grid provides a visual help to know what our execution window is and to associate MS with their rows in the profile. It can provide S/R levels too.
🔹 Volume Profile
The volume profile feature shows in a visually easy way the volume behind each MS aggregated by rows and divided into buy and sell volume to spot the differences in a simple look.
This tool allows users to spot the liquidity associated with the event of a market structure in a specific price range, allowing users to know which price areas where associated with the most trading activity during the occurrence of a market structutre.
🔶 SETTINGS
🔹 Data Gathering
Execute on all visible range: Activate this to use all visible bars on the calculations. This disables the use of the next parameter "Execute on the last N bars". Default false.
Execute on the last N bars: Use last N bars on the calculations. To use this parameter "Execute on all visible range" must be disabled. Values from 20 to 5000, default 500.
Pivot Length: How many bars will be used to confirm a pivot. The bigger this parameter is the fewer breaks of structure will detect. Values from 1, default 2
🔹 Profile
Profile Rows: Number of rows in the volume profile. Values from 2 to 100, default 10.
Profile Width: Maximum width of the volume profile. Values from 25 to 500, default 200.
Profile Mode: How the volume will be displayed on each row. "TOTAL VOLUME" will aggregate buy & sell volume per row, "BUY&SELL VOLUME" will separate the buy volume from the sell volume on each row. Default BUY&SELL VOLUME.
🔹 Style
Buy Color: This is the color for the buy volume on the profile when the "BUY&SELL VOLUME" mode is activated. Default green.
Sell Color: This is the color for the sell volume on the profile when the "BUY&SELL VOLUME" mode is activated. Default red.
Show dotted grid levels: Show dotted inner grid levels. Default true.

NSE + BSE Volume with Relative Volume Multiplier By AfnanIntroducing the Combined NSE + BSE Volume Indicator with Relative Volume indicator (CRVI).
The Combined NSE + BSE Volume Indicator with Relative Volume Multiplier (CRVI) is an essential tool for Indian traders who are engaged in volume breakout analysis, particularly breakout traders.
Key Features of CRVI:
Combining NSE and BSE Volume: The CRVI consolidates volume data from both the National Stock Exchange (NSE) and the Bombay Stock Exchange (BSE) into a single chart, ensuring that traders do not miss out on vital volume data from either exchange.
Understanding Operator Activity: This indicator gives traders the advantage of identifying whether operators or smart investors are building positions in either exchange. For instance, while observing an NSE stock chart, traders can now identify if operators are building positions in BSE stocks as well.
Add-on to Relative Volume / Volume Breakout Multiplier (RVI) Indicator: The CRVI is an additional feature integrated into the Relative Volume / Volume Breakout Multiplier (RVI) indicator, providing an enhanced perspective on volume dynamics.
Usage of CRVI:
Quantifying Volume Breakouts: The indicator quantifies the degree of volume breakouts concerning the Simple Moving Average (SMA), facilitating a clearer understanding of the strength of volume breakouts.
Relative Volume Interpretation: By comparing the current volume with the volume SMA, the CRVI delivers a breakout number, such as 2.0 for double the volume SMA or 0.50 for half the volume SMA. This assists traders in gauging the momentum and potential trading opportunities more effectively.
Advantages for Traders:
Enhanced Volume Analysis: Breakout traders, in particular, will find the CRVI invaluable for identifying potential trading opportunities and assessing volume strength more accurately.
Essential Toolkit Inclusion: Traders focusing on volume breakout analysis can benefit significantly from incorporating this indicator into their trading toolkit.
Embracing Continuous Improvement:
Every tool and analysis utilized contributes to the ongoing process of becoming more adept traders. Embracing continuous learning and improvement is the foundation of successful trading. As we move forward, armed with the right tools and mindset, we eliminate the doubts of today and pave the way for a more confident tomorrow.
Gratitude :
Your support, likes, and comments are deeply appreciated. If you have any questions, do not hesitate to reach out. Let's work together to make trading an enriching experience!
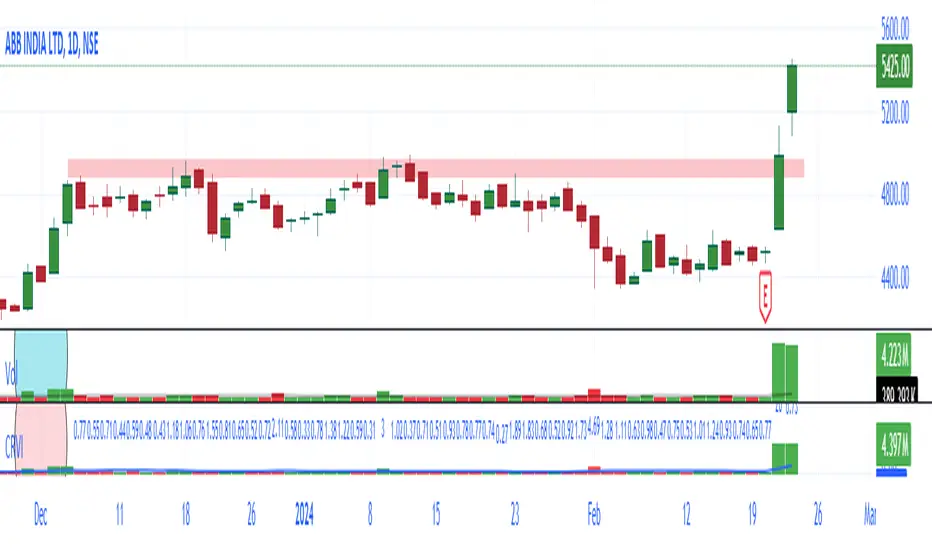
USD VolumeA volume tool but the candles represent Volume in USD Format which is usually
here are some examples of what the numbers represent on the right-hand side.
.01 = $10,000
.5 = $500,000
1 = $1,000,000
50 = $50,000,000
250 = $250,000,000
1000 = $1,000,000,000
The lower line is the "Average Volume" based on lifetime history. Anytime volume is below average, this likely denotes most people have capitulated or the markets have grown bored at these price ranges. A squeeze in volume primes the asset for a big move.
The upper line is the 3rd standard of Deviation from the average line. Anytime volume touches that line or goes higher, this denotes its a very big move relative to how the asset typically trades. If the volume stays above this range for an extended period of time, it would be wise to watch the chart closely and start taking profits off the table whether you're shorting or longing the asset.
Periodic Activity Tracker [LuxAlgo]The Periodic Activity Tracker tool periodically tracks the cumulative buy and sell volume in a user-defined period and draws the corresponding matching bars and volume delta for each period.
Users can select a predefined aggregation period from the following options: Hourly, Daily, Weekly, and Monthly.
🔶 USAGE
This tool provides a simple and clear way of analyzing volumes for each aggregated period and is made up of the following elements:
Buy and sell volumes by period as red and green lines with color gradient area
Delta (difference) between buy & sell volume for each period
Buy & sell volume bars for each period
Separator between lines and bars, and period tags below each pair of bars for ease of reading
On the chart above we can see all the elements displayed, the volume level on the lines perfectly matches the volume level on the bars for each period.
In this case, the tool has the default settings so the anchor period is set to Daily and we can see how the period tag (each day of the week) is displayed below each pair of bars.
Users can disable the delta display and adjust the bar size.
🔹 Reading The Tool
In trading, assessing the strength of the bulls (buyers) and bears (sellers) is key to understanding the current trading environment. Which side, if any, has the upper hand? To answer this question, some traders look at volume in relation to price.
This tool provides you with a view of buy volume versus sell volume, allowing you to compare both sides of the market.
As with any volume tool, the key is to understand when the forces of the two groups are balanced or unbalanced.
As we can observe on the chart:
NOV '23: Buy volume greater than sell volume, both moving up close together, flat delta. We can see that the price is in range.
DEC '23: Buy volume bigger than Sell volume, both moving up but with a bigger difference, bigger delta than last month but still flat. We can see the price in the range above last month's range.
JAN '24: Buy and sell volume tied together, no delta whatsoever. We can see the price in range but testing above and below last month's range.
FEB '24: Buy volume explodes higher and sell volume cannot keep up, big growing delta. Price explodes higher above last month's range.
Traders need to understand that there is always an equal number of buyers and sellers in a liquid market, the quality here is how aggressive or passive they are. Who is 'attacking' and who is 'defending', who is using market orders to move prices, and who is using limit orders waiting to be filled?
This tool gives you the following information:
Lines: if the top line is green, the buyers are attacking, if it is red, the sellers are attacking.
Delta: represents the difference in their strength, if it is above 0 the buyers are stronger, if it is below 0 the sellers are stronger.
Bars: help you to see the difference in strength between buyers and sellers for each period at a glance.
🔹 Anchor Period
By default, the tool is set to Hourly. However, users can select from a number of predefined time periods.
Depending on the user's selection, the bars are displayed as follows:
Hourly : hours of the current day
Daily : days of the current week
Weekly : weeks of the current month
Monthly : months of the current year
On the chart above we can see the four periods displayed, starting at the top left and moving clockwise we have hourly, daily, weekly, and monthly.
🔶 DETAILS
🔹 Chart TimeFrame
The chart timeframe has a direct impact on the visualization of the tool, and the user should select a chart timeframe that is compatible with the Anchor period in the tool's settings panel.
For the chart timeframe to be compatible it must be less than the Anchor period parameter. If the user selects an incompatible chart timeframe, a warning message will be displayed.
As a rule of thumb, the smaller the chart timeframe, the more data the tool will collect, returning indications for longer-term price variations.
These are the recommended chart timeframes for each period:
Hourly : 5m charts or lower
Daily : 1H charts or lower
Weekly : 4H charts or lower
Monthly : 1D charts or lower
🔹 Warnings
This chart shows both types of warnings the user may receive
At the top, we can see the warning that is given when the 'Bar Width' parameter exceeds the allowed value.
At the bottom is the incompatible chart timeframe warning, which prompts the user to select a smaller chart timeframe or a larger "Anchor Period" parameter.
🔶 SETTINGS
🔹 Data Gathering
Anchor period: Time period representing each bar: hours of the day, days of the week, weeks of the month, and months of the year. The timeframe of the chart must be less than this parameter, otherwise a warning will be displayed.
🔹 Style
Bars width: Size of each bar, there is a maximum limit so a warning will be displayed if it is reached.
Volume color
Delta: Enable/Disable Delta Area Display

Delta ZigZag [LuxAlgo]The Delta ZigZag indicator is focused on volume analysis during the development of ZigZag lines. Volume data can be retrieved from a Lower timeframe (LTF) or real-time Tick data.
Our Delta ZigZag publication can be helpful in detecting indications of a trend reversal or potential weakening/strengthening of the trend.
This indicator by its very nature backpaints, meaning that the displayed components are offset in the past.
🔶 USAGE
The ZigZag line is formed by connecting Swings , which can be set by adjusting the Left and Right settings.
Left is the number of bars for evaluation at the left of the evaluated point.
Right is the number of bars for evaluation at the right of the evaluated point.
A valid Swing is a value higher or lower than the bars at the left/right .
A higher Left or Right set number will generally create broader ZigZag ( ZZ ) lines, while the drawing of the ZZ line will be delayed (especially when Right is set higher). On the other hand, when Right is set at 0, ZZ line are drawn quickly. However, this results in a hyperactive switching of the ZZ direction.
To ensure maximum visibility of values, we recommend using " Bars " from the " Bar's style " menu.
🔹 Volume examination
The script provides two options for Volume examination :
Examination per ZigZag line
Examination per bar
Bullish Volume is volume associated with a green bar ( close > open )
Bearish Volume is volume associated with a red bar ( close < open )
Neutral Volume (volume on a " close == open" bar) is not included in this publication.
🔹 Examination per ZigZag line
As long as the price moves in the same direction, the present ZZ line will continue. When the direction of the price changes, the bull/bear volume of the previous ZZ line is evaluated and drawn on the chart.
The ZZ line is divided into two parts: a bullish green line and a bearish red line.
The intercept of these two lines will depend on the ratio of bullish/bearish volume
This ratio is displayed at the intercept as % bullish volume (Settings -> Show % Bullish Volume)
* Note that we cannot draw between 2 bars. Therefore, if a ZZ line is only 1 bar long, the intercept will be at one of those 2 bars and not in between. The percentage can be helpful in interpreting bull/bear volume.
In the example above (2 most right labels), you can see that an overlap of 2 labels is prevented, ensuring the ability to evaluate the bullish % volume of the ZZ line .
The percentage will be colored green when more than 50%, red otherwise. The color will fade when the direction is contradictory; for example, 40% when the ZZ line goes up or 70% when the ZZ line falls.
More details can be visualized by enabling " Show " and choosing 1 of 3 options:
Average Volume Delta/bar
Average Volume/bar
Normalised Volume Delta
For both 'averages', the sum of " Volume "/" Volume Delta " of every bar on the ZZ line is divided by the number of bars (per ZZ line ).
The " Normalised Volume Delta " is calculated by dividing the sum of " Delta Volume " by the sum of " Volume " (neutral volume not included), which is displayed as a percentage.
All three options will display a label at the last point of the ZZ line and be coloured similarly: green when the ratio bullish/bearish volume of the ZZ line is bullish and red otherwise. Here, the colour also fades when it is bullish, but the ZZ line falls or when it is bearish with a rising ZZ line .
A tooltip at each label hints at the chosen option.
You can pick one of the options or combine them together.
🔹 Examination per bar
Besides information about what's happening during the ZZ line , information per bar can be visualized by enabling " Show Details " in Settings .
Split Volume per bar : show the sum of bullish (upV) and bearish (dnV) volume per bar
Volume (bar) : Total Volume per bar (bullish + bearish volume, neutral volume not included)
Δ Volume (bar) : Show Delta Volume (bullish - bearish volume)
🔹 Using Lower Timeframe Data
The ZigZag lines using LTF data are colored brighter. Also note the vertical line where the LTF data starts and the gap between ZZ lines with LTF data and without.
When " LTF " is chosen for the " Data from: " option in Settings , data is retrieved from Lower Timeframe bars (default 1 minute). When the LTF setting is higher than the current chart timeframe, the LTF period will automatically be adjusted to the current timeframe to prevent errors.
As there is a 100K limit to the number of LTF intrabars that can be analyzed by a script, this implies the higher the difference between LTF and current TF; the fewer ZZ lines will be seen.
🔹 Using real-time tick data
The principles are mostly the same as those of LTF data. However, in contrast with LTF data, where you already have LTF ZZ lines when loading the script, real-time tick data-based ZZ lines will only start after loading the chart.
Changing the settings of a ticker will reset everything. However, returning to the same settings/ticker would show the cached data again.
Here, you can see that changing settings reset everything, but returning after 2 minutes to the initial settings shows the cached data. Don't expect it to be cached for hours or days, though.
🔶 DETAILS
The timeframe used for LTF data should always be the same or lower than the current TF; otherwise, an error occurs. This snippet prevents the error and adjusts the LTF to the current TF when LTF is too high:
res = input.timeframe('1')
res := timeframe.from_seconds( math.min( timeframe.in_seconds(timeframe.period), timeframe.in_seconds(res) ) )
🔶 SETTINGS
Data from: LTF (Lower TimeFrame) or Ticks (Real-time ticks)
Res: Lower TimeFrame (only applicable when choosing LTF )
Option: choose " high/low " or " close " for Swing detection
🔹 ZigZag
Left: Lookback period for Swings
Right: Confirmation period after potential Swing
🔹 ZigZag Delta
Show % Bullish Volume : % bullish volume against total volume during the ZZ line
Show:
Average Volume Delta/bar
Average Volume/bar
Normalised Volume Delta
See USAGE for more information
🔹 Bar Data
Split Volume per bar: shows the sum of bullish ( upV ) and bearish ( dnV ) volume per bar
Volume (bar): Total Volume per bar (bullish + bearish volume, neutral volume not included)
Δ Volume (bar): Show Volume Delta (bullish - bearish volume)

Fourier Smoothed Hybrid Volume Spread AnalysisIndicator id:
USER;91bdff47320b4284a375f428f683b21e
(only relevant to those that use API requests)
MEANINGFUL DESCRIPTION:
The Fourier Smoothed Hybrid Volume Spread Analysis (FSHVSA) indicator is an innovative trading tool designed to fuse volume analysis with trend detection capabilities, offering traders a comprehensive view of market dynamics.
This indicator stands apart by integrating the principles of the Discrete Fourier Transform (DFT) and volume spread analysis, enhanced with a layer of Fourier smoothing to distill market noise and highlight trend directions with unprecedented clarity.
This smoothing process allows traders to discern the true underlying patterns in volume and price action, stripped of the distractions of short-term fluctuations and noise.
The core functionality of the FSHVSA revolves around the innovative combination of volume change analysis, spread determination (calculated from the open and close price difference), and the strategic use of the EMA (default 10) to fine-tune the analysis of spread by incorporating volume changes.
Trend direction is validated through a moving average (MA) of the histogram, which acts analogously to the Volume MA found in traditional volume indicators. This MA serves as a pivotal reference point, enabling traders to confidently engage with the market when the histogram's movement concurs with the trend direction, particularly when it crosses the Trend MA line, signalling optimal entry points.
It returns 0 when MA of the histogram and EMA of the Price Spread are not align.
HOW TO USE THE INDICATOR:
The FSHVSA plots a positive trend when a positive Volume smoothed Spread and EMA of Volume smoothed price is above 0, and a negative when negative Volume smoothed Spread and EMA of Volume smoothed price is below 0. When this conditions are not met it plots 0.
ORIGINALITY & USEFULNESS:
The FSHVSA is unique because it applies DFT for data smoothing, effectively filtering out the minor fluctuations and leaving traders with a clear picture of the market's true movements. The DFT's ability to break down market signals into constituent frequencies offers a granular view of market dynamics, highlighting the amplitude and phase of each frequency component. This, combined with the strategic application of Ehler's Universal Oscillator principles via a histogram, furnishes traders with a nuanced understanding of market volatility and noise levels, thereby facilitating more informed trading decisions.
DETAILED DESCRIPTION:
My detailed description of the indicator and use cases which I find very valuable.
What is the meaning of price spread?
In finance, a spread refers to the difference between two prices, rates, or yields. One of the most common types is the bid-ask spread, which refers to the gap between the bid (from buyers) and the ask (from sellers) prices of a security or asset.
We are going to use Open-Close spread.
What is Volume spread analysis?
Volume spread analysis (VSA) is a method of technical analysis that compares the volume per candle, range spread, and closing price to determine price direction.
What does this mean?
We need to have a positive Volume Price Spread and a positive Moving average of Volume price spread for a positive trend. OR via versa a negative Volume Price Spread and a negative Moving average of Volume price spread for a negative trend.
What if we have a positive Volume Price Spread and a negative Moving average of Volume Price Spread ?
It results in a neutral, not trending price action.
Thus the indicator returns 0.
In the next Image you can see that trend is negative on 4h, neutral on 12h and neutral on 1D. That means trend is negative .
I am sorry, the chart is a bit messy. The idea is to use the indicator over more than 1 Timeframe.
What is approximation and smoothing?
They are mathematical concepts for making a discrete set of numbers a
continuous curved line.
Fourier and Euler approximation of a spread are taken from aprox library.
Key Features:
Noise Reduction leverages Euler's White noise capabilities for effective Volume smoothing, providing a cleaner and more accurate representation of market dynamics.
Choose between the innovative Double Discrete Fourier Transform (DTF32) and Regular Open & Close price series.
Mathematical equations presented in Pinescript:
Fourier of the real (x axis) discrete:
x_0 = array.get(x, 0) + array.get(x, 1) + array.get(x, 2)
x_1 = array.get(x, 0) + array.get(x, 1) * math.cos( -2 * math.pi * _dir / 3 ) - array.get(y, 1) * math.sin( -2 * math.pi * _dir / 3 ) + array.get(x, 2) * math.cos( -4 * math.pi * _dir / 3 ) - array.get(y, 2) * math.sin( -4 * math.pi * _dir / 3 )
x_2 = array.get(x, 0) + array.get(x, 1) * math.cos( -4 * math.pi * _dir / 3 ) - array.get(y, 1) * math.sin( -4 * math.pi * _dir / 3 ) + array.get(x, 2) * math.cos( -8 * math.pi * _dir / 3 ) - array.get(y, 2) * math.sin( -8 * math.pi * _dir / 3 )
Fourier of the imaginary (y axis) discrete:
y_0 = array.get(x, 0) + array.get(x, 1) + array.get(x, 2)
y_1 = array.get(x, 0) + array.get(x, 1) * math.sin( -2 * math.pi * _dir / 3 ) + array.get(y, 1) * math.cos( -2 * math.pi * _dir / 3 ) + array.get(x, 2) * math.sin( -4 * math.pi * _dir / 3 ) + array.get(y, 2) * math.cos( -4 * math.pi * _dir / 3 )
y_2 = array.get(x, 0) + array.get(x, 1) * math.sin( -4 * math.pi * _dir / 3 ) + array.get(y, 1) * math.cos( -4 * math.pi * _dir / 3 ) + array.get(x, 2) * math.sin( -8 * math.pi * _dir / 3 ) + array.get(y, 2) * math.cos( -8 * math.pi * _dir / 3 )
Euler's Smooth with Discrete Furrier approximated Volume.
a = math.sqrt(2) * math.pi / _devided
b = math.cos(math.sqrt(2) * 180 / _devided)
c2 = 2 * math.pow(a, 2) * b
c3 = math.pow(a, 4)
c1 = 1 - 2 * math.pow(a, 2) * math.cos(b) + math.pow(a, 4)
filt := na(filt ) ? 0 : c1 * (w + nz(w )) / 2.0 + c2 * nz(filt ) + c3 * nz(filt )
Usecase:
First option:
Leverage the script to identify Bullish and Bearish trends, shown with green and red triangle.
Combine Different Timeframes to accurately determine market trend.
Second option:
Pull the data with API sockets to automate your trading journey.
plot(close, title="ClosePrice", display=display.status_line)
plot(open, title="OpenPrice", display=display.status_line)
plot(greencon ? 1 : redcon ? -1 : 0, title="position", display=display.status_line)
Use ClosePrice, OpenPrice and "position" titles to easily read and backtest your strategy utilising more than 1 Time Frame.
Indicator id:
USER;91bdff47320b4284a375f428f683b21e
(only relevant to those that use API requests)