% Volume (%V)Read about it in the book of Buff Pelz Dormeier "Investing with Volume Analysis: Identify, Follow, and Profit from Trends" .
Normalized volume ( %V ) is a concept that uses an average of volume to plot volume. The volume total for the current bar is divided by the average volume (over the last n bars) to form a ratio. This ratio is multiplied by 100 and plotted in the same way that traditional volume is plotted as vertical bars on the horizontal plane, which creates a normalized volume scale of 0 to 100 . This allows for easy interpretation of volume’s relative movements, with 50 being typical or average volume, numbers below 50 being light volume, and numbers above 50 being heavier volume.
Good luck!
Volumeanalytics


Real Volume BTCStudy based and adjusted in real Bitcoin volume. It shows important areas of great activity that will help you make better decisions.
This indicator also shows complete cycles of price action based on volume.
In combination with other indicators, it becomes a powerful tool.

Cumulative Weekdays VolumesHello traders!
This indicator shows you cumulative weekdays' volumes across the instrument history.
What is included
An option to start calculations from specific date
It works on ANY instrument that has available volume data.
It works on all resolutions
I attached some screenshots to show you how it works with other instruments.
Good luck and happy trading!

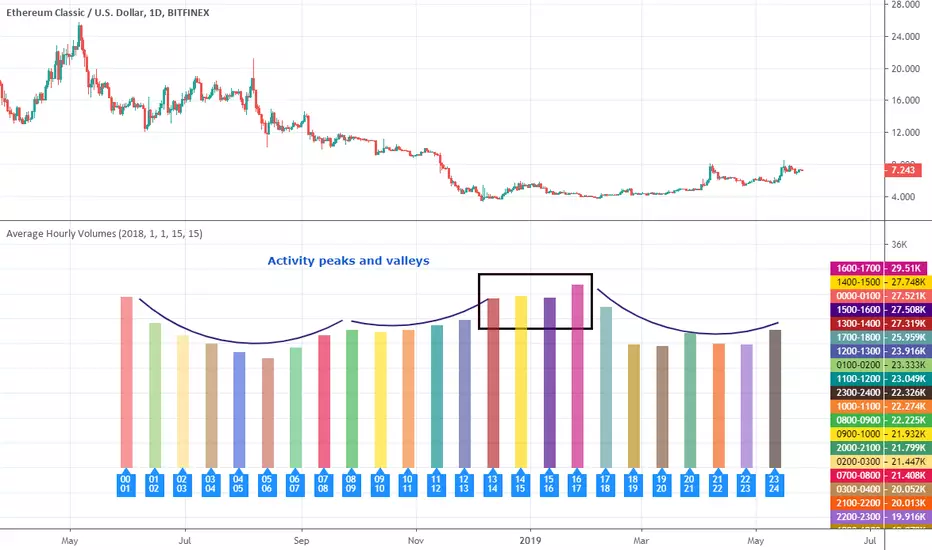
Average Hourly VolumesHello traders!
This indicator shows you the average hourly volumes across the instrument history.
It can help you to find time frames with the highest and the lowest activity of traders. Thus, you will know when to jump into the train and when to jump out.
What is included
An option to include/exclude weekends from calculation
An option to start calculations from specific date
An option to hide zero volumes
It works on ANY instrument that has available volume data.
It works on all resolutions
I attached some screenshots to show you how it works with other instruments.
Good luck and happy trading!
Cumulative Hourly VolumesHello traders!
This indicator shows you cumulative hourly volumes across the instrument history.
It can help you to find time frames with the highest and the lowest activity of traders. Thus, you will know when to jump into the train.
I attached some screenshots to show you how it works with other instruments.
Good luck and happy trading!

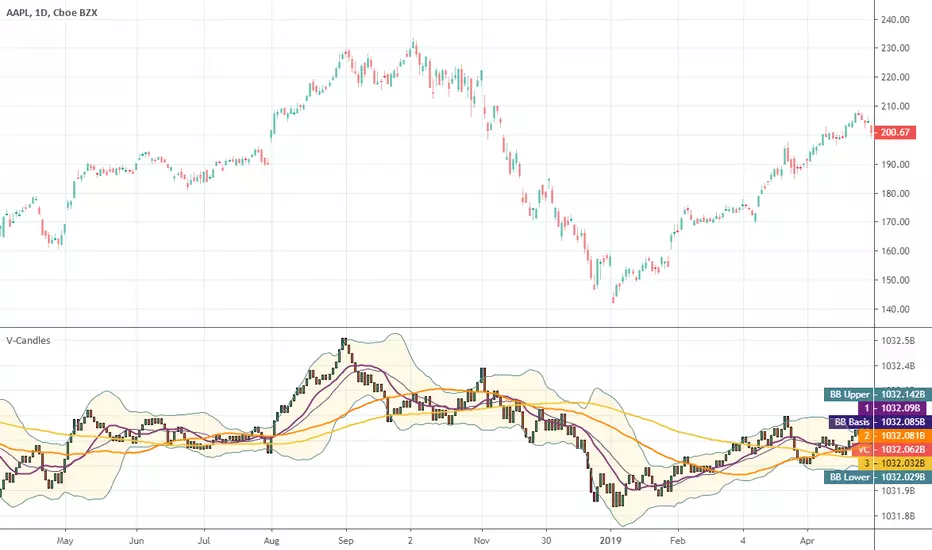
Volume CandlesHello traders!
Well, I was trying to implement EquiVolume Charts that were developed by Richard W. Arms, but unfortunately I got a poor result.
Instead, I used my groundwork on EquiVolumes to create Volume Candles indicator to help you make better, smarter trades.
What are the cool features?
Excellently filters the instrument's movements
Gives a better view of the accumulation/distribution phases
Completely removes price gaps
Works on ANY instrument that has available volume data.
Personally, I am a big fan of the volume-based indicators and to clarify my position I cite the following words of Buff Pelz Dormeier from his book "Investing with Volume Analysis: Identify, Follow, and Profit from Trends" :
A trade produces only two pieces of information: the price and price's neglected sibling, volume. Perhaps the least appreciated piece of the puzzle, volume represents fertile ground for technical analysis. Proficiency in volume analysis is a rare skill. Properly understood, though, volume analysis can provide its practitioner with the power to peer deeply into market mechanics.
Benjamin Graham, the father of value investing and a mentor of Warren Buffett, often called the market a 'voting machine'. If so, then volume is the ballot box. Volume is a literal illustration of the power behind the forces of supply and demand.
Volume is understood as the validation of price, the source of liquidity, the substantiation of information, the fulfillment of convictions, the revelation of divergent opinions, the fuel of the market, the proponent of truth, and the energy behind the velocity of money. If you believe any of this information might be important in making an investment decision, volume analysis is important to you.
I attached some screenshots to show you how it works with other instruments.
Happy Trading!
Negative Volume IndexHello traders!
This indicator was originally developed by Paul L. Dysart in the 1930s and then described and popularized by Norman G. Fosback in his book "Stock Market Logic: A Sophisticated Approach to Profits on Wall Street" .
Like and follow for more cool indicators!
Happy Trading!

Positive Volume IndexHello traders!
This indicator was originally developed by Paul L. Dysart in the 1930s and then described and popularized by Norman G. Fosback in his book "Stock Market Logic: A Sophisticated Approach to Profits on Wall Street"
Like and follow for more cool indicators!
Happy Trading!

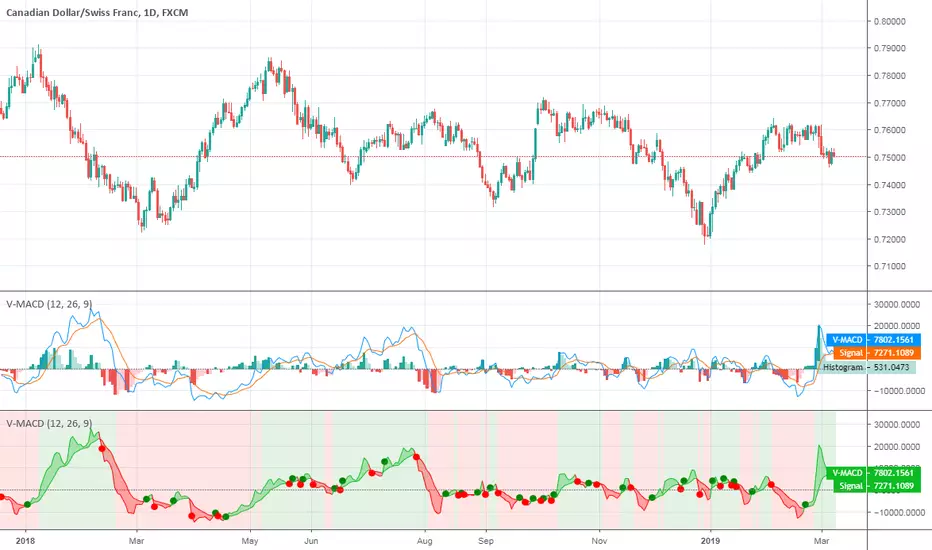
V-MACDHello traders!
This is a variation of classical MACD that uses volume instead of price.
Like and follow for more cool indicators!
Happy Trading!
Zcash/USD Total VolumesHello traders!
This tool shows you Zcash/USD total trade volumes from the all (well, almost) cryptocurrency exchanges on different timeframes.
Supported timeframes
"1"
"3"
"5"
"10"
"15"
"30"
"45"
"60" - 1 hour
"120" - 2 hours
"180" - 3 hours
"240" - 4 hours
"300" - 5 hours
"360" - 6 hours
"420" - 7 hours
"480" - 8 hours
"540" - 9 hours
"600" - 10 hours
"660" - 11 hours
"720" - 12 hours
"780" - 13 hours
"840" - 14 hours
"900" - 15 hours
"960" - 16 hours
"1020" - 17 hours
"1080" - 18 hours
"1140" - 19 hours
"1200" - 20 hours
"1260" - 21 hours
"1320" - 22 hours
"1380" - 23 hours
"D"
"2D"
"3D"
"W"
"M"
How to get access
Buy for only 20$ to get lifetime access to this indicator
Like and follow for more cool indicators!
Happy Trading!

Monero/USD Total VolumesHello traders!
This tool shows you Monero/USD total trade volumes from the all (well, almost) cryptocurrency exchanges on different timeframes.
Supported timeframes
"1"
"3"
"5"
"10"
"15"
"30"
"45"
"60" - 1 hour
"120" - 2 hours
"180" - 3 hours
"240" - 4 hours
"300" - 5 hours
"360" - 6 hours
"420" - 7 hours
"480" - 8 hours
"540" - 9 hours
"600" - 10 hours
"660" - 11 hours
"720" - 12 hours
"780" - 13 hours
"840" - 14 hours
"900" - 15 hours
"960" - 16 hours
"1020" - 17 hours
"1080" - 18 hours
"1140" - 19 hours
"1200" - 20 hours
"1260" - 21 hours
"1320" - 22 hours
"1380" - 23 hours
"D"
"2D"
"3D"
"W"
"M"
How to get access
Buy for only 20$ to get lifetime access to this indicator
Like and follow for more cool indicators!
Happy Trading!

Litecoin/USD Total VolumesHello traders!
This tool shows you Litecoin/USD total trade volumes from the all (well, almost) cryptocurrency exchanges on different timeframes.
Alerts included.
Supported timeframes
"1"
"3"
"5"
"10"
"15"
"30"
"45"
"60" - 1 hour
"120" - 2 hours
"180" - 3 hours
"240" - 4 hours
"300" - 5 hours
"360" - 6 hours
"420" - 7 hours
"480" - 8 hours
"540" - 9 hours
"600" - 10 hours
"660" - 11 hours
"720" - 12 hours
"780" - 13 hours
"840" - 14 hours
"900" - 15 hours
"960" - 16 hours
"1020" - 17 hours
"1080" - 18 hours
"1140" - 19 hours
"1200" - 20 hours
"1260" - 21 hours
"1320" - 22 hours
"1380" - 23 hours
"D"
"2D"
"3D"
"W"
"M"
How to get access
Buy for only 25$ to get lifetime access to this indicator
Like and follow for more cool indicators!
Happy Trading!

Stellar/USD Total VolumesHello traders!
This tool shows you Stellar/USD total trade volumes from the all (well, almost) cryptocurrency exchanges on different timeframes.
Alerts included.
Supported timeframes
"1"
"3"
"5"
"10"
"15"
"30"
"45"
"60" - 1 hour
"120" - 2 hours
"180" - 3 hours
"240" - 4 hours
"300" - 5 hours
"360" - 6 hours
"420" - 7 hours
"480" - 8 hours
"540" - 9 hours
"600" - 10 hours
"660" - 11 hours
"720" - 12 hours
"780" - 13 hours
"840" - 14 hours
"900" - 15 hours
"960" - 16 hours
"1020" - 17 hours
"1080" - 18 hours
"1140" - 19 hours
"1200" - 20 hours
"1260" - 21 hours
"1320" - 22 hours
"1380" - 23 hours
"D"
"2D"
"3D"
"W"
"M"
How to get access
Buy for only 20$ to get lifetime access to this indicator
Like and follow for more cool indicators!
Happy Trading!

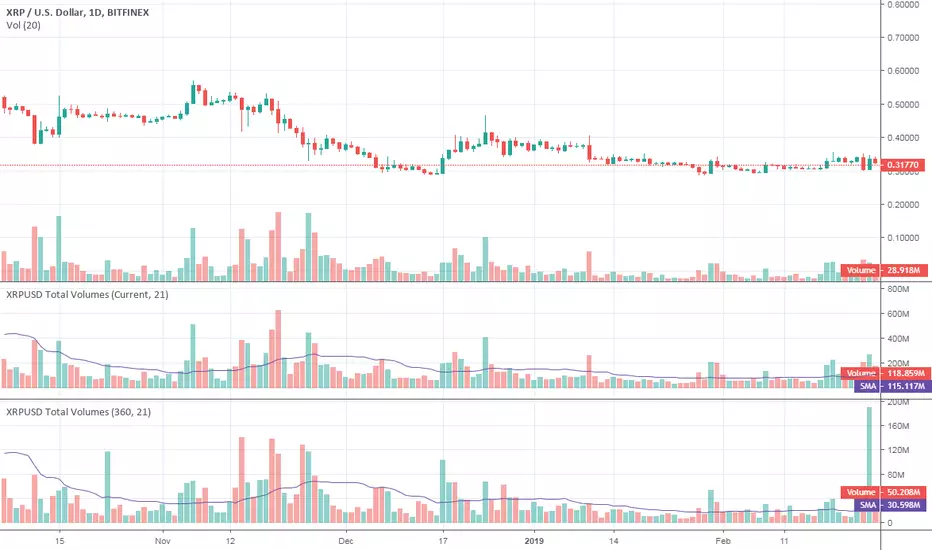
Ripple/USD Total VolumesHello traders!
This tool shows you Ripple/USD total trade volumes from the all (well, almost) cryptocurrency exchanges on different timeframes.
Supported timeframes
"1"
"3"
"5"
"10"
"15"
"30"
"45"
"60" - 1 hour
"120" - 2 hours
"180" - 3 hours
"240" - 4 hours
"300" - 5 hours
"360" - 6 hours
"420" - 7 hours
"480" - 8 hours
"540" - 9 hours
"600" - 10 hours
"660" - 11 hours
"720" - 12 hours
"780" - 13 hours
"840" - 14 hours
"900" - 15 hours
"960" - 16 hours
"1020" - 17 hours
"1080" - 18 hours
"1140" - 19 hours
"1200" - 20 hours
"1260" - 21 hours
"1320" - 22 hours
"1380" - 23 hours
"D"
"2D"
"3D"
"W"
"M"
How to get access
Buy for only 20$ to get lifetime access to this indicator
Like and follow for more cool indicators!
Happy Trading!
ETHUSD Total VolumesHello traders!
This tool shows you ETHUSD total trade volumes from the all (well, almost) cryptocurrency exchanges on different timeframes.
Supported timeframes
"1"
"3"
"5"
"10"
"15"
"30"
"45"
"60" - 1 hour
"120" - 2 hours
"180" - 3 hours
"240" - 4 hours
"300" - 5 hours
"360" - 6 hours
"420" - 7 hours
"480" - 8 hours
"540" - 9 hours
"600" - 10 hours
"660" - 11 hours
"720" - 12 hours
"780" - 13 hours
"840" - 14 hours
"900" - 15 hours
"960" - 16 hours
"1020" - 17 hours
"1080" - 18 hours
"1140" - 19 hours
"1200" - 20 hours
"1260" - 21 hours
"1320" - 22 hours
"1380" - 23 hours
"D"
"2D"
"3D"
"W"
"M"
How to get access
Buy for only 25$ to get lifetime access to this indicator
Like and follow for more cool indicators!
Happy Trading!

BTCUSD Total VolumesHello traders!
This tool shows you BTCUSD total trade volumes from the all (well, almost) cryptocurrency exchanges on different timeframes.
Supported timeframes
"1"
"3"
"5"
"10"
"15"
"30"
"45"
"60" - 1 hour
"120" - 2 hours
"180" - 3 hours
"240" - 4 hours
"300" - 5 hours
"360" - 6 hours
"420" - 7 hours
"480" - 8 hours
"540" - 9 hours
"600" - 10 hours
"660" - 11 hours
"720" - 12 hours
"780" - 13 hours
"840" - 14 hours
"900" - 15 hours
"960" - 16 hours
"1020" - 17 hours
"1080" - 18 hours
"1140" - 19 hours
"1200" - 20 hours
"1260" - 21 hours
"1320" - 22 hours
"1380" - 23 hours
"D"
"2D"
"3D"
"W"
"M"
How to get access
Buy for only 25$ to get lifetime access to this indicator
Like and follow for more cool indicators!
Happy Trading !

On Balance VolumeThis indicator was originally described by Joseph E. Granville in his book "Granville's New Key To Stock Market Profits" (1963).


Universal Longs Vs. Shorts - Ratio (Any Symbol)Hello again all my Trading View friends!
This script is a variation of my other script "Universal Longs Vs. Shorts - Percentage (Any Symbol)"
It allows you to choose ANY symbol and plot the ratio against ANY other symbol, as an indicator on your given pair. It is primarily used as an indicator of longs/shorts as well as shorts/longs as a ratio to each other.
For example, you could plot BITFINEX:BTCUSDLONGS against BITFINEX:BTCUSDSHORTS.
It plots the ratio of longs/shorts or shorts/longs. For example:
If there are more longs than shorts open, the long ratio will be great than 1 with no upper limit.
If there are less longs than shorts open, the ratio will be less than 1 but greater than 0.
The same is true when comparing shorts to longs. You can choose to view Longs Ratio only, Shorts Ratio only, or Both.
This is useful to see how many more longs there are than shorts, and visa versa, at any given time interval. It does not take into consideration total volume of longs + shorts to get an absolute number, but rather a relative ratio to each other.
If there are many more positions open in one direction over the other, the ratio will rise higher and higher away from 1, which lets you know generally that there is a lot greater volume of that position open compared to its reverse.
If you found this script helpful please remember to FOLLOW and press LIKE!!
More useful scripts to come :-D

Universal Longs Vs. Shorts - Percentage (Any Symbol)Hello all my Trading View friends!!
This script allows you to choose ANY symbol and plot the ratio against ANY other symbol, as an indicator on your given pair. It is primarily used as an indicator of longs/shorts as well as shorts/longs as a percentage of total longs + shorts.
For example, you could plot BITFINEX:BTCUSDLONGS against BITFINEX:BTCUSDSHORTS.
It takes the ratio from an absolute 100%, rather than relative to each other. Therefore, each plot has a minimum of 0% and a maximum of 100%. You can choose to view Longs Percentage only, Shorts Percentage only, or Both.
This is useful to see what percentage of total positions are either long or short at any given time interval.
If you found this script helpful please remember to FOLLOW and press LIKE!!

Volume BreakoutsThe aim of this indicator is to indicate effective volume breakouts.
Blue = Volume is at least 25% above the 20d moving average
Purple = Volume is at least twice as much as the 20d moving average
Red = Volume is at least three times the average
My recommendation : Always watch for breakouts on large volume. That's a sign that big institutions are buying.
