VOL & AVG OverlayCustom Session Volume Versus Average Volume
Description:
This indicator will create an overlay on your chart that will show you the following information:
Custom Session Volume
Average For Selected Session
Percentage Comparison
Options:
Set Custom Time Frame For Calculations
Set Custom Time Frame For Average Comparison
Set Custom Time Zone
Enable / Disable Each Value
Change Text Color
Change Background Color
Change Table location
Example:
Set indicator to 30 period average. Set custom time frame to 9:30am to 10:30am Eastern/New York.
When the time frame for the calculation is closed , the indicator will provide a comparison of the current days volume compared to the average of 30 previous days for that same time frame and display it as a percentage in the table.
In this example you could compare how the first hour of the trading day compares to the previous 30 day's average, aiding in evaluating the potential volume for the remainder of the day.
Notes:
Times must be entered in 24 hour format. (1pm = 13:00 etc.)
This indicator is for Intra-day time frames, not > Day.
If you prefer data in this format as opposed to a plotted line, check out my other indicator: ADR & ATR Overlay
VOLUMEBREAKOUT

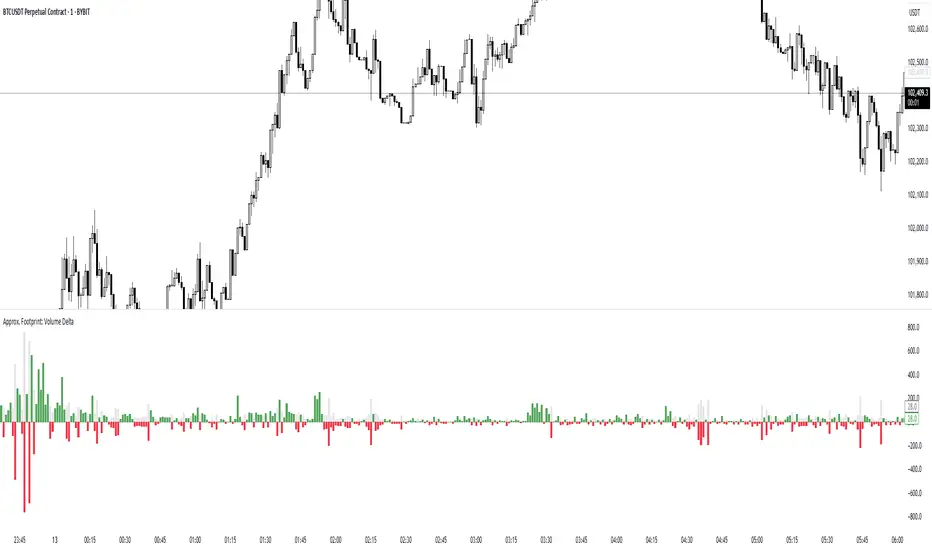
Approx. Footprint: Volume DeltaThis indicator brings you a simplified “footprint” view by charting the volume delta—the imbalance between bullish and bearish volume—alongside total bar volume.
Delta Bars: Green/red columns show where buyers (close > open) or sellers (close < open) dominated each bar.
Total Volume: Semi-transparent gray columns in the background give you overall context.
No Hidden Data: Works on any symbol/timeframe without tick-by-tick or bid/ask feeds.
Use it to quickly spot bars with strong buying or selling pressure, identify momentum shifts, and confirm breakouts or reversals—all within TradingView’s standard volume streams.
Volume Sentiment Pro (NTY88)Volume Sentiment Edge: Smart Volume & RSI Trading System
Description:
Unlock the power of volume-driven market psychology combined with precision RSI analysis! This professional-grade indicator identifies high-probability trading opportunities through:
🔥 Key Features
1. Smart Volume Spike Detection
Auto-detects abnormal volume activity with adaptive threshold
Clear spike labels & multi-timeframe confirmation
RSI-Powered Sentiment Analysis
Real-time Bullish/Bearish signals based on RSI extremes
Combined volume-RSI scoring system (Strong Bull/Bear alerts)
2. Professional Dashboard
Instant sentiment status table (bottom-right)
Color-coded momentum strength visualization
Customizable themes for all chart styles
3. Institutional-Grade Tools
HTF (Daily/Weekly) volume confirmation
EMA trend-filtered momentum signals
Spike-to-Threshold ratio monitoring
4. Trade-Ready Alerts
Pre-configured "Bullish Setup" (Spike + Oversold RSI)
"Bearish Setup" (Spike + Overbought RSI)
Why Traders Love This:
✅ Real-Time Visual Alerts - SPIKE markers above bars + table updates
✅ Adaptive Thresholds - Self-adjusting to market volatility
✅ Multi-Timeframe Verification - Avoid false signals with HTF confirmation
✅ Customizable UI - 10+ color settings for perfect chart integration
Usage Scenarios:
Day Traders: Catch volume surges during key sessions
Swing Traders: Confirm reversals with RSI extremes
All Markets: Works equally well on stocks, forex & crypto
Confirmation Tool: Combine with your existing strategy
Sample Setup:
"Enter long when:
5. RED SPIKE label appears
Table shows 'Oversold RSI'
Momentum status turns 'Bullish'
Volume exceeds daily average (Confirmed)"
📈 Try Risk-Free Today!
Perfect for traders who want:
Clean, non-repainting signals
Institutional-level volume analysis
Professional visual feedback
Customizable trading rules
⚠️ Important: Works best on 15m-4h timeframes. Combine with price action for maximum effectiveness.
📜 Legal Disclaimer
By using this indicator, you agree to the following terms:
Not Financial Advice
This tool provides technical analysis only. It does NOT constitute investment advice, financial guidance, or solicitation to trade.
High Risk Warning
Trading financial instruments carries substantial risk. Past performance ≠ future results. Never risk capital you cannot afford to lose.
No Guarantees
Signals are based on historical data and mathematical models. Market conditions may change rapidly, rendering previous patterns ineffective.
User Responsibility
You alone bear 100% responsibility for trading decisions. We expressly disclaim liability for any profit/loss resulting from this tool's use.
Professional Consultation
Always consult a licensed financial advisor before taking positions. This tool should NEVER be used as sole decision-making criteria.
Educational Purpose
This indicator is provided "as is" for informational/educational use only. No representation is made about its accuracy or completeness.
Third-Party Data
We do not verify exchange data accuracy. Use signals at your own discretion after independent verification.

Vacuum Candles [XrayAlgo]The Vacuum Candles indicator helps traders identify inefficient price movements—where the price moves significantly but lacks sufficient volume to support it. These inefficiencies may signal weak trends, potential reversals, or false breakouts/breakdowns.
Inefficient candles are visually marked with a darker / black body to indicate when the price movement is disproportionate to the volume.
1. Spotting Potential Reversals
When the indicator marks an inefficient candle, it signals that the price movement may be unsustainable.
In an uptrend: A inefficient bullish candle suggests that the uptrend is losing momentum, potentially leading to a downward reversal.
In a downtrend: A inefficient bearish candle signals that the downtrend may be weakening, with a potential bullish reversal.
2. Identifying Breakout and Breakdown Failures
This indicator is useful for recognizing false breakouts or false breakdowns.
If price breaks resistance but the candle is inefficient, the breakout may be weak and could fail quickly.
If price breaks support with an inefficient bearish candle, the breakdown could be a false signal, with price reverting back above support.
3. Recognizing Weak Trends
Inefficient candles help you spot when a trend is losing strength and could soon reverse or consolidate.
In an uptrend: A series of dark body bullish candles suggests that the uptrend may be weakening, signaling a potential correction or trend reversal.
In a downtrend: A series of dark body bearish candles suggests that the selling pressure is weakening, indicating a potential bullish reversal.
4. Fine-Tuning Entries and Exits
Inefficient candles offer an opportunity to fine-tune your entries and exits based on weak price moves.
Entering a trade: An inefficient candle near key support or resistance can indicate a reversal, making it a good entry point for a counter-trend position.
Exiting a trade: If you're already in a trend, and an inefficient candle appears, it suggests the trend is losing strength, indicating it may be a good time to exit before a potential reversal.
5. Fine-Tuning with Inputs
The Vacuum Candles indicator includes two key inputs:
Length: The number of candles used to calculate the average price movement and volume. A longer length (e.g., 20-30) smooths out the inefficiencies, while a shorter length (e.g., 10-15) makes the indicator more sensitive to recent price moves.
Multiplier: Controls the threshold for what is considered an inefficient candle:
A higher Multiplier (e.g., 1.5–3) filters out smaller inefficiencies and focuses on large discrepancies.
A lower Multiplier (e.g., 0.1–0.9) captures even smaller inefficiencies in highly efficient markets.

VPSRVP Sovereign Reign (VPSR) - Advanced Volume Profile Analysis
A sophisticated volume analysis tool that provides deep insights into market participation and momentum through an intuitive visual interface. This indicator helps traders identify significant market moves, potential reversals, and institutional activity.
Key Features:
1. Smart Volume Analysis
• Dynamic volume profiling
• Institutional participation detection
• Abnormal volume identification
• Real-time momentum tracking
2. Advanced Visual System
• Color-coded volume bars
• Adaptive cloud formation
• Reversal pattern detection
• Fake-out warning system
Visual Components:
1. Volume Bars
• Green: Bullish pressure with normal volume
• Purple: Bearish pressure with normal volume
• White: Significant bullish participation
• Pink: Significant bearish participation
• Orange: High-probability reversal zones
2. Dynamic Cloud
• White Cloud: Bullish control zone
• Purple Cloud: Bearish control zone
• Cloud density indicates participation strength
• Adaptive to market conditions
Signal Interpretation:
1. Normal Market Conditions
• Green/Purple bars show directional pressure
• Cloud color indicates dominant force
• Cloud height shows average participation
2. Significant Events
• White/Pink bars signal major moves
• Orange bars highlight potential reversals
• Cloud expansion shows increasing activity
• Cloud contraction indicates consolidation
Customization Options:
• Volume MA Length: Smoothing factor
• Abnormal Volume Threshold: Sensitivity
• Cloud Display: Toggle visualization
• Color scheme optimization
Best Practices:
1. Multiple Timeframe Analysis
• Start with higher timeframes
• Confirm on lower timeframes
• Watch for confluence
2. Volume Analysis
• Compare to historical levels
• Monitor abnormal spikes
• Track participation trends
3. Trade Management
• Use as confirmation tool
• Wait for clear signals
• Monitor fake-out warnings
• Combine with price action
Trading Applications:
1. Trend Analysis
• Identify strong moves
• Spot weakening trends
• Detect consolidation
2. Reversal Detection
• Spot potential turning points
• Identify fake-outs
• Monitor institutional activity
3. Risk Management
• Volume-based position sizing
• Stop loss placement
• Profit target selection
The VP Sovereign Reign indicator excels at:
• Identifying significant market moves
• Detecting institutional participation
• Warning of potential reversals
• Highlighting fake-outs
• Providing clear market context
Risk Warning:
This indicator is designed as a technical analysis tool and should be used as part of a complete trading strategy. Past performance does not guarantee future results. Always employ proper risk management techniques.
Note: For optimal results, use in conjunction with price action analysis and other complementary indicators.

Premarket VolumeTimeframe: Use on intraday charts (e.g., 1-minute, 5-minute) with extended hours enabled.
Behavior: The plot will appear at 4:00 AM, grow as volume accumulates, and disappear at 9:30 AM each day.
Range Breakout Signals [AlgoAlpha]OVERVIEW
This script detects range-bound market conditions and breakout signals using a combination of volatility compression and volume imbalance analysis. It identifies zones where price consolidates within a defined range and highlights potential breakout points with visual markers. Traders can use this to spot market transitions from ranging to trending phases, aiding in decision-making for breakout strategies.
CONCEPTS
The script measures volatility by comparing the ratio of the simple moving average (SMA) of price movements to their median value. When volatility drops below a threshold, the script assumes a range-bound market. It then tracks the cumulative volume of buying and selling pressure to assess breakout strength. The approach is based on the idea that market consolidation often precedes strong moves, and volume distribution can provide clues on the breakout direction.
FEATURES
Range Detection : Uses a volatility filter to identify low-volatility zones and marks them on the chart with shaded boxes.
Volume Imbalance Analysis : Evaluates cumulative up and down volume over a confirmation period to assess directional bias.
Breakout Signals : When price exits a detected range, the script plots breakout markers. A ▲ symbol indicates a bullish breakout, and a ▼ symbol indicates a bearish breakout. Additional "+" markers indicate strong volume imbalance favoring the breakout direction.
Adaptive Timeframe Volume Analysis : The script dynamically adjusts its volume calculation based on the chart’s timeframe, ensuring reliable signal generation across different trading conditions.
Alerts : Notifies traders when a new range is detected or when a breakout occurs, allowing for automated monitoring.
USAGE
Traders can use this script to identify potential trade setups by entering positions when price breaks out of a detected range. For breakout confirmation, traders can look at volume imbalance cues—bullish breakouts with strong buying volume may indicate sustained moves, while weak volume breakouts may lead to false signals. This script is particularly useful for breakout traders, range traders seeking to fade breakouts, and those looking to automate trade alerts in volatile markets.

Breakout and Retest Signals [AlgoAlpha]OVERVIEW
This script detects breakout and retest signals by identifying key pivot points in price action and analyzing their relationship with historical swing highs and lows. It highlights breakout structures using ATR-based tolerance levels and volume analysis to confirm potential trend continuations or reversals. The script marks significant price levels with dynamic boxes and dashed lines to help traders visualize breakout and retest areas effectively.
CONCEPTS
The script relies on pivot point analysis, a technique used to identify significant price levels where the market has previously reversed. It dynamically tracks a set number of recent swing highs and lows, allowing traders to see if the price is revisiting a previously significant level. The concept of breakouts and retests is widely used in technical analysis to determine potential entry points. A breakout occurs when the price moves beyond a resistance or support level, and a retest happens when the price returns to test that level before continuing in the breakout direction. This script enhances that analysis by incorporating ATR-based tolerance levels, ensuring that price zones are not too large.
FEATURES
Breakout and Retest Markings : Highlights breakout and retest areas with shaded boxes, allowing traders to visualize where price action is confirming key levels.
Volume Delta and Ratio : Analyzes volume at breakout levels to gauge the strength of the move, displaying volume delta information for additional context. The script also displays the ratio of selling to buying at the retest along traders to make better judgement on their entries.
Multi-Timeframe Adaptability : Dynamically adjusts volume analysis to align with the appropriate lower timeframe, ensuring reliable volume comparisons.
Alerts for Breakout and Retest Events : Traders can receive real-time notifications when bullish or bearish breakout retests are detected.
USAGE
This script is best suited for traders looking to identify strong breakout and retest setups across different timeframes. Users can customize the pivot detection period and swing point memory to adjust sensitivity based on their trading style. The ATR length and multiplier allow further refinement of breakout tolerance, reducing noise in volatile markets. The breakout zones are displayed as shaded boxes, where traders can assess whether a price retest is occurring under favorable conditions. Alerts can be set to notify traders of potential trade opportunities.

Volatility-Volume Index (VVI)Volatility-Volume Index (VVI) – Indicator Description
The Volatility-Volume Index (VVI) is a custom trading indicator designed to identify market consolidation and anticipate breakouts by combining volatility (ATR) and trading volume into a single metric.
How It Works
Measures Volatility : Uses a 14-period Average True Range (ATR) to gauge price movement intensity.
Tracks Volume : Monitors trading activity to identify accumulation or distribution phases.
Normalization : ATR and volume are normalized using their respective 20-period Simple Moving Averages (SMA) for a balanced comparison.
Interpretation
VVI < 1: Low volatility and volume → Consolidation phase (range-bound market).
VVI > 1: Increased volatility and/or volume → Potential breakout or trend continuation.
How to Use VVI
Detect Consolidation:
Look for extended periods where VVI remains below 1.
Confirm with sideways price movement in a narrow range.
Anticipate Breakouts:
A spike above 1 signals a possible trend shift or breakout.
Why Use VVI?
Unlike traditional volatility indicators (ATR, Bollinger Bands) or volume-based tools (VWAP), VVI combines both elements to provide a clearer picture of consolidation zones and breakout potential.

AI Volume Breakout for scalpingPurpose of the Indicator
This script is designed for trading, specifically for scalping, which involves making numerous trades within a very short time frame to take advantage of small price movements. The indicator looks for volume breakouts, which are moments when trading volume significantly increases, potentially signaling the start of a new price movement.
Key Components:
Parameters:
Volume Threshold (volumeThreshold): Determines how much volume must increase from one bar to the next for it to be considered significant. Set at 4.0, meaning volume must quadruplicate for a breakout signal.
Price Change Threshold (priceChangeThreshold): Defines the minimum price change required for a breakout signal. Here, it's 1.5% of the bar's opening price.
SMA Length (smaLength): The period for the Simple Moving Average, which helps confirm the trend direction. Here, it's set to 20.
Cooldown Period (cooldownPeriod): Prevents signals from being too close together, set to 10 bars.
ATR Period (atrPeriod): The period for calculating Average True Range (ATR), used to measure market volatility.
Volatility Threshold (volatilityThreshold): If ATR divided by the close price exceeds this, the market is considered too volatile for trading according to this strategy.
Calculations:
SMA (Simple Moving Average): Used for trend confirmation. A bullish signal is more likely if the price is above this average.
ATR (Average True Range): Measures market volatility. Lower volatility (below the threshold) is preferred for this strategy.
Signal Generation:
The indicator checks if:
Volume has increased significantly (volumeDelta > 0 and volume / volume >= volumeThreshold).
There's enough price change (math.abs(priceDelta / open) >= priceChangeThreshold).
The market isn't too volatile (lowVolatility).
The trend supports the direction of the price change (trendUp for bullish, trendDown for bearish).
If all these conditions are met, it predicts:
1 (Bullish) if conditions suggest buying.
0 (Bearish) if conditions suggest selling.
Cooldown Mechanism:
After a signal, the script waits for a number of bars (cooldownPeriod) before considering another signal to avoid over-trading.
Visual Feedback:
Labels are placed on the chart:
Green label for bullish breakouts below the low price.
Red label for bearish breakouts above the high price.
How to Use:
Entry Points: Look for the labels on your chart to decide when to enter trades.
Risk Management: Since this is for scalping, ensure each trade has tight stop-losses to manage risk due to the quick, small movements.
Market Conditions: This strategy might work best in markets with consistent volume and price changes but not extreme volatility.
Caveats:
This isn't real AI; it's a heuristic based on volume and price. Actual AI would involve machine learning algorithms trained on historical data.
Always backtest any strategy, and consider how it behaves in different market conditions, not just the ones it was designed for.

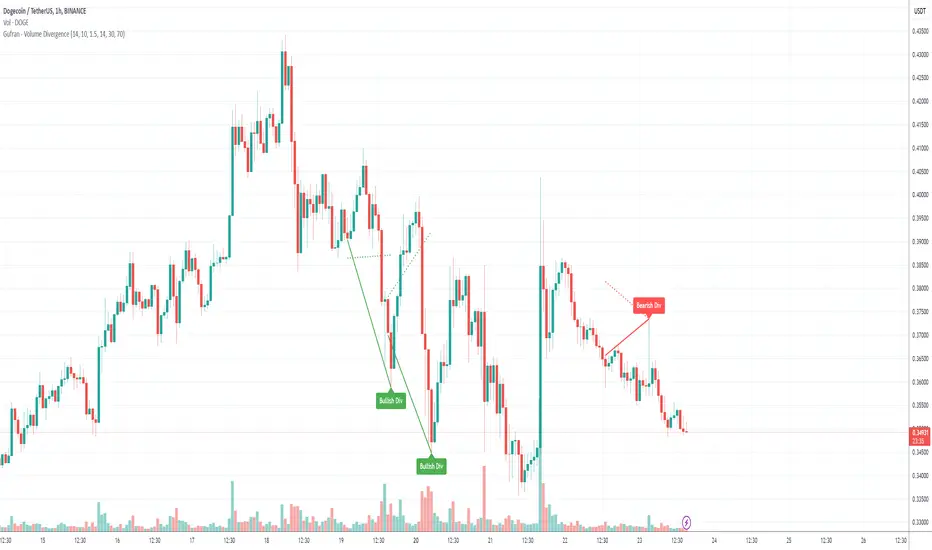
Gufran - Volume DivergenceThis indicator detects bullish and bearish divergences by analyzing price action, volume trends, and RSI (Relative Strength Index) for added confirmation. It highlights key market reversals or trend continuations by identifying when price movement diverges from volume dynamics, providing traders with actionable insights for entry and exit points.
Key Features:
Divergence Detection:
Bullish Divergence: Price makes a lower low, but volume shows higher lows, signaling potential upward reversals.
Bearish Divergence: Price makes a higher high, but volume shows lower highs, signaling potential downward reversals.
RSI Confirmation:
Bullish Signals: Confirmed when RSI is in the oversold zone.
Bearish Signals: Confirmed when RSI is in the overbought zone (optional relaxation of RSI conditions available).
Normalized Volume Analysis:
Volume is scaled to the price range, ensuring clear and meaningful visualization alongside price action.
Customizable Parameters:
Lookback Period: Define how far back the script looks to identify divergences.
Volume Significance: Adjust the threshold for significant volume movements.
RSI Levels: Fine-tune overbought and oversold thresholds for optimal signal accuracy.
Gap Control: Avoid clutter by setting a minimum number of candles between successive divergence signals.
Clear Visual Representation:
Bullish Divergence: Marked with green labels and connecting lines.
Bearish Divergence: Marked with red labels and connecting lines.
Dotted lines show normalized volume divergence, while solid lines indicate price divergence.
Ideal For:
Traders who rely on volume dynamics to validate price movements.
Those looking for an added layer of confidence using RSI to filter false signals.
Swing and intraday traders aiming to identify market reversal zones or continuation patterns.
Customization Options:
Lookback Period: Adjustable range for detecting highs and lows.
Volume Threshold: Define the multiplier for significant volume changes.
RSI Settings: Tailor overbought/oversold levels to suit your trading style.
Relax RSI Condition: Toggle stricter or more flexible conditions for bearish divergences.
How to Use:
Add the indicator to your chart and configure the parameters to fit the asset and timeframe you are trading.
Look for:
Green “Bullish Div” labels near price lows for potential buying opportunities.
Red “Bearish Div” labels near price highs for potential selling opportunities.
Use this indicator in combination with other tools like support/resistance levels, trendlines, or moving averages for a comprehensive trading strategy.
Disclaimer:
This indicator is a tool for educational purposes and should not be used as a standalone trading signal. Always conduct proper risk management and consider additional technical/fundamental analysis before making trading decisions.
Relative Volume Index [PhenLabs]Relative Volume Index (RVI)
Version: PineScript™ v6
Description
The Relative Volume Index (RVI) is a sophisticated volume analysis indicator that compares real-time trading volume against historical averages for specific time periods. By analyzing volume patterns and statistical deviations, it helps traders identify unusual market activity and potential trading opportunities. The indicator uses dynamic color visualization and statistical overlays to provide clear, actionable volume analysis.
Components
• Volume Comparison: Real-time volume relative to historical averages
• Statistical Bands: Upper and lower deviation bands showing volume volatility
• Moving Average Line: Smoothed trend of relative volume
• Color Gradient Display: Visual representation of volume strength
• Statistics Dashboard: Real-time metrics and calculations
Usage Guidelines
Volume Strength Analysis:
• Values > 1.0 indicate above-average volume
• Values < 1.0 indicate below-average volume
• Watch for readings above the threshold (default 6.5x) for exceptional volume
Trading Signals:
• Strong volume confirms price moves
• Divergences between price and volume suggest potential reversals
• Use extreme readings as potential reversal signals
Optimal Settings:
• Start with default 15-bar lookback for general analysis
• Adjust threshold (6.5x) based on market volatility
• Use with multiple timeframes for confirmation
Best Practices:
• Combine with price action and other indicators
• Monitor deviation bands for volatility expansion
• Use the statistics panel for precise readings
• Pay attention to color gradients for quick assessment
Limitations
• Requires quality volume data for accurate calculations
• May produce false signals during pre/post market hours
• Historical comparisons may be skewed during unusual market conditions
• Best suited for liquid markets with consistent volume patterns
Note: For optimal results, use in conjunction with price action analysis and other technical indicators. The indicator performs best during regular market hours on liquid instruments.

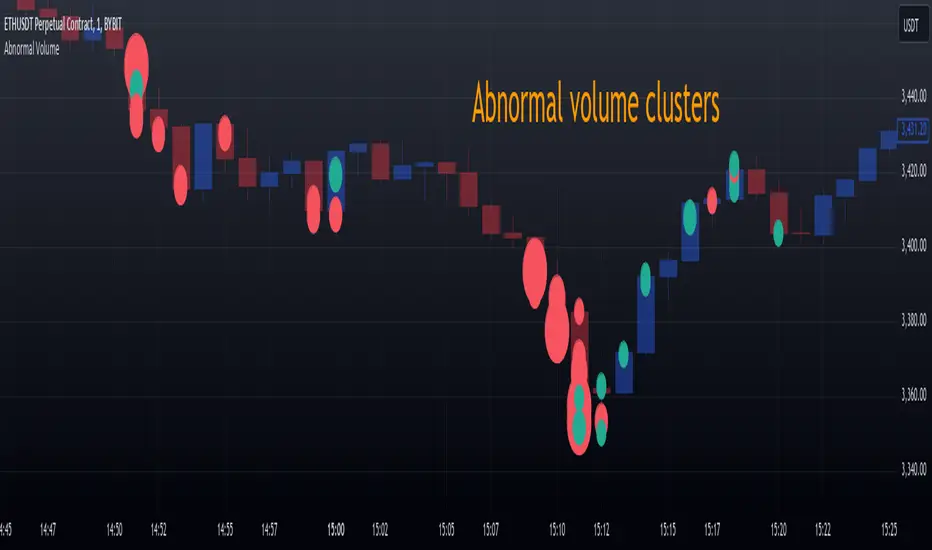
Abnormal volume [VG]🪙 INTRODUCTION
This technical indicator helps identify and highlight large volume clusters on the chart.
Abnormal volume refers to unusually large accumulations of volume over short time intervals. Such clusters appear when the amount of assets bought or sold significantly exceeds typical volumes for a specific asset over a given period. These patterns can indicate significant events or intentions of market participants.
Reasons for abnormal volume clusters:
Institutional investments :
Large investment funds and banks may buy or sell significant volumes of assets to rebalance their portfolios.
Impact of news and events :
Important news (e.g., mergers, bankruptcies, management changes) can trigger large-scale buying or selling of assets.
Market manipulation :
Big players may execute large trades to artificially create demand or supply for an asset, affecting its price in the short term.
Insider trading :
Abnormal volumes may signal that someone with insider information has started buying or selling assets in anticipation of future events that could impact the price.
What do abnormal volume clusters mean for traders?
A signal of potential price changes :
High trading volumes are often accompanied by sharp price movements. An increase in volume during price growth might indicate rising interest in the asset, while an increase during a decline could signal a sell-off.
Potential entry or exit points :
For short-term traders, abnormal trades can serve as signals to enter or exit positions. For example, a large volume growth accompanied by a breakout of a key level might be seen as a buy signal.
Caution due to potential manipulation :
Abnormal trades don’t always lead to expected outcomes. Sometimes, they are part of a price manipulation strategy, so it’s essential to consider the broader context and confirm with other signals.
🪙 USAGE
This indicator doesn’t provide trading signals, entry points, or actionable recommendations.
Instead, it simplifies tracking market dynamics and highlights unusual activity worth considering during analysis.
After adding the indicator to the chart, you only need to configure two parameters: the threshold value that determines what constitutes a significant volume cluster and the period over which volumes are aggregated for comparison against the threshold.
It’s recommended to use the shortest available period, as this helps more precisely identify the prevailing volume direction (since this depends on price changes, not trade direction).
The threshold value can be fine-tuned by switching the chart’s timeframe to match the selected period, observing of the significant volume increase on the classic volume histogram, and noting the corresponding market reactions. This allows for selecting a threshold that highlights early signs of impactful trading events on higher timeframes.
Let’s look at an example in the screenshot:
Once the parameters are set, you can also enable an alert to trigger whenever a new volume cluster appears, simplifying event tracking.
Note: in the current version of the indicator, the alert will be triggered only once per bar on the chart at the first detected cluster of abnormal volume.
🪙 IMPLEMENTATION
Technically, the script retrieves volume data from a lower timeframe and estimates whether the volume was primarily generated by buyers or sellers based on price movements.
The lower resolution timeframe is determined as follows:
if the settings base period is less than 1 minute, then the data timeframe will be equal to 1 second
if the settings base period is equals 1 minute or more, then the data timeframe will be equal to 1 minute
The algorithm checks whether the price increased or decreased at each point. If the price rose, the volume is presumed to be driven by buyers and marked as buy volume; otherwise, it’s marked as sell volume.
The total volume at each point is then checked against the user-defined threshold. If the volume exceeds the threshold, a corresponding circle is drawn on the chart, and an alert is generated if created.
The size of the visual representation is proportional to the most recent maximum volume and follows the rules below:
Percentage of max volume -> Volume cluster size
less than 25% -> Tiny
25% to 50% -> Small
50% to 75% -> Normal
75% to 100% -> Large
100% or more -> Huge
🪙 SETTINGS
The indicator is designed to be as simple and minimalist as possible, making configuration effortless. There are only two core parameters, with additional options to customize the colors of volume clusters based on their type.
Trade volume threshold
Defines the volume level above which a cluster is considered significant and displayed on the chart as a circle. The size of the circle depends on the proportion of the current volume relative to the most recent maximum over the chosen period.
Trades base period
Specifies the period for aggregating trade volumes to determine whether they qualify as abnormal. The significance level is set using the Trade volume threshold parameter.
Buy/Sell trades
Allows you to set the colors for abnormal volume circles based on the price direction during cluster formation.
🪙 CONCLUSION
Abnormal volume clusters are always a critical indicator requiring attention and analysis, but they are not a guaranteed predictor of trend changes.
Effective Volume (ADV) v3Effective Volume (ADV) v3: Enhanced Accumulation/Distribution Analysis Tool
This indicator is an updated version of the original script by cI8DH, now upgraded to Pine Script v5 with added functionality, including the Volume Multiple feature. The tool is designed for analyzing Accumulation/Distribution (A/D) volume, referred to here as "Effective Volume," which represents the volume impact in alignment with price direction, providing insights into bullish or bearish trends through volume.
Accumulation/Distribution Volume Analysis : The script calculates and visualizes Effective Volume (ADV), helping traders assess volume strength in relation to price action. By factoring in bullish or bearish alignment, Effective Volume highlights points where volume strongly supports price movements.
Volume Multiple Feature for Volume Multiplication : The Volume Multiple setting (default value 2) allows you to set a multiplier to identify bars where Effective Volume exceeds the previous bar’s volume by a specified factor. This feature aids in pinpointing significant shifts in volume intensity, often associated with potential trend changes.
Customizable Aggregation Types : Users can choose from three volume aggregation types:
Simple - Standard SMA (Simple Moving Average) for averaging Effective Volume
Smoothed - RMA (Recursive Moving Average) for a less volatile, smoother line
Cumulative - Accumulated Effective Volume for ongoing trend analysis
Volume Divisor : The “Divide Vol by” setting (default 1 million) scales down the Effective Volume value for easier readability. This allows Effective Volume data to be aligned with the scale of the price chart.
Visualization Elements
Effective Volume Columns : The Effective Volume bar plot changes color based on volume direction:
Green Bars : Bullish Effective Volume (volume aligns with price movement upwards)
Red Bars : Bearish Effective Volume (volume aligns with price movement downwards)
Moving Average Lines :
Volume Moving Average - A gray line representing the moving average of total volume.
A/D Moving Average - A blue line showing the moving average of Accumulation/Distribution (A/D) Effective Volume.
High ADV Indicator : A “^” symbol appears on bars where the Effective Volume meets or exceeds the Volume Multiple threshold, highlighting bars with significant volume increase.
How to Use
Analyze Accumulation/Distribution Trends : Use Effective Volume to observe if bullish or bearish volume aligns with price direction, offering insights into the strength and sustainability of trends.
Identify Volume Multipliers with Volume Multiple : Adjust Volume Multiple to track when Effective Volume has notably increased, signaling potential shifts or strengthening trends.
Adjust Volume Display : Use the volume divisor setting to scale Effective Volume for clarity, especially when viewing alongside price data on higher timeframes.
With customizable parameters, this script provides a flexible, enhanced perspective on Effective Volume for traders analyzing volume-based trends and reversals.

Momentum Cloud.V33🌟 Introducing MomentumCloud.V33 🌟
MomentumCloud.V33 is a cutting-edge indicator designed to help traders capture market momentum with clarity and precision. This versatile tool combines moving averages, directional movement indexes (DMI), and volume analysis to provide real-time insights into trend direction and strength. Whether you’re a scalper, day trader, or swing trader, MomentumCloud.V33 adapts to your trading style and timeframe, making it an essential addition to your trading toolkit. 📈💡
🔧 Customizable Parameters:
• Moving Averages: Adjust the periods of the fast (MA1) and slow (MA2) moving averages to fine-tune your trend analysis.
• DMI & ADX: Customize the DMI length and ADX smoothing to focus on strong, actionable trends.
• Volume Multiplier: Modify the cloud thickness based on trading volume, emphasizing trends with significant market participation.
📊 Trend Detection:
• Color-Coded Clouds:
• Green Cloud: Indicates a strong uptrend, suggesting buying opportunities.
• Red Cloud: Indicates a strong downtrend, signaling potential short trades.
• Gray Cloud: Reflects a range-bound market, helping you avoid low-momentum periods.
• Dynamic Volume Integration: The cloud thickness adjusts dynamically with trading volume, highlighting strong trends supported by high market activity.
📈 Strength & Momentum Analysis:
• Strength Filtering: The ADX component ensures that only strong trends are highlighted, filtering out market noise and reducing false signals.
• Visual Momentum Gauge: The cloud color and thickness provide a quick visual representation of market momentum, enabling faster decision-making.
🔔 Alerts:
• Custom Alerts: Set up alerts for when the trend shifts or reaches critical levels, keeping you informed without needing to constantly monitor the chart.
🎨 Visual Enhancements:
• Gradient Cloud & Shadows: The indicator features a gradient-filled cloud with shadowed moving averages, enhancing both aesthetics and clarity on your charts.
• Adaptive Visual Cues: MomentumCloud.V33’s color transitions and dynamic thickness provide an intuitive feel for the market’s rhythm.
🚀 Quick Guide to Using MomentumCloud.V33
1. Add the Indicator: Start by adding MomentumCloud.V33 to your chart. Customize the settings such as MA periods, DMI length, and volume multiplier to match your trading style.
2. Analyze the Market: Observe the color-coded cloud and its thickness to gauge market momentum and trend direction. The thicker the cloud, the stronger the trend.
3. Set Alerts: Activate alerts for trend changes or key levels to capture trading opportunities without needing to watch the screen continuously.
⚙️ How It Works:
MomentumCloud.V33 calculates market momentum by combining moving averages, DMI, and volume. The cloud color changes based on the trend direction, while its thickness reflects the strength of the trend as influenced by trading volume. This integrated approach ensures you can quickly identify robust market movements, making it easier to enter and exit trades at optimal points.
Settings Overview:
• Moving Averages: Define the lengths for the fast and slow moving averages.
• DMI & ADX: Adjust the DMI length and ADX smoothing to focus on significant trends.
• Volume Multiplier: Customize the multiplier to control cloud thickness, highlighting volume-driven trends.
📚 How to Use MomentumCloud.V33:
• Trend Identification: The direction and color of the cloud indicate the prevailing trend, while the cloud’s thickness suggests the trend’s strength.
• Trade Execution: Use the green cloud to look for long entries and the red cloud for short positions. The gray cloud advises caution, as it represents a range-bound market.
• Alerts: Leverage the custom alerts to stay on top of market movements and avoid missing critical trading opportunities.
Unleash the power of trend and momentum analysis with MomentumCloud.V33! Happy trading! 📈🚀✨

Price & Volume Breakout Fibonacci Probability [TradeDots]📝 OVERVIEW
The "Price & Volume Breakout Fibonacci Probability" indicator is designed to detect the probability of the maximum run-up and drawdown of each breakout trade on an asset, assisting traders in optimizing their take profit and stop loss strategies.
🧮 CALCULATIONS
The algorithm detects price and volume breakouts to activate the Fibonacci levels displayed on the chart. It calculates these levels using the period pivot high and low, with the close price of the breakout bar as the reference price.
The indicator then forward-tests within an user-selected number of bars, detecting the maximum run-up and drawdown during that period. Consequently, it calculates the probability of the price hitting either side of the Fibonacci levels, showing the likelihood of reaching take profit and stop loss targets for each breakout trade.
📊 EXAMPLE
The above example shows two breakout trades, circled within the yellow rectangle zone.
The first trade has a maximum run-up above the +0.382 Fibonacci level zone and a maximum drawdown below the -0.618 Fibonacci level zone.
When the price reaches the maximum run-up, it only has a ~45% probability of moving further upward into the last two zones (25% + 19.44%). This indicates that setting a take profit at a higher level may have less than a 50% chance of success.
Conversely, when the price reaches its maximum drawdown, there is only an ~8% probability of moving further downward into the last drawdown zone. This could indicate a potential reversal.
⚙️ SETTINGS
Breakout Condition: Determines the type of breakout condition to track: "Price", "Volume", "Price & Volume".
Backtest Period: The maximum run-up and drawdown are detected within this bar period.
Price Breakout Period: Specifies the number of bars the price needs to break out from.
Volume Breakout Period: Specifies the number of bars the volume needs to break out from.
Trendline Confirmation: Confirms that the close price needs to be above the trendline.
📈 HOW TO USE
By understanding the probabilities of price movements to both the upside and downside, traders can set take profit and stop loss targets with greater accuracy.
For instance, placing a stop loss order below the zone with the highest probability minimizes the chances of being stopped out of a profitable trade. Conversely, setting a take profit target at the zone with the highest probability increases the win rate.
Additionally, if the price breaches multiple Fibonacci levels during the breakout period, it may indicate an abnormal state, signaling a potential reversal or pullback. This can help traders exit trades in a timely manner.
Traders can adjust their take profit and stop loss levels based on their individual risk tolerance.
RISK DISCLAIMER
Trading entails substantial risk, and most day traders incur losses. All content, tools, scripts, articles, and education provided by TradeDots serve purely informational and educational purposes. Past performances are not definitive predictors of future results.

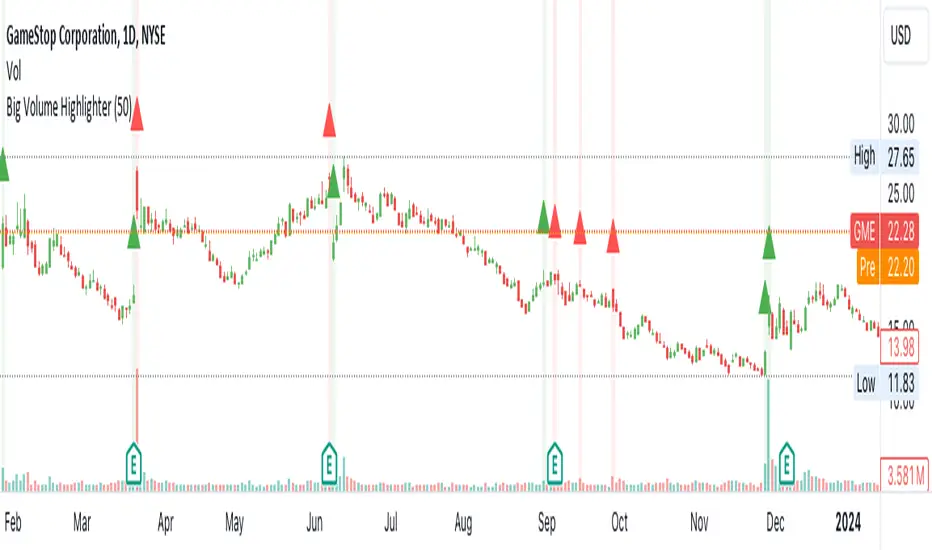
Big Volumes HighlighterBig Volumes Highlighter
Overview:
The "Big Volume Highlighter" is a powerful tool designed to help traders quickly identify candles with the highest trading volume over a specified period. This indicator not only highlights the most significant volume candles but also color-codes them based on the candle's direction—green for bullish (close > open) and red for bearish (close < open). Whether you're analyzing volume spikes or looking for key moments in price action, this indicator provides clear visual cues to enhance your trading decisions.
Features:
Customizable Lookback Period: Define the number of candles to consider when determining the highest volume.
Automatic Color Coding: Candles with the highest volume are highlighted in green if bullish and red if bearish.
Visual Clarity: The indicator marks the significant volume candles with a triangle above the bar and changes the background color to match, making it easy to spot important volume events at a glance.
Use Cases:
Volume Spike Detection:
Quickly identify when a large volume enters the market, which may indicate significant buying or selling pressure.
Trend Confirmation: Use volume spikes to confirm trends or potential reversals by observing the direction of the high-volume candles.
Market Sentiment Analysis: Understand market sentiment by analyzing the direction of the candles with the biggest volumes.
How to Use:
Add the "Big Volume Highlighter" to your chart.
Adjust the lookback period to suit your analysis.
Observe the highlighted candles for insights into market dynamics.
This script is ideal for traders who want to incorporate volume analysis into their technical strategy, providing a simple yet effective way to monitor significant volume changes in the market.
Multi Exchange Relative Volume IndicatorThe Multi Exchange Relative Volume indicator is a powerful tool designed to visualize the relative volume across different exchanges. This is particularly useful for decentralized securities like forex and crypto, where volume data is spread across multiple markets. By aggregating volume data from various exchanges, this indicator helps traders identify trends, spot unusual volume spikes, and make informed trading decisions.
Key Features:
Multi-Exchange Volume Aggregation: Collects and sums the volume data from up to five different exchanges, offering a holistic view of the market activity.
Customizable Inputs: Easily select and configure up to five different exchanges of your choice to monitor their volume activity.
Relative Volume Visualization: Compares the aggregated volume against historical averages to highlight periods of high or low volume.
Color-Coded Volume Bars: Volume bars are color-coded based on the relative volume percentage, providing quick visual cues:
- Red for volume 1.0-1.5 times the average
- Orange for volume 1.5-2.0 times the average
- Green for volume 2.0-3.0 times the average
- Yellow for volume greater than 3.0 times the average
- Grey for below average volume
Dynamic Lookback Period: Adjust the lookback period to suit your trading style and timeframe, allowing for flexible analysis.
Exponential Moving Average (EMA): Includes an EMA of volume to smooth out short-term fluctuations and highlight longer-term trends.
Scalable Layout: The scaling factor allows you to zoom in or out, adjusting the visual representation of volume data to better fit your chart.
Usage:
Configure Exchanges: Select up to five exchanges you want to monitor from the input settings.
Set Lookback Period and Bars: Customize the lookback period and the number of bars to consider for calculating average volume.
Adjust Scaling: Use the scaling factor to zoom in or out on the volume data for better visualization.
Interpret Volume Bars: Analyze the color-coded volume bars to identify significant changes in volume and potential trading opportunities.
Monitor EMA: Use the EMA line to understand the trend and smooth out noise from the volume data.
The Multi Exchange Relative Volume indicator is an essential tool for traders who want to gain deeper insights into market activity across multiple exchanges. By visualizing relative volume, it helps in identifying potential breakout or breakdown points, enhancing your trading strategy.

Price and Volume Breakout Buy Strategy [TradeDots]The "Price and Volume Breakout Buy Strategy" is a trading strategy designed to identify buying opportunities by detecting concurrent price and volume breakouts over a specified range of candlesticks.
This strategy is optimized for assets demonstrating high volatility and significant momentum spikes.
HOW IT WORKS
The strategy first takes the specific number of candlesticks as the examination window for both price and volume.
These values are used as benchmarks to identify breakout conditions.
A trade is initiated when both the closing price and the trading volume surpass the maximum values observed within the predetermined window.
Price must be above a designated moving average, serving as the trend indicator, ensuring that all trades align with the prevailing market trend.
APPLICATION
This strategy is particularly effective for highly volatile assets such as Bitcoin and Ethereum, capitalizing on the cues from sudden price and volume breakouts indicative of significant market movement, often driven by market smart money traders.
However, for broader markets like the S&P 500, this strategy may be less effective due to less pronounced volume and price shifts compared to the cryptocurrency markets.
DEFAULT SETUP
Commission: 0.01%
Initial Capital: $10,000
Equity per Trade: 70%
Backtest result sometimes gives fewer than 100 trades under certain higher timeframes, as most trades tend to have a long holding period. Entry conditions are also more stringent, which, combined with the relatively brief history of cryptocurrencies, results in fewer trades on longer timeframes.
Users are advised to adjust and personalize this trading strategy to better match their individual trading preferences and style.
RISK DISCLAIMER
Trading entails substantial risk, and most day traders incur losses. All content, tools, scripts, articles, and education provided by TradeDots serve purely informational and educational purposes. Past performances are not definitive predictors of future results.

Volume Breakout [Afnan]Introducing the Relative Volume / Volume Breakout Multiplier (RVI) , RVI is specifically designed for traders who incorporate volume breakout analysis into their trading strategies, particularly breakout traders.
This indicator provides a unique perspective on volume dynamics by quantifying the extent of volume breakouts in relation to the Simple Moving Average (SMA). It offers an upgraded version of the default volume indicator on TradingView, with the added feature of Relative Volume.
For example, if the volume SMA is 100M and the current volume is 200M, the indicator will return a breakout number of 2.0, indicating that the current volume is twice that of the volume SMA. Conversely, if the volume SMA is 100M and the current volume is 50M, the indicator will return a value of 0.50, indicating that the current volume is half of the volume SMA.
This tool can be a very helpful for breakout traders, helping them identify potential trading opportunities and assess volume strength more effectively. this indicator is a must-have in the toolkit of any trader who focuses on volume breakout analysis.
Remember, every tool we use, every analysis we perform, is a step towards becoming better traders. So, let’s embrace this journey of continuous learning and improvement together. As the saying goes, “The only limit to our realization of tomorrow will be our doubts of today." Let’s step into the future with confidence, armed with the right tools and the right mindset.
Lastly, a big thank you for your support, your likes, and your comments. They mean a lot! If you have any questions, feel free to ask. Together, let’s make trading a rewarding experience!

VSA Volume Spread AnalysisVolume Spread Analysis with Trend Direction is an indicator designed to Identify trend based volume spread.
Volume
Spread
Trend
This is a very simple yet powerful to identify Trend and corresponding volume Breakout. Unlike other Volume Indicators this indicator detects Breakout along with trend direction. One can detect the Early breakout in volume using this indicator. The Buy or Sell Signal is based on zero crossing of the Histogram.
Trend direction is confirmed using the MA of the Histogram which is similar to the Volume MA on volume indicator. One can enter a trade using the indicator when Trend direction and histogram are in same direction. Entry is done when ever histogram crosses the Trend MA line.
Fake entries can be eliminated by changing the indicator to higher Timeframe.
Spread is determined using the difference in open and close of the candle
Volume change is determined using the ratio of change of volume to previous volume
EMA 10 is used to determine the Spread and multiplied by volume change so the
PRICE(ema10), Volume, Spread(close-open) are merged to one indicator.
Direction changes when ever difference of VSA is positive or negative.

Support and Resistance (MTF) | Flux Charts💎 GENERAL OVERVIEW
Introducing a groundbreaking support and resistance indicator designed to revolutionize your trading experience on TradingView! This innovative tool operates across three distinct timeframes, offering a comprehensive view of market dynamics to help you make informed trading decisions.
The indicator offers a large variety of features :
Select Up To 3 Timeframes
Select Strength Of Supports & Resistances
Select Between Zones & Lines
Show Breaks & Restests
Break & Retest Alerts
Avoid False Breaks
Inverse Color After Broken
Expand Lines & Zones
🚩UNIQUENESS
What sets this indicator apart is its ability to seamlessly integrate and analyze support and resistance levels across multiple timeframes simultaneously. By combining data from three different timeframes, this indicator provides a holistic perspective on market trends and key levels. The adaptive nature of this tool ensures a dynamic assessment of support and resistance zones, empowering traders to adapt to changing market conditions efficiently.
⚙️SETTINGS
1. General Configration
Support & Resistance Count -> Select between 1-3 support & resistance zones for each timeframe.
Pivot Range -> The pivot range is taken into calculations when finding high & low pivots in the chart. Increase if you need a more general look at the support & support zones, or decrease if you need a more detailed look.
Strength -> The strength of the support & resistance zones are determined by how many times the price touched the zone in the past. You can increase the strength up to 4.
Expand Lines & Zones -> If enabled, the support & resistance zones will be expanded to both left and right infinitely. If disabled, the support & resistance zones will be clamped between the time they are first seen, and the time they become broken.
2. Support & Resistance Zones
Enable Zones -> The support & resitsance lines will be converted to zones if enabled.
Zone Width -> The width of the zones. 1 -> %0.05, 2 -> %0.06, 3 -> %0.075.
3. Timeframes
Enable & Disable up to 3 different timeframes using the checkboxes. You can set the timeframes using the selectboxes.
4. Breaks & Retests
Show Breaks -> Points the break points with a blue label with the text "B" on it.
Show Retests -> Points the times when the support & resistance zones are being retested in the current chart.
Avoid False Breaks -> If enabled, the algorithm will try to avoid false break points by comparing the average volume of the point to a longer average volume.
Break Volume Threshold % -> If "Avoid False Breaks" option is enabled, the average volume of the break point should surpass the general average volume by this percent. Higher values mean it's less likely to be a break.
Inverse Color After Broken -> As broken support & resistance zones often become resistance & support zones respectively, if you enable this option the broken zones will inverse their color.
5. Alerts
To make the alerts work, you'll need to add an alert to the chart using the TradingView® alert feature.
Enable Retest Alerts -> You will receive alerts when restests happen on any of the support & resistance zones. "Show Retests" option needs to be enabled to get alerts of this category.
Enable Break Alerts -> You will receive alerts when breaks happen on any of the support & resistance zones.

High volume candles.
High Volume Candles Indicator:
This is a simple tool that shows you when there's a lot of action in the market. It highlights the candles with the highest trading volume on your chart.
What It Does:
Picks the Busiest Candle: It points out the candle with the most trading in your set time.
Shows Buying and Selling: Green for lots of buying, red for lots of selling.
You Choose the Time Frame: Whether it's a few candles or many, it's up to you.
Best Part - Alerts:
Get Notified: The cool thing? It'll alert you when these big volume candles happen. You won't miss the important moments.
Use this to keep track of when things are really moving in the market, without having to watch your screen all the time.
