Volume Insignts AnalyzerDescription:
The Volume Insight Analyzer is an advanced Pine Script designed for traders who want a comprehensive view of volume dynamics on their charts. This script combines multiple volume-based indicators to help identify key trading opportunities, including significant volume days, volume dry-ups, and pocket pivots.
Key Features:
VDU (Volume Dry-Up) Detection: Automatically identifies and marks days when the volume is significantly below its moving average, helping to spot potential breakout or breakdown points. Customizable volume thresholds allow for tailored analysis based on your trading strategy. The Volume Dry-Up label appears when the volume is substantially below its average level and the price is near a key moving average. This condition indicates a period of equilibrium between supply and demand, suggesting a potential low-risk entry point for traders.
Pocket Pivot Analysis using 5 and 10 Length Pocket Pivots: Highlights days with exceptionally high volume compared to recent history, indicating potential pocket pivots. Visual markers on the chart and volume bars color-coded for 5 and 10-day lengths. Pocket pivot points are identified when the volume on a given day exceeds the maximum volume observed over the past several days. Specifically, a 5-day pocket pivot point is marked when today's volume surpasses the highest selling volume of the last 5 days. A cluster of 5-day pocket pivot points within a base is a strong indicator of stock strength. Similarly, a 10-day pocket pivot point following a Volume Dry-Up (VDU) suggests a potential entry opportunity. Moreover, a pre-existing cluster of 5-day pocket pivot points before a 10-day pocket pivot point provides greater conviction in the trade.
Volume Moving Averages: Set different lengths for primary and secondary moving averages to track volume trends over daily, weekly, and monthly timeframes. Options to display moving average lines on the volume chart.
Volume Visualization:
a. Major and Minor Volume Bars: Option to display bars that are either above or below average volume levels. Adjustable settings to show or hide these bars based on user preference.
b. Volume Bar Coloring: Volume bars are color-coded based on significant volume thresholds, including green for bullish signals, red for bearish signals, and orange for volume dry-ups.
Volume Metrics Table: A customizable table that displays real-time volume metrics including Relative Volume (RVOL), Turnover, and the number of high volume days. The table can be oriented horizontally or vertically and styled according to your theme preferences.
Visual Indicators:
a) Volume Dry-Up (VDU) Labels: Clearly marked VDU events with textual annotations on the chart.
b) Bullish and Bearish Arrows: Arrows indicating potential bullish or bearish closes based on volume analysis, enhancing decision-making.
Customization Options:
a) Dark and Light Theme Support: Toggle between dark and light themes to match your chart settings.
b) Adjustable Parameters: Easily configure input settings such as volume thresholds, MA lengths, and table display options to fit your trading style.
How to Use:
Set Parameters: Adjust the script settings such as volume thresholds, moving average lengths, and display preferences according to your analysis needs.
Analyze Volume Patterns: Use the indicators and visual markers provided by the script to identify significant volume patterns and potential trading signals.
Monitor Metrics: Refer to the volume metrics table for a quick overview of key volume-related statistics and trends.
Make Informed Decisions: Utilize the visual cues and volume data provided by the script to enhance your trading strategy and make more informed decisions.
Disclaimer:
This script is for informational purposes only and should not be considered as trading advice. Use it in conjunction with other analysis tools and consult with a financial advisor if needed. Trading involves risk, and past performance does not guarantee future results.
Volumes

Wicks Rejection PercentagesAnalyzing wick rejection percentages can provide insights into market sentiment and potential future price movements. For example, high wick rejection percentages at key support or resistance levels may indicate strong buying or selling interest and could influence trading decisions.

Volume Spectrum Candles"Volume Spectrum Candles" is a visually intuitive trading indicator that enhances candlestick charts by incorporating trading volume directly into the color of each candle.
Purpose and Utility:
This tool assigns a unique color gradient to candlesticks, which varies from light to dark based on the volume of trades executed. This feature allows traders to immediately recognize and differentiate periods of varying trading activity at a glance.
Target User:
It is specifically designed for traders who integrate volume analysis into their trading strategies, offering a seamless blend of visual cues and technical data.
Benefits:
By providing a visual representation of volume intensity, traders can more effectively identify key market movements, helping to determine optimal entry and exit points. The color gradation adds a layer of quick analysis, making it easier to spot trends in trading volume without the need for additional indicators.
Application and Versatility:
Whether used by day traders to capture short-term price movements or by long-term investors to gauge broader market sentiment, "Volume Spectrum Candles" serves as a valuable addition to any trading setup.

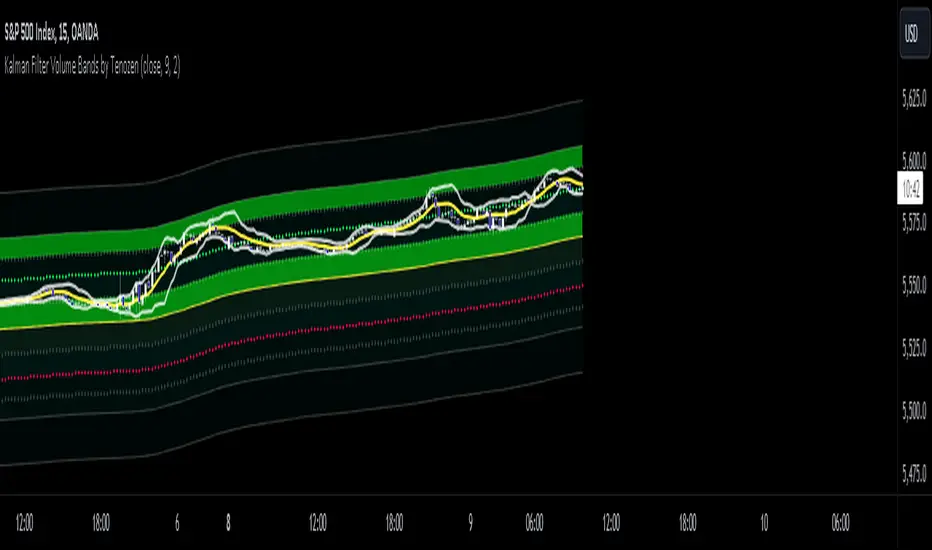
Kalman Filter Volume Bands by TenozenHello there! I am excited to introduce a new original indicator, the Kalman Filter Volume Bands. This indicator is calculated using the Kalman Filter, which is an adaptive-based smoothing quantitative tool. The Kalman Filter Volume Bands have two components that support the calculation, namely VWAP and VaR.
VWAP is used to determine the weight of the Kalman Filter Returns, but it doesn't have a significant impact on the calculation. On the other hand, VaR or Value at risk is calculated using the 99th percentile, which means that there is a 1% chance for the returns to exceed the 99th percentile level. After getting the VaR value, I manually adjust the bands based on the current market I'm trading on. I take the highest point (VaR*2) and the lowest point (-(VaR*2)) from the Kalman Filter, and then divide them into segments manually based on my preference.
This process results in 8 segments, where 2 segments near the Kalman Filter are further divided, making a total of 12 segments. These segments classify the current state of the price based on code-based coloring. The five states are very bullish, bullish, very bearish, bearish, and neutral.
I created this indicator to have an adaptive band that is not biased toward the volatility of the market. Most band-based indicators don't capture reversals that well, but the Kalman Filter Volume Bands can capture both trends and reversals. This makes it suitable for both trend-following and reversal trading approaches.
That's all for the explanation! Ciao!
Additional Reminder:
- Please use hourly timeframes or higher as lower timeframes are too noisy for reliable readings of this indicator.
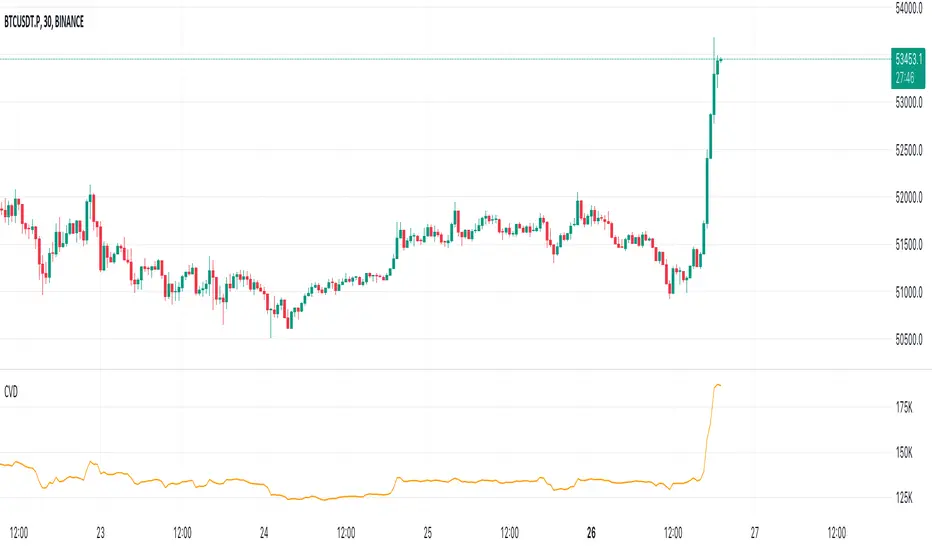
Cumulative Volume Delta (CVD)█ OVERVIEW
Cumulative Volume Delta (CVD) is a volume-based trading indicator that provides a visual representation of market buying and selling pressure by calculating the difference in traded volumes between the two sides. It uses intrabar information to obtain more precise volume delta information than methods using only the chart's timeframe.
Volume delta is the net difference between Buy Volume and Sell Volume. Positive volume delta indicates that buy volume is more than sell volume, and opposite. So Cumulative Volume Delta (CVD) is a running total/cumulation of volume delta values, where positive VD gets added to the sum and negative VD gets subtracted from the sum.
I found simple and fast solution how to calculate CVD, so made plain and concise code, here is CVD function :
cvd(_c, _o, _v) =>
var tcvd = 0.0, delta = 0.0
posV = 0.0, negV = 0.0
totUV = 0.0, totDV = 0.0
switch
_c > _o => posV += _v
_c < _o => negV -= _v
_c > nz(_c ) => posV += _v
_c < nz(_c ) => negV -= _v
nz(posV ) > 0 => posV += _v
nz(negV ) < 0 => negV -= _v
totUV += posV
totDV += negV
delta := totUV + totDV
cvd = tcvd + delta
tcvd += delta
cvd
where _c, _o, _v are close, open and volume of intrabar much lower timeframe.
Indicator uses intrabar information to obtain more precise volume delta information than methods using only the chart's timeframe.
Intrabar precision calculation depends on the chart's timeframe:
CVD is good to use together with open interest, volume and price change.
For example if CVD is rising and price makes good move up in short period and volume is rising and open interest makes good move up in short period and before was flat market it is show big chance to pump.
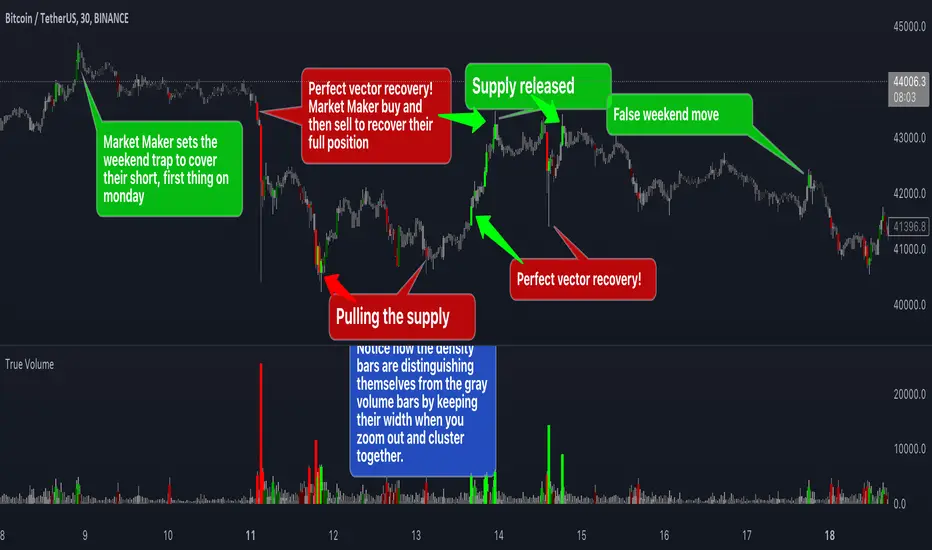
True VolumeThis indicator is designed to provide in-depth analysis of volume data from multiple sources and distinguish highly liquid candles by measuring the density of the volume. By focusing on the density and concentration of volume, rather than just the volume itself, it offers a more nuanced view of the market. This can be particularly beneficial in markets like cryptocurrencies, where understanding the role of market makers versus retail traders is crucial for strategic trading.
This is how it works:
Multiple Asset Integration:
Unlike standard volume indicators, True Volume allows the inclusion of up to four different assets (or the same asset from various exchanges) into its volume calculations. This feature provides a broader and more accurate total volume representation, essential in markets like cryptocurrencies where volume is dispersed across multiple exchanges.
Adjustable Time Anchors:
It offers various time anchor options, allowing traders to analyze volume data over different time periods or a specific amount of lookback candles. This flexibility helps in understanding volume trends over both short and long-term time frames.
Volume Density Analysis:
The core of this indicator is the innovative concept of Volume Density. It's calculated using a sigmoid function that normalizes the volume-to-price movement ratio in a unique way without needing a max cap or having the density column spike off the chart. This method helps in distinguishing between normal volume fluctuations and those that are unusually dense for the given price movement. This distinction is key in identifying potential market maker activities.
The Visuals:
The Volume Density is displayed in a unique way without compromising the original volume bars or cap the density. Infinite density can essentially be represented without having an infinitely large bar or caping out the density data. There's also two different color themes, optional bar color, and an option to flip the density bars up-side down for a different representation. Each of the original volume sources can be displayed separately as well. All colors as customizable as well for your own preference.
Price Volume Trend (PVT):
Included in this indicator is also the Price Volume Trend, which cumulatively measures the density delta, offering insights into the longer-term momentum of the market.
How do I trade it?
This indicator aims to give you insight into 'the other side of the trade', the Market Makers. When you buy, they provide liquidity by selling to you. That drives the Volume Density up.
Consider whether the market maker is currently long or short and might need to cover their position by wicking price back, or "adjust inventory". Especially towards the end of a market session.
Consider dense candles during market gaps or weekends to be market manipulation moves.
The density also goes up when stop losses are hit. If price makes a higher high or lower low, high density could indicate a liquidation event.
Volume Profile PlusThis indicator provides a high-resolution and high-precision implementation of Volume Profile with flexible range settings. Its key features include:
1. Support for a high resolution of up to 2,500 rows.
2. Capability to examine lower timeframe bars (default 5,000 intra-bars) for enhanced precision.
3. Three range modes — "Visible Range", "Anchored Range", and "All Range".
4. Highlighting of Point of Control and Value Area.
5. Extensive customization options allowing users to configure dimensions, on-chart placements, and color schemes.
🔵 Settings
The settings screen, along with the explanations for each setting, is provided below:
🔵 High Resolution using Polyline
Inspired by @fikira, this indicator utilizes the newly introduced `polyline` type in PineScript to plot the volume profile. It employs a single polyline instance to represent the entire histogram. With each polyline instance supporting up to 10,000 points and each histogram row requiring 4 points, this indicator can accommodate 2500 rows, resulting in a significantly higher resolution compared to conventional volume profile indicators that use `line`s or `box`es to draw the histogram.
🔵 High Precision Data-binning using Lower Timeframe Data
Conventional volume profile indicators often face one or both of the following limitations:
1. They only consider volume within the chart's current timeframe.
2. They assign each bar's total volume to a single price bucket based on the bar's average price, rather than distributing volume across multiple price buckets.
As a result, when the number of bars in the chart is low, those indicators may provide imprecise results, making it difficult to accurately identify significant volume nodes and the point of control.
To address these limitations and enhance accuracy, this indicator examines data from lower timeframes and distributes the volume to fine-grained price buckets. It intelligently selects an appropriate lower timeframe to ensure precise output while complying with a maximum specified number of bars to maintain good performance.
🔵 Three Range Modes
This indicator offers users the flexibility to choose from three range modes:
1. Visible Range (Default Mode): In this mode, the volume profile calculation begins at the time of the left-most bar displayed in the current viewport. As the user scrolls through the viewport, the volume profile updates automatically.
2. Anchored Range: This mode allows the user to set the start time either by using the datetime input boxes or by dragging the anchor line on the chart.
3. All Range: In this mode, the volume profile calculation is based on all the historical bars available in the chart.

YD_Volume_Alert"YD_Volume_Alert" is a simple alert based on the increasing volume.
Although it is a simple indicator, strategies to determine accumulation and distribution can be developed using this indicator, which will also be published as well.
📌 Usage, Details and Alert
Using this indicator is simple.
You can enter two scales, "Increased Percentage 1 (%)" and "Increased Percentage 2 (%)", with default values set to 200% and 500%.
Signals are displayed in green and red triangles at the bottom of the bar, also printed with the text "Increased Volume" and "Hugely increased Volume".
Alerts are provided as a combination of the chart's symbol and the set percentage. For example,
"BINANCE:BTCUSDT.P 's Volume : 200% increased."
===========================================================
"YD_Volume_Alert" 는 거래량 증가에 따른 얼러트를 제공하는 간단한 지표입니다.
간단한 지표이지만 위 지표를 이용하여 매집과 매도의 타이밍으로 이용하는 전략 또한 개발할 수 있으며, 이 역시도 퍼블리시 할 예정입니다.
📌 사용 예시와 알림 설정
지표를 사용하는 방법은 간단합니다.
"Increased Percentage 1 (%)" 과 "Increased Percentage 2 (%)" 두 가지의 배율을 입력할 수 있으며, 기본값은 200%와 500%로 설정되어 있습니다.
시그널은 바 하단에 초록색, 빨간색 삼각형으로 각각 표시되며, "Increased Volume"과 "Hugely increased Volume"이라는 텍스트가 함께 출력됩니다.
얼러트는 자신이 설정한 차트의 심볼과 설정한 퍼센티지의 조합으로 제공되며 예를 들면 다음과 같습니다.
"BINANCE:BTCUSDT.P 's Volume : 200% increased."

improved volumeIt is an indicator that displays the trading volume.
Red-colored candle bars indicate a decrease in trading volume.
Green-colored candle bars indicate an increase in trading volume.
The transparent yellow cloud above the volume bars represents the 21-bar moving average volume, which shows the average volume over the specified period. (You can change the number of bars and the type of moving average from the indicator settings.)
This allows for easier comparison between the current trading volume and the average volume.
In the price scale section, there are 4 target levels. They represent the following in ascending order: Average volume, Average volume multiplied by 2, Average volume multiplied by 3, Average volume multiplied by 4.
Additionally, you can use the alarm feature based on these average volume levels.

Volume and vPOC InsightsThe vPOC or volume point of control shows where most of the volume was traded. This is important because this is where the institutions and market makers have opened their positions, and these are the ones that move the markets!
This indicator is designed to cut through the volume noise, and enable the hiding of lower volume data.
The main setting allows you to define a lookback, and obscure the candles whose volume is less than x % of the highest volume in this lookback.
Of the remaining candles, their vPOC will be displayed. There are extra settings to extend naked vPOCs, as well as the highs and lows of these high volume candles, plus an EMA based on the vPOC price levels.
I must credit quantifytools @quantifytools who allowed me to utilize his code, for finding vPOCs using lower timeframe candles - there are comments in the code also. It works perfectly so why reinvent the wheel?

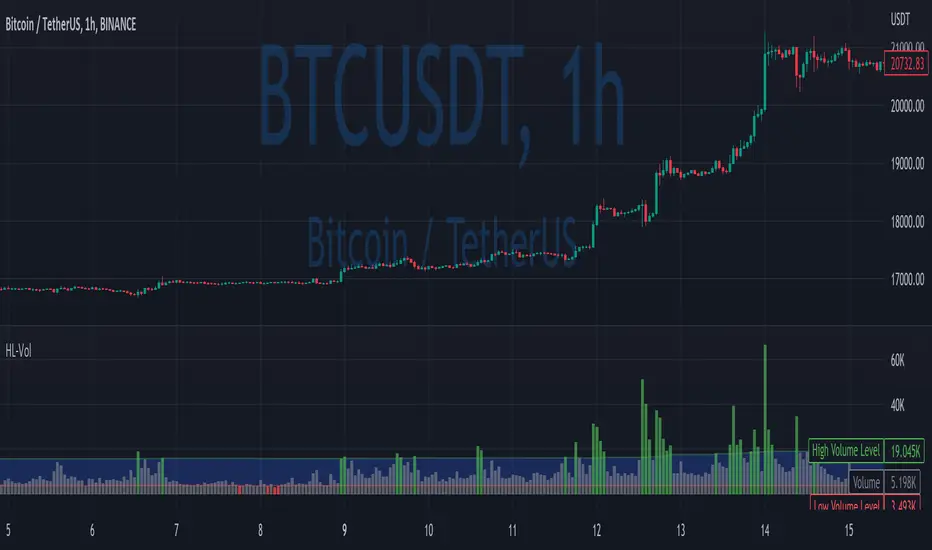
High/Low VolumeIn this indicator, I show you a better way to define high/low values of volume (or any other indicator).
Quite often, I get requests from my clients that an indicator level should be “high” or that it should be above a certain absolute level.
The first request is hard to interpret mathematically, but traders can easily spot it on the chart. The second one is not flexible, and it might not make sense in another market regime.
To solve that, you can compute dynamic high/low levels that represent unexpected extreme values that are adaptable to recent conditions.
There are two pretty simple methods I’m using quite often in my scripts percentiles and sigma (standard deviations).
Percentile looks back at X bars and computes the value under which a certain % of data points are located. So, for example, if we’re computing 90%tile and we’re looking at 100 bars, we’ll get a value under which we have values of precisely 90 bars for this indicator. It’s a good idea to use something like 5%tile for low level and 95%tile for high level.
Sigma(σ) is related to standard deviation. If we assume that our data is normally distributed, then 68% of data points should be in the range of mean +-1σ, 95% → mean +-2σ. So we can assume that something above 2σ is a pretty rare and extreme event.
In this script, I give you an example of how to compute both on volume, but you can easily change this to another indicator.
The issue with volume is that it’s not normally distributed, and your low level will be quite often too low to detect any low levels. Ideally, we have to use a more sophisticated formula that fits volume distribution better.
In this indicator, you can set the following parameters:
Choose type: Percentile or Sigma
Lookback Period
High/Low Percentiles
Sigmas #
You can also receive alerts for high/low volume events.
Disclaimer
Please remember that past performance may not indicate future results.
Due to various factors, including changing market conditions, the strategy may no longer perform as well as in historical backtesting.
This post and the script don’t provide any financial advice.
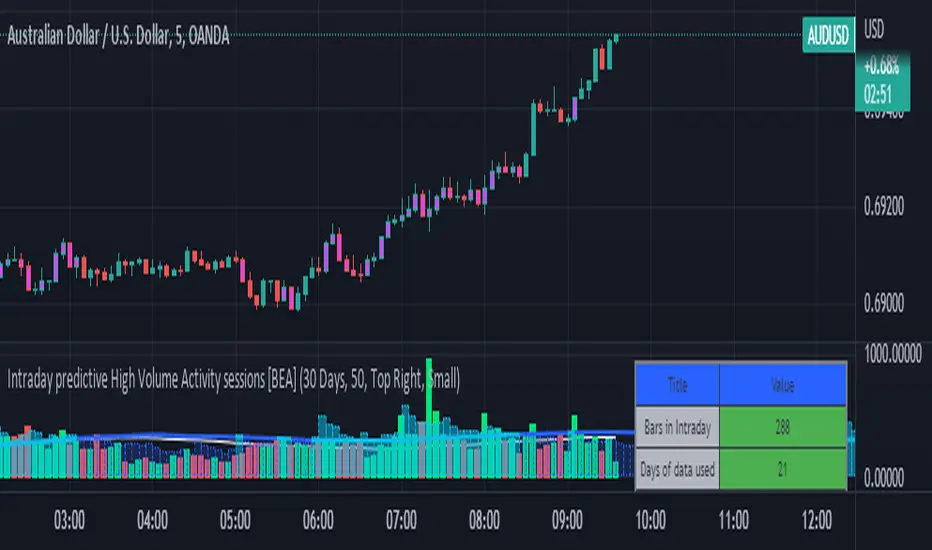
Intraday predictive High Volume Activity sessions [BEA]Idea:
This indicator is designed to know the high traded volume sessions in advance before the day starts.
The predictive volume bars will be plotted in advance once a new trading session starts.
Logic Used:
The basic idea is to store each bar volume / Volume MA data for the selected time. So, the first bar of each data is stored for all selected historical days.
Once the data is stored, I am taking average of each bar data for the selected Historical days.
How to Use:
This gives me an idea of the volume behavior throughout the days based on historical data. So I decide my time of trading for that specific times sessions where the traded volume activity is high.
The bars which are more than the Moving average ( Highlighted Volume bars plotted in future ) is the time session to focus.
Designed only for intraday timeframes.
Here in the image, you can see the session in advance for high traded volume activity.
Try it test it , let me know if it can be improved further.
Have a happy trading.
DISCLAIMER
Any and all liability for risks resulting from investment transactions or other asset dispositions carried out by the user based on information received or a market analysis is expressly excluded by me.
All the information made available here is generally provided to serve as an example only, without obligation and without specific recommendations for action. It does not constitute and cannot replace investment advice. We therefore recommend that you contact your personal financial advisor before carrying out specific transactions and investments.
Do your own research, this is not a financial advice.
Ichimoku Kinkō hyō 目均衡表█ OVERVIEW
Ichimoku is known to be an Indicator that completes itself, for its power but also for its complexity. This is why I decided to improve the work of
Goichi Hosoda in order to offer the maximum number of options for the most seasoned users but also beginners with options to simplify the
reading of Ichimoku (such as a panel directly giving you the status of each Ichimoku options or Supports/Resistances drawn automatically
according to the conditions chosen in the settings.
█ OPTIONS
Here is the complete list of options to implement :
- "Source" and "Alternative Source" (with lots of choices)
- Heikin Ashi volume.
- Weighted Moving Average Smoothing
- Minimum, Maximum and Adaptive Percentage Length adjustable for Tenkan-Sen, Kijun-Sen, Chikou Span and Senkou-Span)
- The Chikou has a Filter with modifiable Length (in Lookback Percentage)
- Advanced Filter Settings: Volume, Tenkan-Sen/Kijun-Sen Cross, Volatility, Tenkan-Sen Equal Kijun-Sen, Chikou Greater Than Price,
Chikou Momentum, Price Greater Than Kumo, Price Greater Than Tenkan-Sen, Chikou Trend Filter .
- Oscillator volume adjustable via drop-down menu with 5 types of oscillators available: "TFS Volume", "On Balance Volume",
"Klinger Volume", "Cumulative Volume", "Volume Zone".
- Relative Volume Strength Index with Length, Peak and EMA's adjustable. 3 Oscillators available: “On Balance Volume”,
“Cumulative Volume”, “Price Volume Trend”.
- Volatility adjustable with Fast and Slow Length.
- Totally customizable Support and Resistance.
- Bar Trend Color based on chosen settings.
- Fully customizable help panel.
- Alerts available for: Labels Detection, Support/Resistance Line Cross, Panel Trend Status Direction.
█ NOTES
Remember to only make a decision once you are sure of your analysis. Good trading sessions to everyone and don't forget,
risk management remains the most important!

Delta Volume by SiddWolfDelta Volume is Difference between Buying Volume and Selling Volume. This indicator gives the Delta Volume based on Lower TimeFrame Candles. It utilizes security_lower_tf() function, a function that provides Lower TF candle data in Higher TF Chart.
security_lower_tf() is a new function provided by TradingView yesterday. If you are a PineScript Programmer, I suggest you to read about it, as it is a very powerful function that can extremely improve your trading strategy.
How this indicator works:
This indicator checks volume data on lower TimeFrame Candles and Shows it's delta in the current Chart Timeframe. For example: If you open 4 hours chart, this indicator checks volume of 1 minute chart and separates Buying-Selling volume. Then it subtracts Candle's Selling volume from Candle's Buying volume, finally calculating the Delta Volume.
This indicator also provides a Smooth Delta Volume, which is moving average of Delta Volume. As Delta Volume changes a lot, Smooth Delta Volume can be very helpful for identifying Trends . Goto settings and in "Show" section select "Smooth Delta Volume" to lay it on the chart.
Settings is the Key:
Settings are key to all of my indicators. Play around with it a bit. You can change what to show on the chart from settings. Smooth Delta Volume moving average length can be changed from the settings. You can also select "Show as Percentage", which shows Delta Volume as Percentage of Overall Candle's Volume. If you use Weekly or Monthly Timeframe, change increase lower timeframe from settings. Read the tooltips to understand what each settings mean. Tooltips are the (i) button in-front of each settings.
FAQs:
Q. Does the indicator Repaint ?
--- No. None of my indicators repaints. What you see now is what's drawn in real time.
Q. What TimeFrame is Best for this Indicator ?
--- It can be used on timeframes from 5 minutes to higher. But I would prefer to use it from timeframes higher than 30 minutes, as it gathers data from 1 minute TF.
Q. Indicator doesn't show anything ?
--- This indicator only works on security with Volume data. Also use it from higher timeframe than specified in Settings, because Volume Delta is calculated using Data from Lower TimeFrame.
Q. Delta volume is not provided by TradingView, So how exactly does this indicator work?
--- This indicator takes advantage of new pinescript function security_lower_tf(), and calculates volume for smaller timeframe data and calculates delta on higher timeframe.
Q. Does this indicator give financial advice?
--- No. Nope. Nein. Não. नहीं.
Conclusion:
This indicator is very basic but if used correctly it can be very powerful. If you have any questions or suggestions feel free to comment below. I'd love to connect with you. Thank you.
~ @SiddWolf

MACD Volume S2 By Gammaprod>> How to use this indicator :
1. Set your teadingview theme to dark theme.
2. My indicator is valid for forex, stock and but more valid for crypto.
3. Use three timeframe for more validation (choose between those, that fit to your trading style) :
- Timeframe 1m, 5m, and 15m for Scalping
- Timeframe 30m, 1h and 4h for Intraday
- Timeframe 4h, 1D and 1W for Swing Trading
4 . Always use THREE INDICATORS FROM GAMMAPROD, those three indicators is back to back each other, by the way, I only made those three indicators only (for now) :
- Trendlines Boll Ichi Crypto by Gammaprod
- Stoch RSI Divs Zone Crypto by Gammaprod
- MACD Volume Crypto by Gammaprod
>> How to setting :
1. Trendlines Boll Ichi Crypto by Gammaprod
A. Support and Resistence
- Well if you familiar with this indicator you can add it, but recommended for Timeframe 30m or more
B. Trendlines Primary or Trendlines Secondary
- Timeframe 1m you DON'T NEED Trendlines Primary or Trendlines Secondary
- Timeframe 5m you DON'T NEED Trendlines Secondary, but you CAN ADD Trendlines Primary if you fell it helpful (for me, it is helpful to find where the candles start or the end trend or a consolidation or where the candles will surpass a resistance or a support).
- Timeframe 15m you DON'T NEED Trendlines Secondary, DEFENITELY add Trendlines Primary it will help to find where the candles stop or a consolidation or where the candles will surpass a resistance or a support).
- Timeframe 30m or more, DEFENITELY NEED BOTH Trendlines Primary and Secondary Trendlines, it will help to find where the candle stop or consolidation or where the candle will surpass a resistance or support).
C. Bolinger, Ichimoku Cloud and Lagging Span
- Please DON'T CHANGE IT at all, it's really helpful to know when and where to make an entry decesion or a trend or a consolidation, if you don't understand how to read it, you better to learn it first (on "how to read" section and "How to OPEN position" the section below)
2. Stoch RSI Divs Zone Crypto by Gammaprod (DON'T CHANGE IT)
3. MACD Volume Crypto by Gammaprod (DON'T CHANGE IT)
>> How to read :
1. Sell or Buy Priority :
A. Buy Priority
- Color background on macd and stoch rsi is pink or purple sell is the priority, (if you're not sure to buy, just wait until the best moment to sell)
B. Buy Priority
- Color background on macd and stoch rsi Teal or light green buy is the priority, (if you're not sure to sell, just wait until the best moment to buy)
C. Indecision / Golden Moment
- Color background on stoch rsi yellow is indecision / golden moment of reversal pattern (wait until it formed background only on Stoch RSI), please becareful at this moment.
2. Trend / Consolidation :
A. BULLISH trend
- When Stoch RSI and MACD have teal or light green background that's means BULLISH trend, better to confirm by the candle is above green cloud and lagging span (red line) is also above the candle.
B. BEARISH trend
- When Stoch RSI and MACD have the Pink or purple background that's means BEARISH trend, better to confirm by the candle is above purple cloud and lagging span (red line) is also below the candle.
C. CONSOLIDATION
- When Stoch RSI have the mix background that's means CONSOLIDATION, better to confirm by the candle is in or near to green / purple cloud and lagging span (red line) is also on the candle.
3. Special Mark
A. Ideal Bullish :
- Near line 20 and green / teal background = When Stoch RSI have the char R / H on lime color label, that's means divergence or hidden divergence for buy position, if you not see this label that's means just a standard confirmation for buy
B. Not an Ideal Bullish :
- Near line 80 and green / teal background = if this happens make sure you know what happen, it could be a false signal or bullish continual pattern
C. Ideal Bearish :
- Near line 80 and pink / purple background = When Stoch RSI have the char R / H on lime color label, that's means divergence or hidden divergence for buy position, if you not see this label that's means just a standard confirmation for sell position.
D. Not an Ideal Bearish:
- Near line 20 and pink / purple background = if this happens make sure you know what happen, it could be a false signal or bearish continual pattern
E. The Beginning of Reversal (from BEARISH to BULLISH) :
- When Stoch RSI line shaping GREEN position is near 20.
- MACD lines still PINK, position lines is UNDER the HISTOGRAM, but the HISTOGRAM start to SHAPE FALL PINK (light pink) and the BACKGROUND still PINK / PURPLE.
- Position CANDLES NEAR BLUE line, NEAR PURPLE CLOUD, and lagging span (red line) STILL ON the area candle. (it used to be confirmed with the golden moment).
F. The Beginning of Reversal (from BULLISH to BEARISH) :
- When Stoch RSI line shaping PINK position is near 80.
- MACD lines still GREEN, position lines is ABOVE the HISTOGRAM, but the HISTOGRAM start to SHAPE FALL GREEN (light green) and the BACKGROUND still TEAL / GREEN.
- Position CANDLES NEAR WHITE line, NEAR TEAL CLOUD, and lagging span (red line) STILL ON the area candle. (it used to be confirmed with the golden moment).
G. False Signals, or It could be a Golden Moment (better to see it on TF 15 or bigger):
- Near line 20 or 80 and yellow background = When Stoch RSI have the char R / H on color label, that's means divergence or hidden divergence for buy / sell position, if you not see this label that's means just a standard confirmation for buy / sell depends on where the Stoch RSI line if near 20 that's means buy, near 80 means sell
>> How to OPEN position:
A. Bullish
1. Trendlines Boll Ichi Crypto by Gammaprod
- The candles above the green cloud.
- Lagging span (red line) above the candles.
- then open buy near yellow line (the first option) / blue line (the second option) (always confirm the position with two other indicators below).
2. Stoch RSI Divs Zone Crypto by Gammaprod
- Teal or Green background.
- The lines is shaping green.
- Better if on the bottom (at a range 20).
3. MACD Volume Crypto by Gammaprod
- Teal or Green background.
- The lines is shaped or shaping green.
- Better if at the green histogram.
B. Bearish
1. Trendlines Boll Ichi Crypto by Gammaprod
- The candles below the purple cloud.
- Lagging span (red line) below the candles.
- then open buy near yellow line (the first option) / white line (the second option) (always confirm the position with two other indicators below).
2. Stoch RSI Divs Zone Crypto by Gammaprod
- Pink or purple background.
- The lines are shaping pink.
- Better if the line on the top (at a range 80).
3. MACD Volume Crypto by Gammaprod
- Pink or purple background.
- The lines are shaped or shaping green.
- Better if at the pink histogram.
C. Consolidation
1. Trendlines Boll Ichi Crypto by Gammaprod
- The candles on the cloud (green or purple).
- Lagging span (red line) on the candles.
- then open buy near the white or blue line (always confirm the position with two other indicators below).
2. Stoch RSI Divs Zone Crypto by Gammaprod
- Mix background specially on a timeframe 15m or more.
- The line move fast up and down.
- Better if on the bottom or the top of the lines (at a range 20 or 80).
3. MACD Volume Crypto by Gammaprod
- Changing the background.
- The line is near the middle line.
- Have small Histogram.
>> The secret ingridient is comparing the timeframe :
The example scalping (Timeframe 1m, 5m and 15m)
- TF 1m is for making an open position.
- TF 5m is for making a judgement of the trend market.
- TF 15m is to confirm that judgement from TF 5m, be careful if it not similar then it used to be a consolidation or the beginning of the reversal.
There's a lot a way to open the position than above information that i gave it to you, but consider there are a limit char on this column, I hope it will help your trading and make a more profit on it.

Stoch RSI, Div, Zone S3 by Gammaprod>> How to use this indicator :
1. Set your teadingview theme to dark theme.
2. My indicator is valid for forex, stock and but more valid for crypto.
3. Use three timeframe for more validation (choose between those, that fit to your trading style) :
- Timeframe 1m, 5m, and 15m for Scalping
- Timeframe 30m, 1h and 4h for Intraday
- Timeframe 4h, 1D and 1W for Swing Trading
4 . Always use THREE INDICATORS FROM GAMMAPROD, those three indicators is back to back each other, by the way, I only made those three indicators only (for now) :
- Trendlines Boll Ichi Crypto by Gammaprod
- Stoch RSI Divs Zone Crypto by Gammaprod
- MACD Volume Crypto by Gammaprod
>> How to setting :
1. Trendlines Boll Ichi Crypto by Gammaprod
A. Support and Resistence
- Well if you familiar with this indicator you can add it, but recommended for Timeframe 30m or more
B. Trendlines Primary or Trendlines Secondary
- Timeframe 1m you DON'T NEED Trendlines Primary or Trendlines Secondary
- Timeframe 5m you DON'T NEED Trendlines Secondary, but you CAN ADD Trendlines Primary if you fell it helpful (for me, it is helpful to find where the candles start or the end trend or a consolidation or where the candles will surpass a resistance or a support).
- Timeframe 15m you DON'T NEED Trendlines Secondary, DEFENITELY add Trendlines Primary it will help to find where the candles stop or a consolidation or where the candles will surpass a resistance or a support).
- Timeframe 30m or more, DEFENITELY NEED BOTH Trendlines Primary and Secondary Trendlines, it will help to find where the candle stop or consolidation or where the candle will surpass a resistance or support).
C. Bolinger, Ichimoku Cloud and Lagging Span
- Please DON'T CHANGE IT at all, it's really helpful to know when and where to make an entry decesion or a trend or a consolidation, if you don't understand how to read it, you better to learn it first (on "how to read" section and "How to OPEN position" the section below)
2. Stoch RSI Divs Zone Crypto by Gammaprod (DON'T CHANGE IT)
3. MACD Volume Crypto by Gammaprod (DON'T CHANGE IT)
>> How to read :
1. Sell or Buy Priority :
A. Buy Priority
- Color background on macd and stoch rsi is pink or purple sell is the priority, (if you're not sure to buy, just wait until the best moment to sell)
B. Buy Priority
- Color background on macd and stoch rsi Teal or light green buy is the priority, (if you're not sure to sell, just wait until the best moment to buy)
C. Indecision / Golden Moment
- Color background on stoch rsi yellow is indecision / golden moment of reversal pattern (wait until it formed background only on Stoch RSI), please becareful at this moment.
2. Trend / Consolidation :
A. BULLISH trend
- When Stoch RSI and MACD have teal or light green background that's means BULLISH trend, better to confirm by the candle is above green cloud and lagging span (red line) is also above the candle.
B. BEARISH trend
- When Stoch RSI and MACD have the Pink or purple background that's means BEARISH trend, better to confirm by the candle is above purple cloud and lagging span (red line) is also below the candle.
C. CONSOLIDATION
- When Stoch RSI have the mix background that's means CONSOLIDATION, better to confirm by the candle is in or near to green / purple cloud and lagging span (red line) is also on the candle.
3. Special Mark
A. Ideal Bullish :
- Near line 20 and green / teal background = When Stoch RSI have the char R / H on lime color label, that's means divergence or hidden divergence for buy position, if you not see this label that's means just a standard confirmation for buy
B. Not an Ideal Bullish :
- Near line 80 and green / teal background = if this happens make sure you know what happen, it could be a false signal or bullish continual pattern
C. Ideal Bearish :
- Near line 80 and pink / purple background = When Stoch RSI have the char R / H on lime color label, that's means divergence or hidden divergence for buy position, if you not see this label that's means just a standard confirmation for sell position.
D. Not an Ideal Bearish:
- Near line 20 and pink / purple background = if this happens make sure you know what happen, it could be a false signal or bearish continual pattern
E. The Beginning of Reversal (from BEARISH to BULLISH) :
- When Stoch RSI line shaping GREEN position is near 20.
- MACD lines still PINK, position lines is UNDER the HISTOGRAM, but the HISTOGRAM start to SHAPE FALL PINK (light pink) and the BACKGROUND still PINK / PURPLE.
- Position CANDLES NEAR BLUE line, NEAR PURPLE CLOUD, and lagging span (red line) STILL ON the area candle. (it used to be confirmed with the golden moment).
F. The Beginning of Reversal (from BULLISH to BEARISH) :
- When Stoch RSI line shaping PINK position is near 80.
- MACD lines still GREEN, position lines is ABOVE the HISTOGRAM, but the HISTOGRAM start to SHAPE FALL GREEN (light green) and the BACKGROUND still TEAL / GREEN.
- Position CANDLES NEAR WHITE line, NEAR TEAL CLOUD, and lagging span (red line) STILL ON the area candle. (it used to be confirmed with the golden moment).
G. False Signals, or It could be a Golden Moment (better to see it on TF 15 or bigger):
- Near line 20 or 80 and yellow background = When Stoch RSI have the char R / H on color label, that's means divergence or hidden divergence for buy / sell position, if you not see this label that's means just a standard confirmation for buy / sell depends on where the Stoch RSI line if near 20 that's means buy, near 80 means sell
>> How to OPEN position:
A. Bullish
1. Trendlines Boll Ichi Crypto by Gammaprod
- The candles above the green cloud.
- Lagging span (red line) above the candles.
- then open buy near yellow line (the first option) / blue line (the second option) (always confirm the position with two other indicators below).
2. Stoch RSI Divs Zone Crypto by Gammaprod
- Teal or Green background.
- The lines is shaping green.
- Better if on the bottom (at a range 20).
3. MACD Volume Crypto by Gammaprod
- Teal or Green background.
- The lines is shaped or shaping green.
- Better if at the green histogram.
B. Bearish
1. Trendlines Boll Ichi Crypto by Gammaprod
- The candles below the purple cloud.
- Lagging span (red line) below the candles.
- then open buy near yellow line (the first option) / white line (the second option) (always confirm the position with two other indicators below).
2. Stoch RSI Divs Zone Crypto by Gammaprod
- Pink or purple background.
- The lines are shaping pink.
- Better if the line on the top (at a range 80).
3. MACD Volume Crypto by Gammaprod
- Pink or purple background.
- The lines are shaped or shaping green.
- Better if at the pink histogram.
C. Consolidation
1. Trendlines Boll Ichi Crypto by Gammaprod
- The candles on the cloud (green or purple).
- Lagging span (red line) on the candles.
- then open buy near the white or blue line (always confirm the position with two other indicators below).
2. Stoch RSI Divs Zone Crypto by Gammaprod
- Mix background specially on a timeframe 15m or more.
- The line move fast up and down.
- Better if on the bottom or the top of the lines (at a range 20 or 80).
3. MACD Volume Crypto by Gammaprod
- Changing the background.
- The line is near the middle line.
- Have small Histogram.
>> The secret ingridient is comparing the timeframe :
The example scalping (Timeframe 1m, 5m and 15m)
- TF 1m is for making an open position.
- TF 5m is for making a judgement of the trend market.
- TF 15m is to confirm that judgement from TF 5m, be careful if it not similar then it used to be a consolidation or the beginning of the reversal.
There's a lot a way to open the position than above information that i gave it to you, but consider there are a limit char on this column, I hope it will help your trading and make a more profit on it.

Options Volume Indicator
Volume Indicator for Option Trading, it is a simple indicator based on Relative Strength Index. There are two horizontal lines are mention 10 and -10, if bar crossed above the (Line 10) then go for buy and when Bar cross under (Line -10) go for sell side.
If Bar Color changed to Respective color of the previous bar i.e. color gets darker then you can exit/ trail SL there because it overbought / Oversold position and vice versa for Sell Side.
this volume indicator works on any Script.
The Black Floating Line indicates the Average volume

ValiantTrader_RSA VolumeINSTRUCTIONS:
-Add it to your chart then click on 3 dots in the indicator > move to > New pane below
Recommended Timeframes : M5, M15 and M30
When volume decrease and price also decrease, expect a bullish trend .
When volume increase and price decrease, expect a bullish trend .
When volume decrease and price increase, expect a bearish trend .
When volume increase and price also increase, expect a bearish trend .

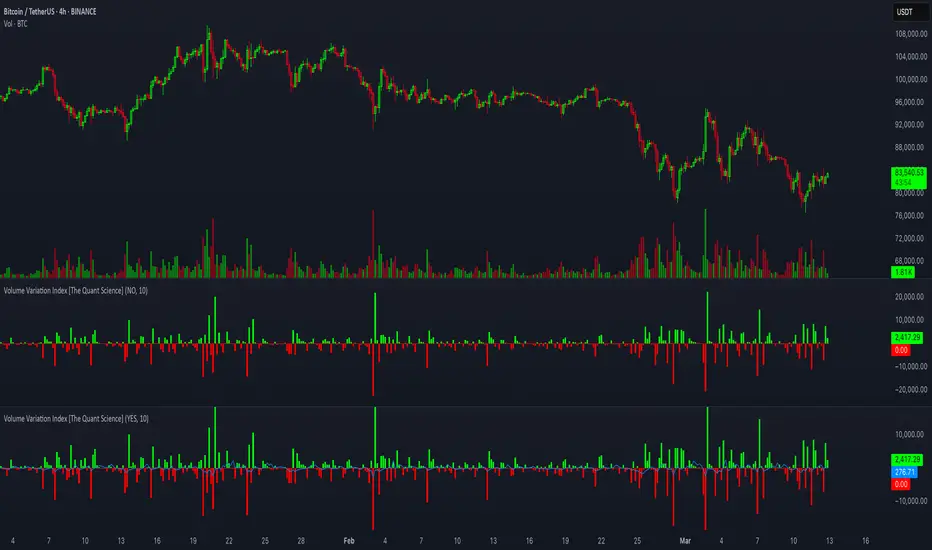
Volume Variation Index IndicatorThis tool is a quantitative tip for analysts who study volumes or create volume based trading strategies.
Like all our projects, we start with a statistical logic to which we add coding logic.
This indicator can save a huge amount of time in calculating the variation of volume between sessions .
How it work
The indicator calculates the difference between the volume of the last closing bar and the volume of the previous closing bar. It shows the difference between the trading volumes.
The session in which the trading volume is up are represented in green.
Red session represent trading volume down.
We have added a third function.
Through the User Interface the trader can activate or deactivate the variation average.
The indicator is able to calculate the average of the volume changes by representing it with a blue line.
To activate the average, simply set it to ON in the User Interface.
By default, the indicator calculates the average of the last 10 periods, but you are free to set this parameter in the User Interface.
Data access
To access the data, simply move the cursor. When you move the cursor over the green bars, the increase data will be displayed in green. By hovering the cursor over the red bars you will see the decrease data in red. By hovering the cursor over the average will show you the average data in blue.
The data is displayed in the top left corner of the indicator dashboard.
If you found this indicator helpful, please like our script.
Volume Breakout (ValueRay)Easy visuals on, if volume is way over average. Good for Mean Reverting. Higher Volume tends to higher breakout chances.
Please whisper me for for ideas how to make this better. Its a very simple script, but got some alpha. If you know how to improve, let me know and i will code it into.

KINSKI Flexible Volume OscillatorThe Volume Oscillator is a trend-oriented indicator that shows the strength or weakness of price trends. This indicator calculates the volume from two moving averages (MA). The value of the slow volume MA is then subtracted from the value of the fast moving average. The Volume Oscillator measures volume by analyzing the relationship between these two moving averages.
The special feature of this indicator is that the type of moving average can be selected as the basis for calculation. Currently, it is possible to choose between the following MA variants:
"COVWMA", "DEMA", "EMA", "EHMA", "FRAMA", "HMA", "KAMA", "RMA", "SMA", "SMMA", "VIDYA", "VWMA", "WMA".
Upward and downward movements are represented in different colors. The following color variants are available:
Color green: Strong upward trend
Color green/dark: weakening upward trend
Color red: strong downward trend
Color red/dark: weakening downward trend
The colors, as well as the style can be adjusted in the settings according to your own needs.

Colored Volume Bars standard deviation from meanThe colour bars:
Green: Price up - Volume > 2 x STD of last 21 bars
Blue: Price up - Volume > 1 x STD of last 21 bars
Maroon: Price down - Volume > 2 x STD of last 21 bars
Purple: Price down - Volume > 1 x STD of last 21 bars
Grey: not high volume bar
Green line: 2 bar sma
Red line: 8 period sma of the greenline
Bollinger band: 55 period sma of the 21 period sma with bands 1.618 deviation from the mean
