Weekday Close vs Open — Last N (per weekday)# Weekday Close vs Open - Last N Occurrences
This indicator distills every weekday's historical open-to-close behavior into a compact table so you can see how "typical" the current session is before the day even closes. It runs independently of your chart timeframe by pulling daily OHLCV data under the hood, tracking the last **N** completed occurrences for each weekday, and refreshing only when a daily bar closes. On daily charts you can also shade every past bar that matches today's weekday (excluding the in-progress session) to reinforce the pattern visually while the table remains non-repainting.
## What It Shows
- **Win/Loss/Tie counts** - how many of the last `N` occurrences closed above the open (wins), below (losses), or inside the tie threshold you define as "flat".
- **Win % heatmap** - the win column is color-coded (deep green > deep red) so you immediately recognize strong or weak weekdays.
- **Advanced metrics (optional)** - average daily volume plus the average percentage excursion above/below the open (`AvgUp%`, `AvgDn%`) for that weekday.
- **Totals row** - aggregates every weekday into one row to estimate overall hit rate and average stats across the entire data set.
- **Weekday shading (optional)** - on daily charts you can tint every bar that matches today's weekday (all Mondays, all Fridays, etc.) for instant pattern recognition.
## How It Works
1. The script requests daily OHLCV data (non-repainting) regardless of the chart timeframe.
2. When a new daily bar confirms, it packs that day's data into one of seven arrays (one per weekday). Each day contributes five floats (O/H/L/C/V) so trimming and statistics stay in lockstep.
3. A helper function (`f_dayMetrics`) scans daily history to compute average volume, average excursion above/below the open, and win/loss/tie counts for the requested weekday.
4. The table populates on the last bar of the chart session, respecting your advanced/totals toggles and keeping text at `size.normal`.
## Reading the Table
- **Win/Loss/Tie columns**: raw counts taken from your chosen `N`.
- **Win %***: excludes ties from the denominator so it reflects only decisive closes.
- **AvgUp% / AvgDn%**: typical intraday extension (high vs open, open vs low) in percent.
- **Avg Vol**: arithmetic mean of daily volume for that weekday.
- **TOTAL row**: provides a global win rate plus volume/up/down averages weighted by how many samples each weekday contributed.
## Practical Uses
- Spot weekdays that historically trend higher or lower before entering a trade.
- Compare current price action against the typical intraday range (`AvgUp%` vs today's move).
- Filter mean-reversion vs breakout setups based on the most reliable weekday patterns.
- Quickly gauge whether today is behaving "in character" by referencing the highlighted row or the optional whole-chart weekday shading.
> **Tip:** Use smaller `N` values (e.g., 10-20) for adaptive, recent behavior and larger values (50+) to capture longer-term seasonality. Tighten the tie threshold if you want almost every candle to register as win/loss, or widen it to focus only on meaningful moves.
Weekdays

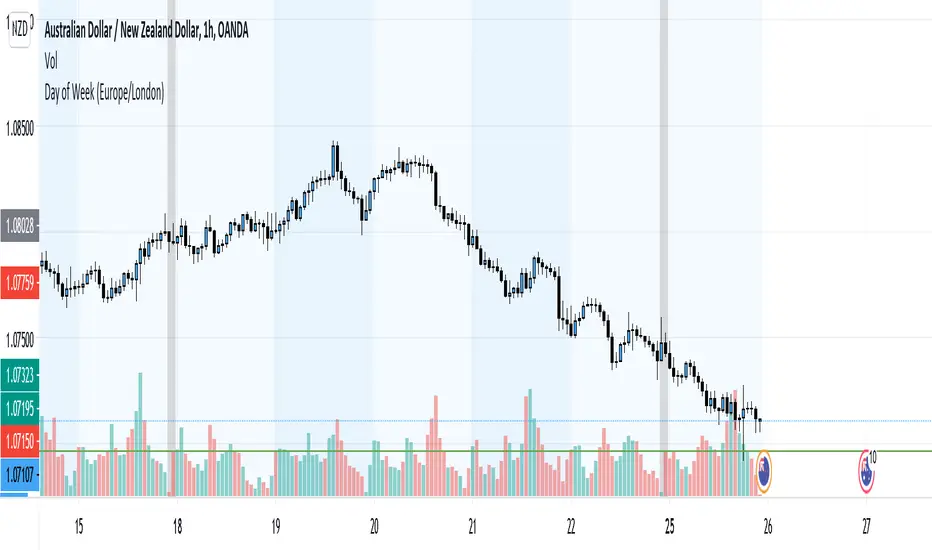
D|W|M|Y Breaks with NY TimezoneThis indicator plots breaks for multiple timeframes: Daily, Weekly, Monthly, Quarterly, Half Yearly, Yearly.
I also added the option to change timezone to New York to see the week the ICT way ;)

Weekday Change & Volume Average TableHaving a reference point for comparing with current data has always been an important task in market analysis. This script tried to give a better understanding based on weekdays.
This script shows that in the current ticker, what is the average movement of the price (High-Low) and volume for each weekday. Depending on the market and the exchange it should be different.
The Interesting point is that, for example in BINANCE:BTCUSDT , on Saturday and Sunday, volume is about 30% less and the price movement is about 20% less.
The script can be used on any timeframe and any symbol, just remember that the data shown is based on the candles on the chart, so it is different also based on your tradingview's account since Historical bars available for Basic is 5K, Pro & Pro+ is 10K and Premium is 20K; And in lower timeframes it is calculating more recent data.

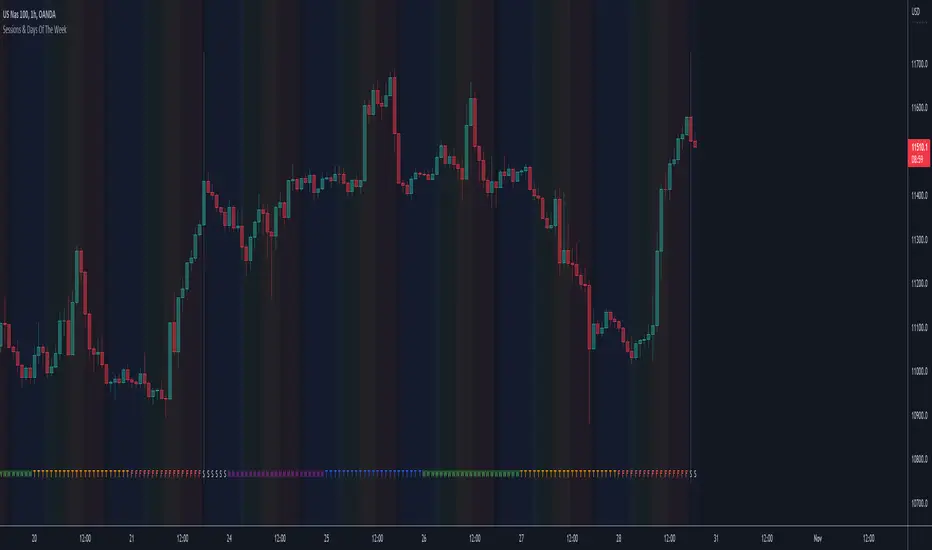
Sessions & Days Of The WeekTraders tend to focus their energy on specific sessions or time periods. This indicator will plot the days of the week, and also highlight the following sessions: Frankfurt (2:00am - 11:00am EST), London (3:00am - 12:00pm EST), New York (8:00am - 5:00pm EST), Sydney (5:00pm - 2:00am EST), Tokyo (7:00pm - 4:00am EST).
It’s important to be aware that Session Open and Close times will vary based on the time of year, as countries shift over to daylight savings time.
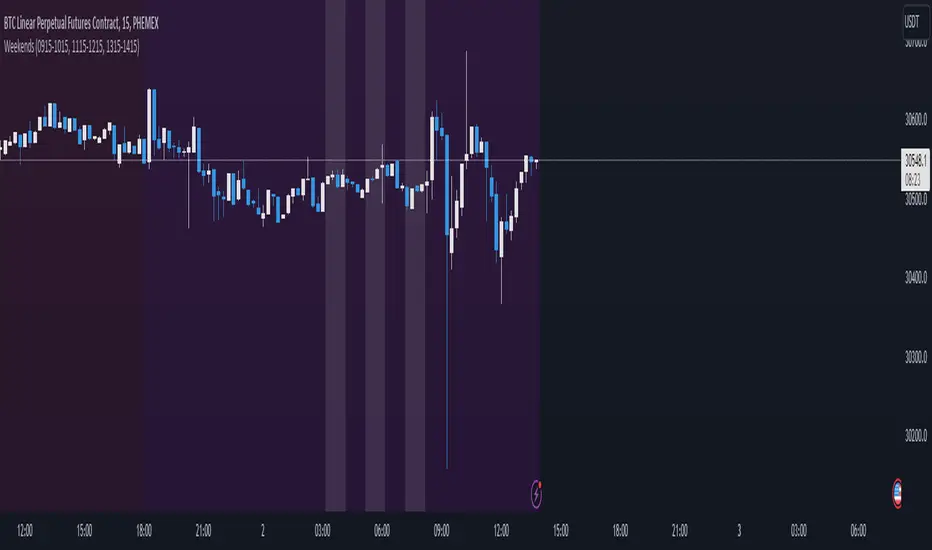
3GBH - WeekendsThis indicators simply highlights Saturdays & Sundays.
-----
You can toggle On/Off any or all of the options.
Pre and Market OpeningsPre and Market Openings is to enable you to quickly visualize the opening markets and how they could influence trading.
The below script has used the market time data from the below links:
Tokyo/Asia www.tradinghours.com
London www.tradinghours.com
New York www.tradinghours.com
The below script aims to plot:
Daily Asia Open
Weekly Asia Open
Daily London Open
Weekly London Open
Daily New York Open
Weekly New York Open
Using background colour it also shows market sessions (pre-market) for London and New York and regular for London, New York and Asia.
There is also plotted text for days of the week and sessions.
As you can see from the picture below that these market openings can act as support and resistance:
BTC
ETH