PLOW/PLHW (Potential weekly highs/lows)AP Capital – PLOW / PLHW (Potential Weekly Low / High)
This indicator highlights Potential Weekly Lows (PLOW) and Potential Weekly Highs (PLHW) in real time, using current-week price action, session context, and confirmed candle closes.
It is designed for intraday and swing traders who want early-week and late-week structure levels without repainting or hindsight bias.
🔹 How It Works
Potential Weekly Low (PLOW)
Detected during early week sessions
Triggers when price prints the current week’s lowest low
Confirmed only on candle close
Typically aligns with liquidity grabs, stop runs, or accumulation
Potential Weekly High (PLHW)
Detected during late week sessions
Triggers when price prints the current week’s highest high
Confirmed only on candle close
Often marks distribution or exhaustion zones
📊 Visual Elements
Clean weekly high & low levels
Optional weekly midpoint
Session-aware confirmation
Non-repainting labels
Minimalist layout (no clutter)
⚙️ Key Features
Works on any intraday timeframe
Fully non-repainting
Session-based logic (early vs late week)
Optional weekly range info panel
Suitable for Gold, FX, Indices, Crypto
🧠 Best Use Cases
Fade moves into weekly extremes
Combine with:
Previous Day High / Low
Liquidity sweeps
Market structure shifts
Identify high-probability reversals
Avoid chasing price late in the week
⚠️ Important Notes
This is NOT predictive — levels are confirmed from live price action
Best used as context, not a standalone entry system
Designed to complement price action & liquidity-based trading
📌 Disclaimer
This indicator is for educational purposes only.
Not financial advice. Always manage risk.
Weeklyhighlow

[GrandAlgo] MTF Historical Highs and LowsMany traders rely on weekly highs and lows to identify key market levels, but what if you could see how price reacted to these levels in past weeks, months, or even years? With MTF Historical Highs and Lows, you can visualize all past highs, lows, and midpoints from any timeframe, allowing you to refine your strategy and make more informed trading decisions.
This indicator retrieves and plots historical highs, lows, and midpoints based on a user-selected timeframe (default: Weekly). It dynamically updates, ensuring that all significant price levels remain visible on your chart. Additionally, smart filtering helps you focus only on relevant levels, and alerts notify you when price interacts with key zones.
Key Features:
✅ Automatically Fetches & Plots Historical Highs, Lows, and Midpoints
✅ Customizable Timeframes (default: Weekly, but adjustable)
✅ Visibility Filtering – Hides lines that are too far from the current price
✅ Alerts for Key Levels – Get notified when price touches an important historical level
✅ Customizable Colors & Display Preferences for clarity
How It Works:
1️⃣ Select a Date Range – Focus on historical levels that are most relevant to the current market conditions
2️⃣ Choose a Timeframe – Use Weekly, Monthly, or any timeframe that suits your strategy.
3️⃣ Enable Highs, Lows, and Midpoints – Customize what you want to see.
4️⃣ Adjust Filtering – Hide lines that are too far from the current price to reduce clutter.
5️⃣ Get Alerts – Be notified when price reaches a historical level for potential trade setups.
Ideal for Traders Who:
Trade Support & Resistance Levels – Understand how price reacts at historical highs and lows.
Analyze Market Structure – Identify key areas where price may reverse or break out.
Want Smart Alerts – Stay informed without staring at charts all day.

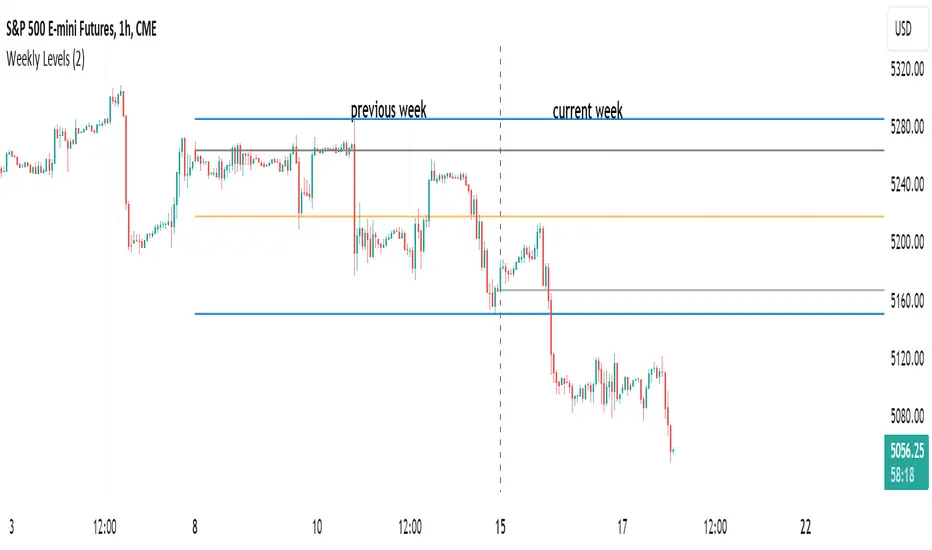
HT: Weekly LevelsIndicator draws several most important weekly levels on the lower timeframe: last week high/low, halfback, week close and current week open. These levels often act as support/resistance for price movements. Also, they can help to assess week character and control of power.
Indicator can be used on any timeframe, lower than weekly, for any type of instrument, including futures. It also provides an option to draw levels for any selected week back in time.
Important notes:
• Levels for the last week are drawn after the new week opens.
• Half-back is calculated as a middle line between week High and Low.
Parameters:
Date – user can select date, belonging to week, for which levels will be plotted. Works only if “Use” check box is on. Otherwise, levels will be plotted for the last week. (“time” value doesn’t matter; unfortunately, there is no way to hide the input box)
Time zone – your chart time zone (as UTC offset). Only needed if you use “Date” parameter.
Visuals – controls visibility and colors
Script is published as an open source. It uses two libraries: Levels Lib and Functions Lib. First one demonstrates how to work with pine-script object model and arrays. You can also reuse it in your custom scripts where there is need to construct any support/resistance levels. The second library contains some useful functions for working with time and dates.
Disclaimer
This indicator should not be used as a standalone tool to make trading decisions but only in conjunction with other technical analysis methods.
Bollinger Band with Moving Average & Pin BarsThis indicator was specifically built to be used for trading the Scalpius Trading System promoted by @scottphillipstrading. Additionally I've added Daily and Weekly Highs, Lows and Central Pivot lines
The central indicators used in the Scalpius trading system which are included here are: The Bollinger Band, chart plotting of Pin Bars (Hammers & Shooting Stars) and an Exponential Moving Average.
In the settings the user has the option select EMA, SMA or WMA along with desired length, the default settings are 8EMA as per the Scalpius system rules. Also the Bollinger Band settings can be amended by the user and the Pin Bar chart plots and daily + weekly high and low plots can be removed by the user.

Furious PivotsSimple script marking out quarter points plus weekly and daily highs and lows! pretty damn useful

Multi Range VWAP PivotsMulti Range VWAP Pivots turned out to be one of my most accurate pivot indicators to date!
Multi Range VWAP Pivots works by recognizing the high and low of the timeframe selected (D, W, M, 6M, and 12M) and plotting range high to VWAP averages and range low to VWAP averages.
After further examination of each completed range, I came to the conclusion that due to the nature of averages, high and low respectively would need to be completed within the current range, for the averages to actually display pivots correctly. This means that if all averages appear to be "pivoting" correctly after or during a break lower of higher, then we can only assume the most recent break higher or lower could be exhaustion and price will be reverted to the mean (VWAP). OR, this could be the most accurate hindsight indicator on the planet.
*DISCLAIMER*: This indicator repaints. DO NOT backtest or set alerts with this indicator.

Previous Day, Week, Month High/Low Line IndicatorMade a line indicator for previous Daily Weekly & Monthly High / Low. You can use all 3 (D,W,M) or just one by editing the settings.
