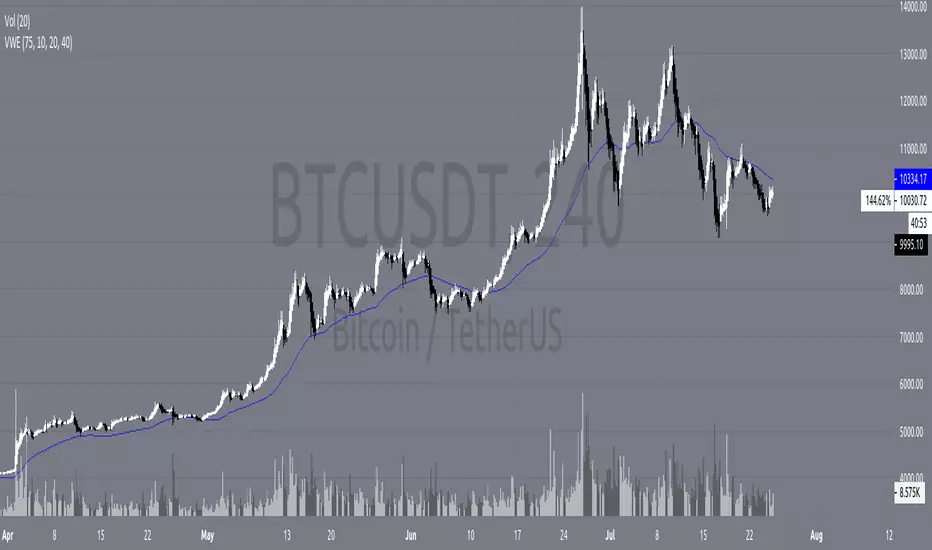
Volume Weighted EMAAn EMA using the Volume Oscillator to integrate volume fluctuations into the EMA calculations.
Especially useful for Crypto and Forex
Weighted
Volume Weighted Bollinger (Final, cleaned up visuals)Volume-weighted bollinger (normal stats application of weighting mean) with cleaned up visualization. Shaded area represents1sd-2sd move size for trailing 20 period average on timeframe for individual candles.
Volume Weighted Ichimoku (Cleaned Up Visuals)Ichimoku with cleaned up appearance on chart and volume-weighted highs / lows. Publishing this final version with open script.

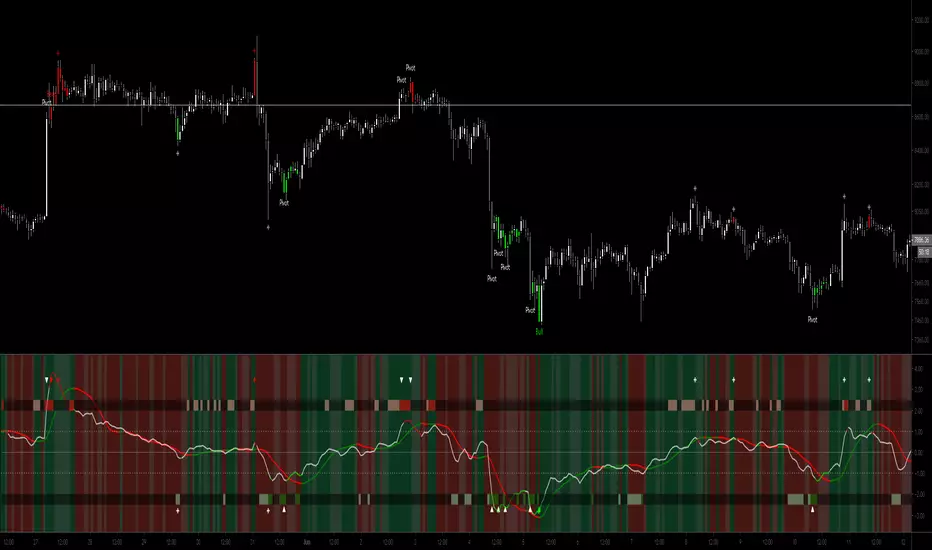
Cuban's VWAP DivergencesAfter using many different divergence scripts, I struggled to find one that didn't indiscriminately signal a constant divergence while the price was trending.
This study attempts to solve this issue, along with filtering out false signals. I have found it to print less signals and to be more accurate.
It also gives you a confluence level between high probability reversals (labels) and lower probability reversals (crosses), and some clever trade logic in the candle colouring -- to signal when to take the trade.
I have added a night mode for aesthetic label colouring and an option to minimise labels all together.
I recommend using this study in conjunction with one of my other scripts; Cuban's LTF Trend Oscillator.
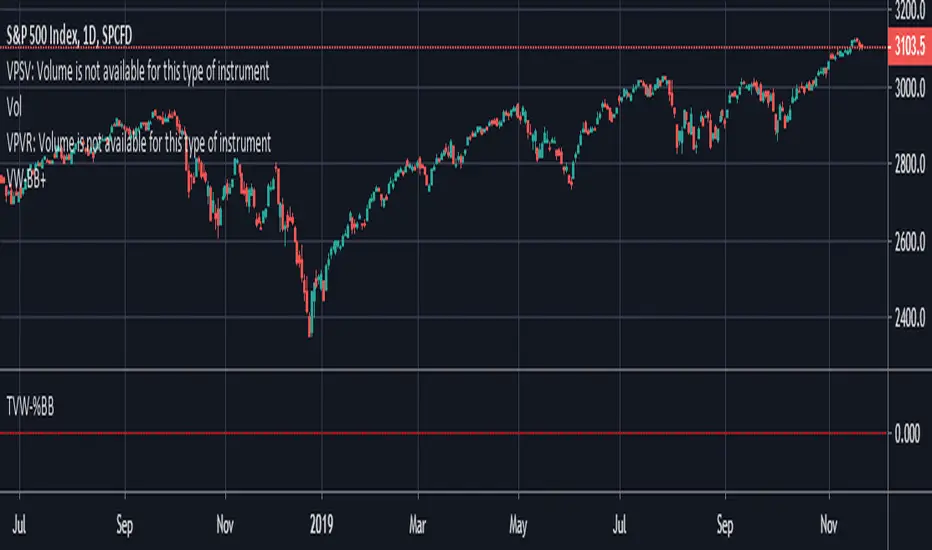
Multi-TF Avg BBandsMULTI-TF AVERAGE BBANDS - with signals (BETA)
Overall, it shows where the price has support and resistance, when it's breaking through, and when its relatively low/high based on the magic of standard deviation.
created by gamazama. send me a shout if u find this useful, or if you create something cool with it.
%BB: The price's position in the boilinger band is converted to a range from 0-1. The midpoint is at 0.5
Description of parameters
"BB:Window Length" is the standard BB size of 20 candles.
The indicator plots up to 7 different %BB's on different timescales
They are calculated independently of the timescale you are viewing eg 12h, 3d, 30m will be the same output
You can enter 7 timescales, eg. if you want to plot a range of bbands of the 12h up to 3d graphs, enter values between 0.5 and 3 (days) - you can also select 0 to disable and use less timescales, or select hours or minutes
Take note if you eg. double the main multiplier to 40, it is the same as doubling all your timescales
You can turn the transparency of the 7 x %BB's to 100 to hide them, their average is plotted as a thick cyan line
"Variance" is a measure of how much the 7 BB's agree, and changes colour based on the thresholds used for the strategy
---- TO START FROM SCRATCH ----
- set all except one to ZERO (0), set to 0, and everything after to 0.
Turn ON and right click -> move the indicator to a new pane - this will show you the internal workings of the indicator.
Then there is a few standard settings
"Source Smoothing Amount" applies a basic small sma on the price.
It should be turned down when viewing candles with less information, like 1D or more.
Standard BBands use an SMA, there one uses a blend between VWMA or SMA
Volume Weight settings, the same as SMA at 0, and the same as VWMA at 1
BB^2 is a bband drawn around the average %BB. Adjust the to change its window length
The BB^2 changes color when price moves up or down
Now its time to look at the parameters which affect the buy/sell signals
turn on "show signal range" - you see some red lines
buy and sell each have 4 settings
min/max variance will affect the brigtness of the signal range
range adjust will move the range up/down
mix BB^2 blends between a straight line (0) and BB^2's top or bottom (1)
a threshold of "variance" and "h/l points" is available to generate weaker signals.
these thresholds can be increased to show more weak signals
ONCE YOU ARE HAPPY WITH THE SIGNALS being generated, you can turn OFF , and move it back to the price pane
the indicator then draws a bband around the price to maps some info into the chart:
fills a colour between 0.5 & the mid BB^2 and converts relative to the price chart
draws a line in the middle of the midband.
controls how much these lines diverge from the price - adjust it to reduce noise
converts the signal range (red lines) to be relative to the price chart
if you like, you can adjust the sell & buy signals in the tab from and to and to match the picture. It messes with auto-scaling when moving back to though
enjoy, I hope that is easy enough to understand, still trying to make this more user-friendly.
If you want to send me some token of appreciation - btc: 33c2oiCW8Fnsy41Y8z2jAPzY8trnqr5cFu
I promise it will put a fat smile on my face


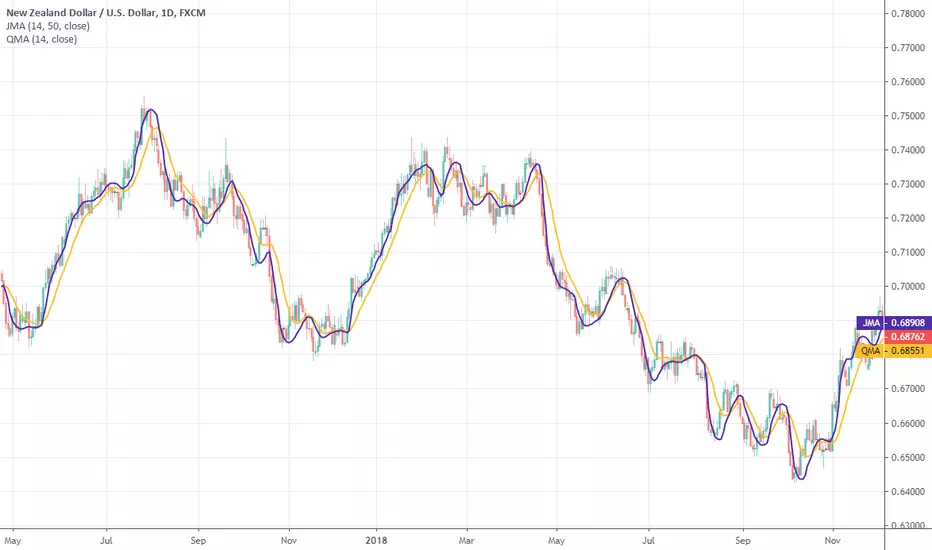
Quick Moving AverageThis moving average was originally developed by John McCormick in 2008 as NinjaTrader indicator. The purpose was to find a cheap replacement for JMA ( ).
Well, not impressive concerning the response.
Source code on request .
Self-Weighted Moving AverageThis type of moving average was originally developed by Alex Orekhov at his home. This WMA uses previous prices as weights for the new ones. At the moment, this is a highly experimental approach, so don't use it in real trading.
The weighting scheme is presented on the chart.

Jurik JMA/DWMA MACDHello friends,
Meet the Jurik JMA/DWMA MACD — an oscillator version of the crossover system originally recommended by Mark Jurik. It combines the Jurik Moving Average (JMA) and the Double Weighted Moving Average (DWMA) to form a smooth yet highly responsive convergence/divergence signal.
🛠 How It Works
Unlike standard EMA-based MACDs, this version uses Jurik's advanced non-lagging smoothing method to eliminate noise without sacrificing responsiveness , resulting in exceptionally clear and timely momentum readings.
I use the best original JMA clone available on TradingView — its behavior closely matches the genuine Jurik algorithm.
As Mark Jurik stated:
“Of all the different combinations of moving average filters to use for a MACD oscillator, we prefer using the JMA–DWMA combination.”
This oscillator measures the distance between JMA and DWMA, revealing when short-term momentum diverges from the longer-term trend. The result is a non-lagging MACD-style signal that highlights shifts in trend strength, early reversals, and exhaustion zones — all with Jurik-level smoothness and precision.
🔥 Key Features
Non-lagging, noise-reduced oscillator response
Peak highlighting
Built-in alerts for bullish and bearish peaks
If you'd like access or have any questions, feel free to reach out to me directly via DM.
👋 Good luck and happy trading!
Script a pagamento

Jurik JMA/DWMA CrossoverThis is a crossover system that was recommended by Mark Jurik. The system consists of Jurik Moving Average (JMA) and Double Weighted Moving Average (DWMA). In case of Jurik Moving Average I use the best original JMA' clone on TradingView that has the almost identical behaviour as the original one.
As Mr. Jurik noticed:
" JMA is ideal for the fast moving average line because it is quick to respond to reversals, is smooth and can be set to have no overshoot. DWMA (double weighted moving average) is ideal for the slower line as is tends to delay reversing direction until JMA crosses it."
Reference: www.jurikres.com

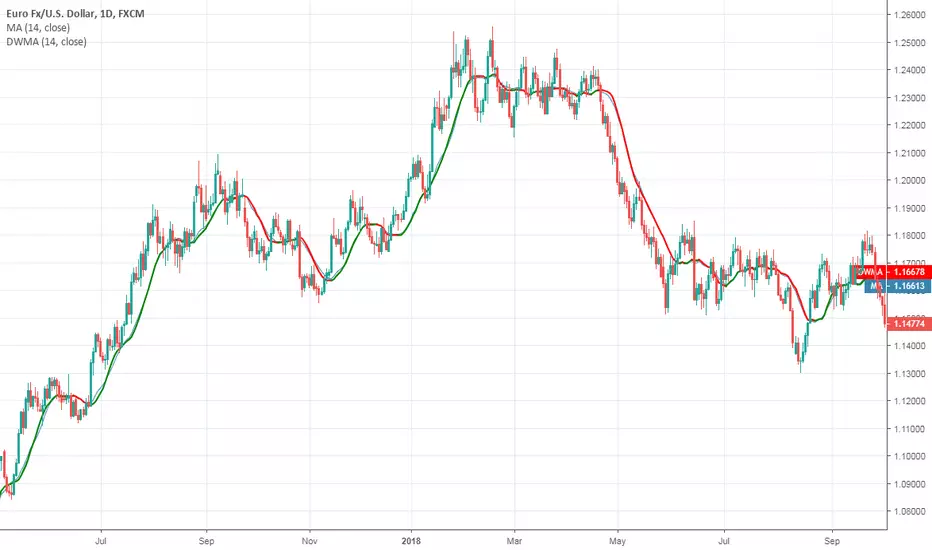
Double Weighted Moving AverageMr. Jurik uses this weighted moving average to create a crossover trading system with his JMA.
To learn more see www.jurikres.com .
Good luck!

Inverse Distance Weighted Moving AverageThe weights of this moving average are the sums of distances between points.
Good luck!

Distance Weighted Moving AverageAdopted to Pine from systemtradersuccess.com
They wrote that this average is designed to be a robust version of a moving average to reduce the impact of outliers, but I dont see a significant difference comparing it with SMA. So, I published it for the educational purposes.
To learn more about the robust filters and averages google Hampel Filter, Interquartile Range Filter and Recursive Median Filter (or any other filter that is based on quartiles).
Good luck!
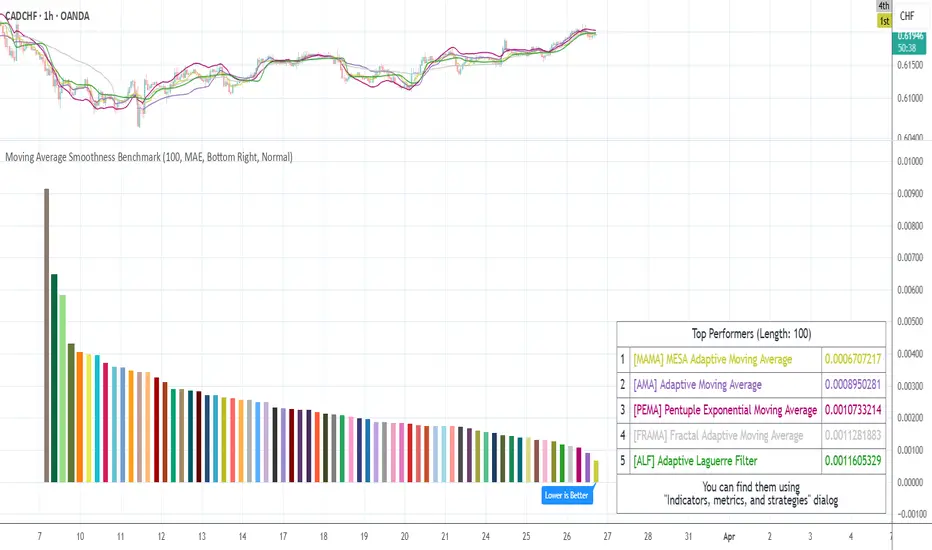
Moving Average Smoothness BenchmarkHey there!
This tool will help you to choose a moving average/filter that has the lowest lag throughout the whole history for the specified period.
What does it do?
It calculates the mean absolute errors for each moving average or filter and shows histogram with results. The lower error the lower lag of the moving average.
So, the best average will be at the end of the list of labels on the chart.
Settings
The main setting is a period for all moving averages.
Additionally, it allows to customize some multi-parametric moving average such as JMA, ALMA, McGinley Dynamic, Tillson's T3, REMA, Adaptive Laguerre Filter, Hampel Filter, Recursive Median Filter and Middle-High-Low MA.
NOTE : The results may vary on the different tickers and timeframes. This tool measures the performances on the current ticker and on the current timeframe.
Supported averages/filters (use short titles to match movings on the chart)
SMA, Simple MA
EMA, Exponential MA
WMA, Weighted (Linear) MA
RMA, Running MA (by J. Welles Wilder)
VWMA, Volume Weighted MA (by Buff P. Dormeier)
AHMA, Ahrens MA (by Richard D. Ahrens)
ALMA, Arnaud Legoux MA (by Arnaud Legoux and Dimitris Kouzis-Loukas)
ALF, Adaptive Laguerre Filter (by John F. Ehlers)
ARSI, Adaptive RSI
DEMA, Double Exponential MA (by Patrick G. Mulloy)
EDCF, Ehlers Distance Coefficient Filter (by John F. Ehlers)
EVWMA, Elastic Volume Weighted MA (by Christian P. Fries)
FRAMA, Fractal Adaptive MA (by John F. Ehlers)
HFSMA, Hampel Filter on Simple Moving Average
HFEMA, Hampel Filter on Exponential Moving Average
HMA, Hull MA (by Alan Hull)
HWMA, Henderson Weighted MA (by Robert Henderson)
IIRF, Infinite Impulse Response Filter (by John F. Ehlers)
JMA1, Jurik MA with power of 1 (by Mark Jurik)
JMA2, Jurik MA with power of 2 (by Mark Jurik)
JMA3, Jurik MA with power of 3 (by Mark Jurik)
JMA4, Jurik MA with power of 4 (by Mark Jurik)
LF, Laguerre Filter (by John F. Ehlers)
LMA, Leo MA (by ProRealCode' user Leo)
LSMA, Least Squares MA (Moving Linear Regression)
MD, McGinley Dynamic (by John R. McGinley)
MHLMA, Middle-High-Low MA (by Vitali Apirine)
REMA, Regularized Exponential MA (by Chris Satchwell)
RMF, Recursive Median Filter (by John F. Ehlers)
RMTA, Recursive Moving Trend Average (by Dennis Meyers)
SHMMA, Sharp Modified MA (by Joe Sharp)
SWMA, Sine Weighted MA
TEMA, Triple Exponential MA (by Patrick G. Mulloy)
TMA, Triangular MA
T3, (by Tim Tillson)
VIDYA, Variable Index Dynamic Average (by Tushar S. Chande)
ZLEMA, Zero Lag Exponential MA (by John F. Ehlers and Ric Way)
BF2, Butterworth Filter with 2 poles
BF3, Butterworth Filter with 3 poles
SSF2, Super Smoother Filter with 2 poles (by John F. Ehlers)
SSF3, Super Smoother Filter with 3 poles (by John F. Ehlers)
GF1, Gaussian Filter with 1 pole
GF2, Gaussian Filter with 2 poles
GF3, Gaussian Filter with 3 poles
GF4, Gaussian Filter with 4 poles
Good luck and Merry Christmas!
Fibonacci Weighted Moving AverageHello traders and developers!
The weights of this WMA are Fibonacci numbers. That's all)
Good luck and happy trading!

VW-MACDHello traders!
I am reading "Investing with Volume Analysis: Identify, Follow, and Profit from Trends" by Buff Pelz Dormeier so I am going to implement all indicators that are considered there.
VW-MACD was developed by Buff Pelz Dormeier in 2000 and is based on the difference between a short-term volume-weighted moving average and a long-term volume-weighted moving average. The signal line is traditionally left as an exponential moving average.
Like and follow for more cool indicators!
Happy Trading!

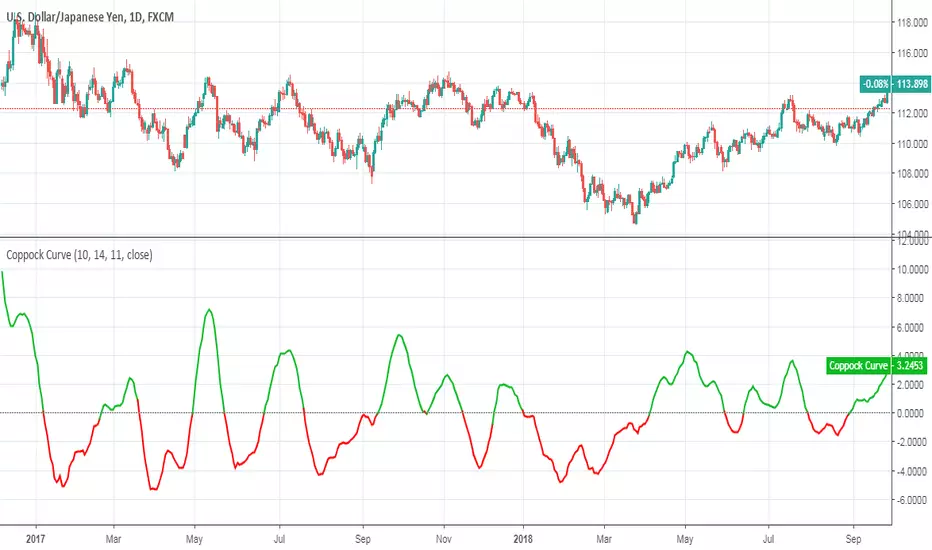
Coppock CurveThis indicator was originally developed by Edwin "Sedge" Coppock (Barron's Magazine, October 1962).
Specially for @AlexMayorov :
1) Buy when indicator crosses the zero line upside
2) Sell when indicator crosses the zero line downside
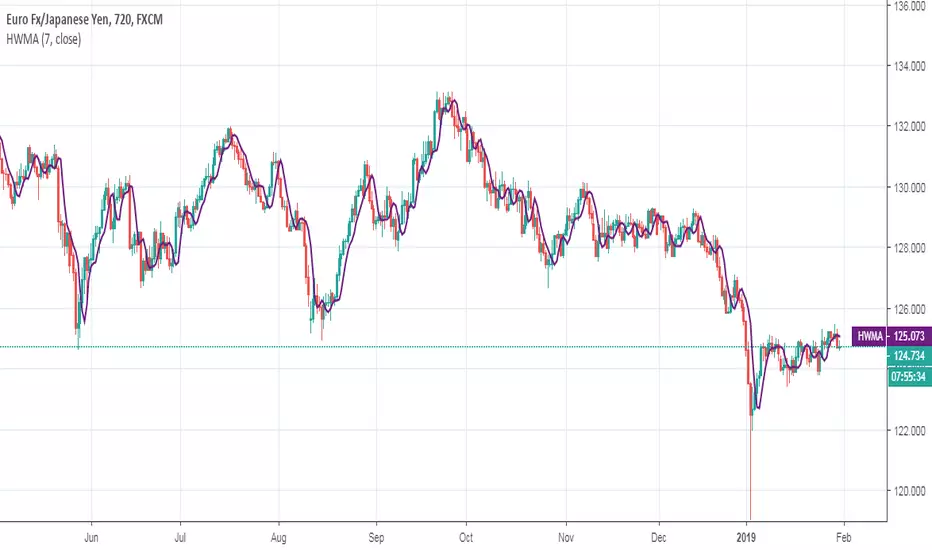
Henderson Weighted Moving AverageHenderson Weighted Moving Average script.
This indicator was originally developed by Robert Henderson in 1916 (Transaction of Actuarial Society of America, 17, pp. 43-48: Note on Graduation by Adjusted Average).
Spencer 21-Point Moving AverageSpencer 21-Point Moving Average script.
This indicator was originally developed by John Spencer in 1904 (J.I.A. 38, 334: On the graduation of the rates of sickness and mortality presented by the experience of the Manchester Unity of Oddfellows during the period 1893 - 1897).

Spencer 15-Point Moving AverageSpencer 15-Point Moving Average script.
This indicator was originally developed by John Spencer in 1904 (J.I.A. 38, 334: On the graduation of the rates of sickness and mortality presented by the experience of the Manchester Unity of Oddfellows during the period 1893 - 1897).

Mtu Macdalertcondition added to script
so u ll be able to put an alert when macd goes down or up to get alert from price movement up or down
when you are on indicator
right click via mouse
add alert
select mtu macdleader
then
select macd go up for buy signal
select macd go down for sell signal
use 4 hour or daily time frame for accurate results, also works better on down trend or uptrend not trade range because macd is a trend oscilator
lower time frame works too but u ll get to much alert and noise
no need if u rent a daytime trader

Hamming Windowed Volume Weighted Moving AverageApplying a window to the filter weights provides sometimes extra control over the characteristics of the filter.In this script an hamming window is applied to the volume before being used as a weight.In general this process smooth the frequency response of a filter.
Lets compare the classic vwma with hamming windowed vwma
Something i noticed is that windowed filters depending on their period ( high ones in general ) tend to make less bad crosses with the price ( at least with the hamming window )
Here are some data regarding number of crosses with period 50 with the hamming vwma in orange and the classic vwma in purple
Feel free to use the hamming window when using weighted filter.

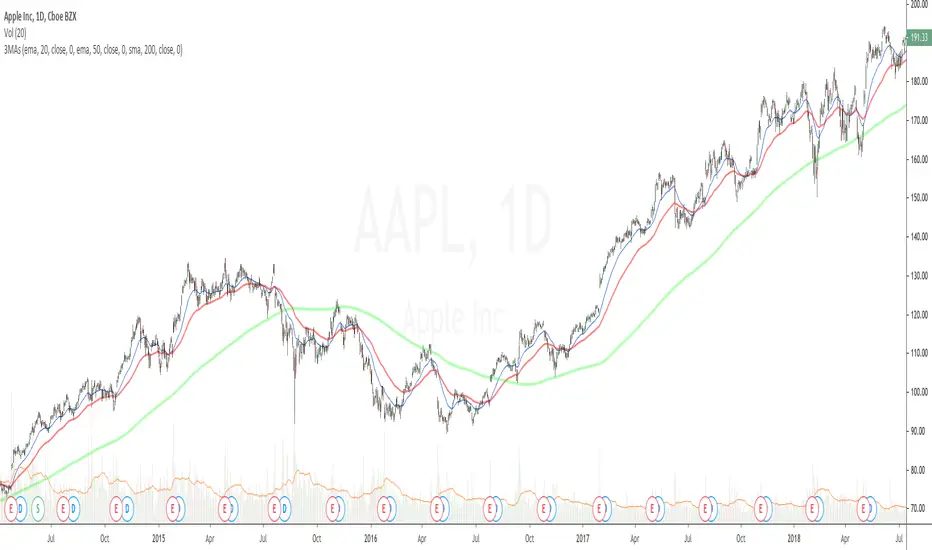
Three Moving AveragesThis is simply three moving averages in the same indicator, with the possibility to change the source, length, offset and type on every moving average (Simple, Exponential, Weighted, Volume-weighted, Triple EMA or a moving average that uses RSI ).
If you want to disable any of the moving averages, then do that under the "Style"-tab by unchecking the box for that moving average.