Liquidity Spike PoolThe “Liquidity Pools” indicator is a tool for market analysts that stands out for its ability to clearly project the intricate zones of manipulation present in financial markets. These crucial territories emerge when supply or demand takes over, resulting in long shadows (wicks) on the chart candles. Imagine these regions as "magnets" for prices, as they represent authentic "liquidity pools" where the flow of money into the market is significantly concentrated. But the value of the indicator goes beyond this simple visualization: these zones, when identified and interpreted correctly, can play a crucial role for traders looking for profitable entry points. They can mutate into important bastions of support or resistance, providing traders with key anchor points to make informed decisions within their trading strategies.
A key aspect to consider is the importance of different time frames in analyzing markets. Larger time frames, such as daily or 4h, tend to host larger and more relevant liquidity zones. Therefore, a successful strategy might involve identifying these areas of manipulation over longer time frames through the use of this indicator, and then applying these findings to shorter time frames. This approach allows you to turn manipulation zones into crucial reference points that merit constant surveillance while making trading decisions on shorter time frames.
The indicator uses color to convey information clearly and effectively:
- Dark blue lines highlight candles with significant upper wick, signaling the possible presence of an important manipulation area in the considered area.
- Dark red lines are reserved for sizable candlesticks with significant upper wick, emphasizing situations that are particularly relevant to traders.
- Dark gray lines highlight candles with significant lower wick, providing a valuable indication of manipulation zones where the bid may have prevailed.
- White lines highlight sizable candlesticks with significant lower wick, clearly indicating situations where demand has been predominant and may have helped form a liquidity pool.
This indicator constitutes an important resource for identifying and clearly displaying candles with significant wicks, allowing traders to distinguish between ordinary market conditions and circumstances particularly relevant to their trading strategies. Thanks to the distinctive colors of the lines, the indicator offers intuitive visual guidance, allowing traders to make more informed decisions while carrying out their analyses.
Wickoff

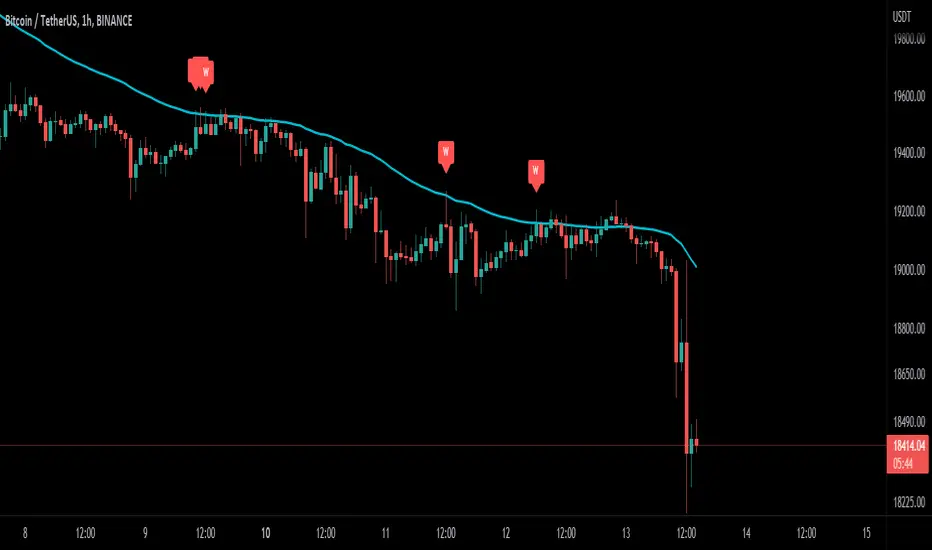
Wick-off Check Moving Average [Misu]█ This Indicator shows a wick-off check pattern applied to a moving average.
This pattern appears when a candle opens below the moving average and closes above it, or when it opens above a moving average and closes below it. This causes a wick to go through the moving average: a wick-off check moving average.
█ Usages:
This indicator detects small pullbacks in a trend. This is mainly used for trading continuation strategies.
It can also be used to validate a resistance or support level .
█ Features:
> Average Wick Validation: You can validate a wick-off check pattern depending on the average wick size. This is configured with parameters "Lenght Avg Wick Validation" and "Factor Wick Validation".
> Trend Validation: A trend is taken into account when detecting a "continuation pattern". A trend is validated if X candles close above (up trend) or under (down trend) the moving average. This "X" is defined by "Length Bar - Trend Validation" parameter.
> Buy and Sell: Labels are showing wick-of check patterns but can be interpreted as a buy & sell signal.
> Multi Moving Average.
> Alerts.
█ Parameters:
Method Multi MA : The method for calculating the moving average.
Multi MA Length : The length used to calculate the moving average.
Length Bar - Trend Validation : Define the number of bar needed to validate a trend. When price is above the MA, trend is up. When price is under MA, trend is down.
Wickoff Mode : Mode used to detect Wickoff check pattern.
> continuation pattern: only shows wick-off check pattern in a confirmed trend.
> no trend in progress: only shows wick-off check pattern in a not confirmed trend.
> both: shows both.
Lenght Avg Wick Validation : Lenght used to calculate the average wick size.
Factor Wick Validation : Factor used to validate the length of a wick when a wick-off check is detected.
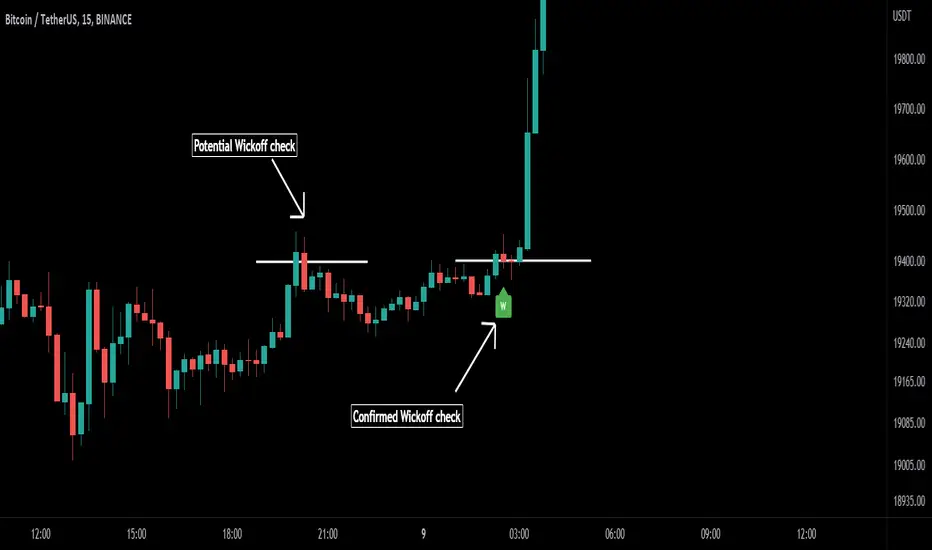
Wick-off Check Pattern [Misu]█ This Indicator shows a wick-off check pattern.
This pattern appears when a candle goes below a level (support or resistance) and closes above it OR when it goes above a level and finishes below it. This causes a wick to go through the level: a wick-off check .
This can confirm a pullback or a breakout.
█ Usages:
This indicator can be used to validate a resistance or support level.
It can also be used to validate breaking levels.
█ Parameters:
Deviation: Parameter used to calculate pivots.
Depth: Parameter used to calculate pivots.
Wickoff Mode: Mode used to detect Wickoff check pattern.
> counter pattern: only shows "pullback" wickoff check.
> breakout pattern: only shows "breakout moves" wickoff check.
> both: shows both.
Lenght Avg Body: Lenght used to calculate the average body size.
First Breakout Factor:
Lenght Avg Wick Validation: This factor multiplied by the "body avg" filters out the non-significant breakout.
Factor Avg Wick Validation: Lenght used to calculate the average wick size.
Max Bars Wickoff: This factor multiplied by the "wick avg", filters out the non-significant wickoff signals.