Volume Buzz - Real-Time Relative Volume MonitorDon't trade in the dark—know if the market is paying attention.
This indicator displays a simple dashboard on your chart that tells you if the current volume is Higher or Lower than the 20-day average for this specific time of day.
Green Text: High Relative Volume (RVol > 1). Good for spotting breakouts and momentum.
Red Text: Low Relative Volume (RVol < 1). Indicates consolidation or lack of interest.
Includes an optional "Realtime Adjustment" to predict the volume closing value before the bar actually closes.
X-volume
Penny Stock Golden Cross ScannerPenny Stock Golden Cross Scanner
Scan and track potential breakout opportunities in penny stocks with this Golden Cross Scanner. Designed for traders looking at low-priced, high-volume stocks, this indicator identifies bullish setups using 50, 100, and 200-period moving averages.
Key Features:
✅ Monitors up to 10 user-defined tickers.
✅ Filters penny stocks by maximum price and minimum volume.
✅ Detects proximity to 100 MA and 200 MA for potential golden cross or support/resistance signals.
✅ Assigns signal tiers for each stock (Tier 1 🔥, Tier 2 ⚡, Tier 3 📊) based on price action relative to moving averages.
✅ Customizable scanner table with position options on the chart.
✅ Real-time plotting of 50, 100, and 200 moving averages for context.
✅ Option to display only stocks currently generating signals.

Wyckoff + VSA Ultimate - Complete Market Analysis
**Wyckoff + VSA Ultimate** combines three proven methodologies into one powerful indicator:
🔷 **Wyckoff Method** - Identifies market accumulation and distribution phases
🔷 **Volume Spread Analysis** - Confirms moves with volume and price spread
🔷 **Random Walk Index** - Validates trend strength and direction
**MAIN SIGNALS:**
📊 **Wyckoff Signals** (Green = Bullish, Red = Bearish)
• SC (Selling Climax) - Major buying opportunity
• BC (Buying Climax) - Major selling opportunity
• AR (Automatic Rally) - Confirms accumulation
• DAR (Automatic Reaction) - Confirms distribution
• ST (Secondary Test) - Final test before move
📊 **VSA Patterns**
• Upthrust bars (weakness after rally)
• Reverse upthrust (strength after decline)
• No demand/supply bars
• Stopping volume
• Effort failures
**KEY FEATURES:**
✅ Multiple signal confirmation reduces false signals
✅ Real-time info table shows phase, volume, trends
✅ Dynamic stop loss levels calculated automatically
✅ Accumulation/Distribution boxes on chart
✅ Customizable filters for your trading style
✅ 12 alert conditions for all major signals
**HOW TO USE:**
For Swing Trading (4H/Daily):
1. Enable "Require VSA Confirmation"
2. Wait for SC or BC signals
3. Use displayed stop levels
4. Target next opposite phase
For Day Trading (15m/1H):
1. Enable "Require Trend Confirmation"
2. Trade only trend-aligned signals
3. Increase volume threshold to 1.5
4. Use tighter risk management
**BEST FOR:**
✅ Stocks (high volume)
✅ Forex majors
✅ Crypto (BTC, ETH)
✅ Index futures
**SETTINGS:**
Customize everything:
• RSI & Pivot parameters
• Volume & Spread analysis
• Trend periods (RWI)
• Signal filters
• Visual display options
**ALERTS:**
Pre-configured alerts for:
• All Wyckoff signals
• VSA reversals
• Strong buy/sell combinations
**Credits:** Integrates Wyckoff (faytterro) and VSA (theehoganator) methods.
**Disclaimer:** Educational purposes only. Use proper risk management. Past performance doesn't guarantee future results.
---
Pine Script™ v6
---

BankNifty Aggregate Weighted OBVDescription-
This indicator calculates the aggregate On Balance Volume (OBV) of the entire Bank Nifty Index by analyzing its 12 individual constituents rather than the index futures volume.
Why is this different?
Standard OBV on the Bank Nifty Index usually analyzes the volume of the Index Futures or the raw index volume (which can be inaccurate or derivative-heavy). This script queries the real-time volume and price action of the 12 specific banks that make up the index (HDFC, ICICI, SBI, Axis, Kotak, etc.).
How it works-
Weighted Calculation:- It calculates the Net Flow (Volume * Weightage) for every single bank for the current bar.
Aggregation:- It sums the Net Flow of all 12 banks to create a "Total Sector Flow."
Accumulation:- It generates the OBV line based on this aggregated sector flow.
Normalization:- Unlike simple summation scripts, this calculates flow per bar before accumulating, ensuring that stocks with longer trading histories do not skew the data.
Features:
Customizable Weights:- Users can adjust the weightage of each bank if NSE rebalances the index.
Toggle Constituents:- You can turn specific banks on/off to see their impact.
Signal Line:- Includes an SMA/EMA signal line to help identify volume trend reversals.
Trend Coloring:- The fill color changes (Green/Red) based on the OBV's position relative to the signal line.
How to use:
Trend Confirmation: If Bank Nifty price is rising but this Weighted OBV is falling, it indicates a divergence and potential weakness in the move (lack of institutional participation).
Breakouts: Use the Signal Line crossover to validate breakout moves.

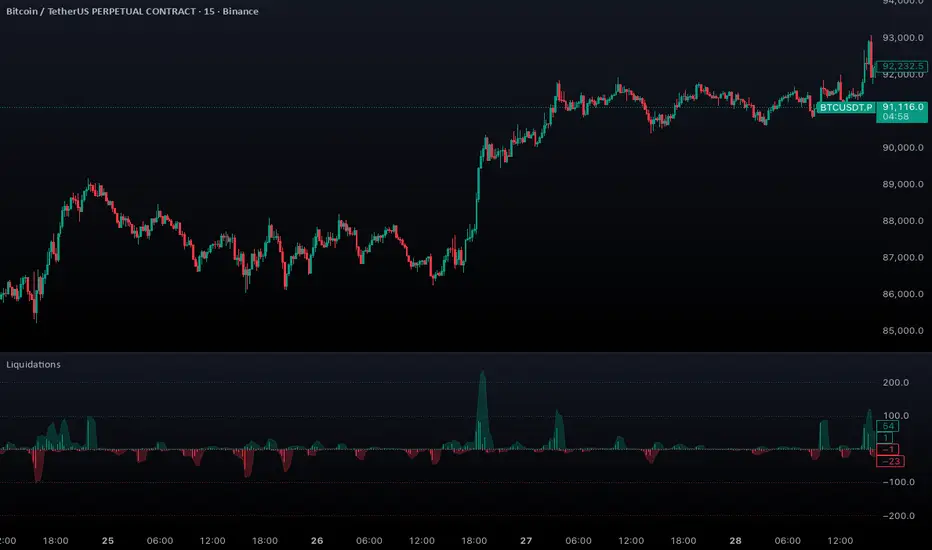
Aggregated Liquidations by ktp. GonzoAggregated Liquidations combines real-time liquidation data from multiple major futures exchanges into a single, unified view. This tool helps traders identify liquidation clusters, squeezes, and high-impact forced-exit events that often mark key reversal or continuation points.
This script delivers a clean, aggregated perspective on one of the most impactful forms of market data—providing clarity during volatile, liquidation-driven moves.
Supported Exchanges
Binance: USDT, USDC, USD
BitMEX: USDT, USD
Bybit: USDT, USDC, USD
Deribit: USDC, USD
HTX: USDT, USD (optional, tick-volume based)
OKX: USDT, USDC, USD (partially reported liquidations)
Toggle each feed individually for complete control over your data sources.
Features
Combined Long & Short Liquidations from all enabled exchanges
Configurable Currency Mode to show liquidation volume in base or quote currency
Adjustable Accumulation Window in bars, minutes, hours, or days
Threshold Lines to quickly spot abnormal liquidation spikes
How to Use
Track liquidation cascades across multiple venues
Spot potential long/short squeezes before price reacts
Identify exhaustion zones where forced liquidations dominate
Combine with order flow, volume, or momentum tools for confirmation
Magic Swing Suite: Trend, Pullback & Risk DashboardMagic Swing Suite: Trend, Pullback & Risk Dashboard
This indicator is a complete Swing Trading System designed to identify high-probability trend continuation setups. It combines classic trend-following principles with a unique "3-Bar Retest" logic and provides a real-time Strategy Dashboard to help you manage positions without needing a separate strategy script.
How it Works:
The system looks for a "Confluence" of factors before generating a signal. It scores every bar out of 140 points based on the following criteria:
Trend Alignment: Price must be above EMA 10, and EMA 10 must be above EMA 20.
Momentum (RSI): RSI must be in the "Bullish Control Zone" (60-80) and above its SMA.
Volume: Volume must be significantly higher than the average (1.5x by default).
The "Magic" Retest: The script checks the last 2-5 bars to see if the price has pulled back to "kiss" the EMA 10. This ensures we are buying a dip in a trend, not chasing a top.
Breakout Confirmation: Checks for Darvas Box breakouts and price position relative to Pivot R1.
Features:
🎯 Virtual Strategy Dashboard: A table that mimics a strategy tester. It tracks Entry, Stop Loss (Trailing), Target 1, and Target 2 in real-time.
📊 Confluence Scorecard: A detailed table showing exactly why a signal was (or wasn't) generated (Trend, Retest, RSI, Volume, etc.).
🛡️ Risk Management: automatically calculates a Trailing Stop (EMA 10) and fixed Risk:Reward targets based on recent highs.
📉 Multi-Layered Overlays: Includes Auto-Pivots (Traditional, Fib, Woodie, etc.) and Darvas Boxes to identify support/resistance levels.
How to Use:
Wait for a Signal:
"FULL BUY SIGNAL" (Green): All conditions are met, including a recent retest of the EMA. This is the highest probability setup.
"BUY - NO RETEST" (Orange): Trend and momentum are strong, but price hasn't pulled back recently. Use caution, as this may be a breakout trade.
Monitor the Dashboard: Once a trade is active, the dashboard will change to "IN POSITION." Follow the "Action" row.
If the trend weakens, the Trailing Stop (EMA 10) will move up to protect profits.
Targets:
T1: Previous Swing High (or 5% if no high found).
T2: 1:1.6 Risk/Reward extension.
Settings:
Volume Spike Factor: Adjust how much volume is needed to confirm a move. Default is 1.2.
Retest Tolerance: Adjust how close the price needs to get to the EMA 10 to count as a "retest."
Dashboard Toggles: You can hide the tables if you prefer a clean chart.
Pivot Timeframes: customizable lookback for S/R levels.
FAQ:
Does this repaint?
No. All signals trigger only on confirmed bars.
Can I use this intraday?
Yes. Works great from 5m to 1D.
Are exits manual or automated?
The indicator tracks SL, T1, and T2, and marks them on the chart.
Does retest affect the buy signal?
Retest is optional. The buy logic does not require it, but adds weight to the score.
Disclaimer: This tool is for educational purposes only. The "Strategy Dashboard" is a simulation based on script calculations and does not execute real trades. Always manage your own risk.

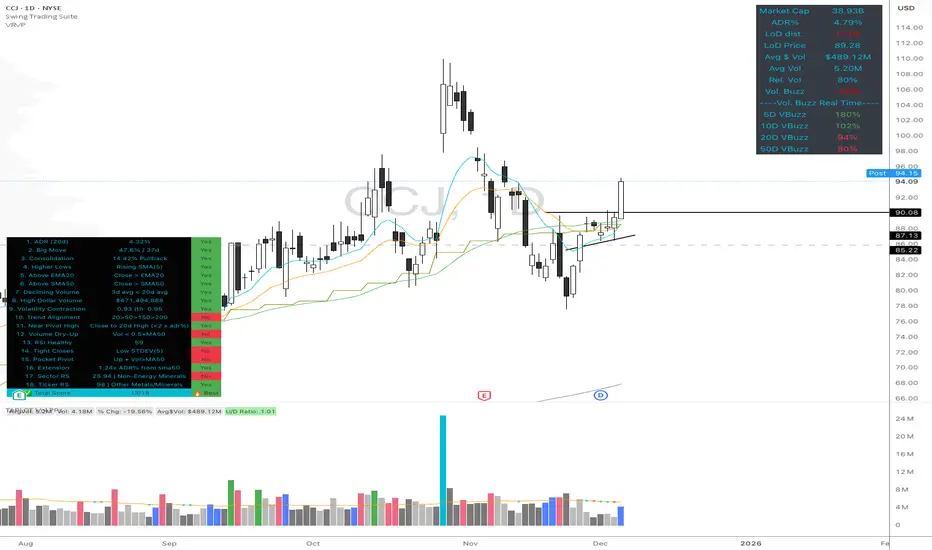
ADR / $Volume DashboardSee 5 / 20 days ADR / Volume and price %age from low of day on top of the chart

Low-Volume Trend Reversal ProLow-Volume Trend Reversal Pro 的核心设计目标,是让交易者能更容易识别“低量变盘”与“高量趋势衰竭”这两类极其关键的市场信号。在趋势的发展过程中,最早发生变化的往往不是价格,而是成交量,也就是市场参与者的真实意愿。当量能突然变得极低时,通常意味着市场在当前价位已经不愿意继续推动趋势,无论是买方还是卖方都表现出明显的“无兴趣”,这种状态往往会发生在趋势进入末期、震荡前夕、反转开始之前。很多顶部和底部在价格上看起来依旧正常,但量能已经率先“退潮”,而这种低量行为正是行情准备改变方向的标志之一。通过对这些异常区域的高亮和标记,指标让交易者更早察觉趋势内部正在失去动力。
与低量信号相反,另一类值得高度关注的结构是“高量趋势结束”。极端高量看起来像是强势,但在趋势后半段,它往往代表的是趋势的耗尽、最后的冲刺或终结点。高量常出现在突破失败之前、反转前最后一跳、以及主力出货或吸引散户接盘的阶段。当市场在单一区域短时间内出现过高密度的成交,意味着大部分力量已经在此释放,后续难以再延续相同速度的趋势。这类高量行为往往不是趋势开始,而是趋势即将终结的信号。指标通过视觉化处理,将这些“过度活跃”的时刻从普通放量中区分出来,让交易者能更准确判断趋势是否仍然健康。
无论是极低量还是极高量,它们都揭示了“价格背后真实的交易意愿”。价格只是表面结果,而量能代表的是参与者是否愿意继续投入资金。当参与度下降时,趋势会在内部先断层;当参与度过度集中时,也往往意味着趋势已经走得太远。Low-Volume Trend Reversal Pro 的作用,就是把这种隐藏在价格背后的“真实态度变化”以最直观的方式呈现出来,而不是预测市场未来方向。对于使用趋势、结构、量价分析的交易者来说,它提供了一套稳定、客观的观察框架,让你在趋势即将结束时更及时警觉,也能在趋势健康时更有底气地持仓。
Low-Volume Trend Reversal Pro is designed with one goal in mind: to help traders identify two critical but often overlooked signals—low-volume reversal conditions and high-volume trend exhaustion. During the life cycle of a trend, volume often shifts earlier than price, revealing the true intentions of market participants before any visible price reaction. When volume collapses to unusually low levels, it often indicates that neither buyers nor sellers are willing to push the market further. This lack of commitment tends to appear near the end of a trend, ahead of consolidation phases, or before a reversal begins. Many tops and bottoms look completely normal on price, yet internally the market has already “gone quiet.” By highlighting these moments, the indicator helps traders detect fading momentum and weakening structure long before it becomes obvious to the crowd.
On the opposite end of the spectrum, extreme high-volume behavior can signal the exhaustion of a mature trend rather than strength. When participation becomes too concentrated within a short window, it often reflects the final push of buyers or sellers, peak activity, aggressive profit-taking, or even distribution to late participants. These high-volume spikes frequently appear right before failed breakouts, last-minute surges, or transition points into reversal. They do not represent healthy continuation but rather the final stage of an overextended move. The indicator visually distinguishes this type of abnormal activity from ordinary volume expansion, helping traders judge whether a trend is accelerating or burning out.
Both low-volume and high-volume signals offer insight into something price alone cannot reveal: the willingness of market participants to continue driving the trend. Price is only the final outcome; volume expresses actual intent. When participation fades, trends weaken internally before price reacts. When participation peaks excessively, the trend becomes unsustainable. Low-Volume Trend Reversal Pro does not predict future movements. Instead, it surfaces these underlying shifts in a clean and objective way, giving traders a clearer understanding of trend quality. For those who rely on structure, trend analysis, or volume-based decision-making, it adds a valuable layer of confirmation and helps improve timing around potential turning points.

Volume with VSAThis script is designed to identify meaningful volume activity using the principles of Volume Spread Analysis (VSA). By focusing on the relationship between price movement and volume, it highlights areas where professional traders may be active. The tool becomes especially powerful when applied to higher timeframes such as 15-minute or 30-minute charts. On these larger intervals, market noise is reduced, allowing true supply and demand imbalances to stand out more clearly. As a result, the zones and signals generated by the script tend to be more reliable and consistent. The combination of structural analysis and volume behaviour helps traders pinpoint potential trend reversals, continuation patterns, and breakout strength with greater accuracy. Overall, this script enhances decision-making by offering a clearer view of genuine market participation, making it well-suited for swing traders, intraday strategists, and anyone looking to understand volume dynamics more effectively.

Low Volatility Profiles [BigBeluga]🔵 OVERVIEW
Low Volatility Profiles is a market compression and breakout-anticipation tool that identifies phases of low volatility using ADX and then builds a real-time volume profile inside the detected range.
This helps traders spot accumulation/distribution zones and prepare for explosive moves when volatility expands.
When volatility is low ➜ price coils ➜ volume organizes ➜ breakouts become highly actionable.
This tool visualizes that process with dynamic range boxes + volume bins + PoC extension.
🔵 CONCEPTS
Low-Volatility Detection — Uses ADX threshold & cross logic to define volatility contraction regimes.
Range Construction — Draws a price box that expands with highs/lows during the compression phase.
Micro Volume Profile — Builds a volume histogram inside the range using bins (micro volume nodes).
Delta Calculation — Tracks positive vs negative volume to gauge buyer/seller pressure within range.
Point of Control (PoC) — Highlights the price level with max traded volume inside the range.
PoC Extension — Optionally extends PoC into future bars to show potential reaction zone after breakout.
Breakout Validation — Ends the profile zone when price breaks above or below the modeled range.
Noise Removal — Automatically removes invalid or small ranges to prevent chart clutter.
This tool turns consolidation into actionable structure by exposing where smart money accumulates before trending moves.
🔵 FEATURES
ADX-Driven Range Detection — Identify when market transitions into low-volatility compression.
Configurable ADX Threshold — Set sensitivity for contraction zones.
Cross-Type Option — Detect low volatility via cross under / crossover logic.
Dynamic Range Box — Expands live with price as contraction unfolds.
Micro Volume Profile (Bins) — Distributes volume across bins inside range for micro POC mapping.
Volume Delta Visualization — Shows imbalance inside consolidation (accumulation vs distribution).
Real-Time PoC Highlight — Instantly shows most traded price inside the compression.
PoC Extension Mode — Extend PoC forward to project reaction levels post-breakout.
Clean Auto-Reset Logic — Removes boxes if range invalid or breakout occurs too fast.
Optional Filled Boxes — Heatmap-style profile visualization inside range body.
ADX Line + Threshold Plot — Visual assistance for volatility state monitoring.
🔵 HOW TO USE
Identify Accumulation Zones — When price enters low-volatility ADX condition and profile builds.
Watch the PoC — PoC acts as battle zone; move above/below can signal initiator strength.
Breakout Strategy — Trade break above/below the range after compression.
Mean Reversion Inside Range — Fade edges while price remains inside compression box.
Combine With Trend Tools — Use trend confirmation (MA/EMA/Flow indicators) after breakout.
Use Delta Clues — Positive delta tilt suggests accumulation; negative suggests distribution.
Monitor Range Size — Longer build + high PoC volume = stronger potential breakout energy.
🔵 CONCLUSION
Low Volatility Profiles isolates accumulation phases and maps volume concentration before volatility expansion.
By combining ADX compression, micro volume distribution, and PoC tracing, traders gain an edge in anticipating powerful breakout cycles and institutional positioning.
Trade the quiet moment before the storm — where smart money prepares the move, and the real opportunity emerges.

Smart Accumulation Lite – US SmallCap EditionSmart Accumulation Lite — US SmallCap Edition
A simplified, footprint-based accumulation indicator designed for small- and mid-cap U.S. stocks.
No Ultra mode. No predictions. Pure structural reading.
🔹 What the Lite version does
The Lite version focuses only on PRE (Pre-Accumulation) and ACC (Accumulation) footprints.
By removing Ultra mode and advanced filters, the script becomes lighter, faster, and easier to interpret.
PRE dots act as the earliest structural signs that prior sponsorship is still present.
ACC marks periods of stronger, more active participation under favorable structural conditions.
(← 여기 ACC만 변경됨 / “매집 흔적” 대신 “활발한 활동”)
🔹 Why PRE behaves the way it does
PRE is not a buy signal — it is a structural continuity marker.
It tends to keep printing during sustained healthy uptrends because structural footprints remain on the tape.
But when a trend breaks — forced selling, panic flushes, heavy unloading —
the underlying flow no longer matches accumulation conditions, so PRE naturally stops printing.
→ If PRE keeps showing up, structure remains healthy.
→ If PRE dries up while price is pushing or stalling, it is an early structural warning.
This makes PRE useful as a “structural context tool” rather than a classic signal generator.
🔹 Who is this version for?
Traders who want an uncomplicated version without Ultra.
Investors who want to visually track structural health, not time entries.
Users who prefer a clean footprint map rather than predictive signals.
Anyone who wants a low-cost, lightweight edition.
🔹 Important Notes
Lite version does not include Ultra footprints.
No predictive components; only structural footprint reading.
PRE/ACC are not buy/sell signals.
Best used with small-cap or mid-cap U.S. equities.
Summary
Smart Accumulation Lite tracks structural sponsorship footprints without Ultra mode.
It is meant to read structure, not predict reversals — helping you visually confirm whether structural footprints remain active during a move.

Smart Accumulation Pro – US SmallCap Edition v2
Smart Accumulation Pro v2 — US SmallCap Edition
Institutional Footprint and Structural Behavior Engine
Overview
Smart Accumulation Pro v2 detects structural behavior, internal liquidity shifts, and multi-phase accumulation footprints that are not visible through momentum or volatility indicators. The engine focuses on underlying institutional habits rather than reacting to price alone.
ULTRA — High-Threshold Structural Trigger
ULTRA appears only when multiple internal phases align simultaneously. It is not a momentum spike or volume anomaly. It represents compression pressure, phase readiness, and structural alignment. ULTRA does not repaint. When this signal appears, internal liquidity has already transitioned into an acceleration phase.
PRE — Early Structural Drift (Not a Buy Signal)
PRE should not be interpreted as a buy signal. It indicates gradual accumulation or controlled liquidity positioning. PRE usually appears during stable or quiet phases but rarely appears during panic drops or disorderly downtrends.
ACC — Transitional Footprint Signal
ACC identifies late-stage structural footprints. It is not intended as a standalone buy trigger. ACC highlights that structural preparation is underway, but direction and timing require user validation. ACC often precedes larger institutional behavior.
Philosophy
This engine does not attempt to cover every market pattern. It focuses on the highest-probability institutional habits. Exit timing, risk management, and execution remain user responsibility. The tool minimizes noise and emphasizes rare, high-impact structural zones.
Preset Modes
1) Conservative
For ETFs or stable large-cap instruments. Minimal noise and lower signal frequency.
2) Normal
Optimized for US mid-cap and small-cap behavior. Balanced and recommended as the default mode.
3) Aggressive
For volatile or thematic instruments. Higher frequency, higher risk.
Usage Notes
This indicator does not provide financial advice. It highlights structural conditions that often precede institutional movement. Execution and risk decisions depend on the user.
License Notice
Unauthorized copying, redistribution, or sharing is prohibited. Invite-Only access requires your TradingView username. One purchase equals one user license.
------------------------------------------------------------
Korean Summary (한국어 요약본)
------------------------------------------------------------
Smart Accumulation Pro v2는 세력의 습관, 유동성 이동, 압축 단계 등의 “보이지 않는 내부 구조”를 추적하는 지표다. 기존 모멘텀 기반 지표로는 포착되지 않는 패턴을 분석한다.
ULTRA 신호는 여러 내부 단계가 동시에 정렬될 때만 등장하는 극히 희귀한 트리거다. 페인팅이 없으며, 신호가 뜰 때 이미 내부 구조는 가속 단계에 진입한 상태다.
PRE는 매수 신호가 아니다. 세력이 서서히 움직이기 시작하거나 유동성을 재정렬할 때 나타나는 미세한 초기 흔적이다.
ACC는 본격 움직임 전에 나타나는 마지막 흔적이다. 단독 매수 신호가 아니며, 이후 더 큰 구조적 변화로 이어질 가능성을 나타내는 정도로 해석해야 한다.
이 지표는 모든 패턴을 잡지 않는다. 세력이 반복적으로 사용해 온 고확률 구조만 좁게 추적한다. 출구 전략과 리스크 관리는 사용자의 몫이다.
프리셋은 Conservative, Normal, Aggressive의 3가지 모드로 구성되며, 각각 안정형·균형형·변동성형 종목에 맞춰 설계되었다.
본 지표는 금융 조언을 제공하지 않으며, 무단 공유 또는 재배포는 금지된다. Invite-Only 기반이며 1인 1라이선스 방식이다.

Volume Gaps & Imbalances (Zeiierman)█ Overview
Volume Gaps & Imbalances (Zeiierman) is an advanced market-structure and order-flow visualizer that maps where the market traded, where it did not, and how buyer-vs-seller pressure accumulated across the entire price range.
The core of the indicator is a price-by-price volume profile built from Bullish and Bearish volume assignments. The script highlights:
True zero-volume voids (regions of no traded volume)
Bull/Bear imbalance rows (horizontal volume slices)
A multi-section Delta Panel, showing aggregated Buy–Sell pressure per vertical sector
A clean separation between profile structure, volume efficiency, and delta flows
Together, these components reveal market inefficiencies, displacement zones, and fair-value regions that price tends to revisit — making it an exceptional tool for structural trading, order-flow analysis, and contextual confluence.
Highlights
Identifies true volume voids (untraded price regions), more precisely than standard FVG tools
Plots Bull vs Bear volume at each price row for fine-grained imbalance reading
Includes a sector-based Delta Grid that aggregates Buy–Sell dominance
█ How It Works
⚪ Profile Construction
The indicator scans a user-defined Lookback window and divides the full high–low range into Rows. Each bar's volume is allocated into the correct price bucket:
Bullish volume when close > open
Bearish volume when close <= open
This produces three values per price level:
Bull Volume
Bear Volume
Total Volume & Imbalance Profile
Rows where no volume at all occurred are marked as volume gaps — signaling true untraded zones, often produced by impulsive imbalanced moves.
⚪ Zero-Volume Gaps (True Voids)
Unlike candle-based Fair Value Gaps (FVGs), volume gaps identify the deeper, structural inefficiency: Price moved so fast through a region that no trades occurred at those prices. These areas often attract revisits because liquidity never exchanged hands there.
⚪ Bull/Bear Volume Imbalance
Every price row is drawn using two colored horizontal segments:
Bull segment proportional to bullish volume
Bear segment proportional to bearish volume
This reveals where buyers or sellers dominated individual price levels.
⚪ Delta Panel
The full volume profile is cut into Summary Sections. For each block, the script computes: Δ = (Bull Volume − Bear Volume) ÷ Total Volume × 100%
█ How to Use
⚪ Spot True Voids & Inefficiencies
Zero-volume zones highlight where the price moved without trading. These areas often behave like:
Refill zones during retracements
Targets during displacement
Thin regions price slices through quickly
Ideal for both SMC-style trading and structural mapping.
⚪ Identify Bull/Bear Control at Each Price Level
Broad bullish segments show zones of buyer absorption, while wide bearish slices reveal seller control.
This helps you interpret:
Where buyers supported the price
Where sellers defended a level
Which price levels matter for continuation or reversal
⚪ Use Delta Sectors for Contextual Direction
The delta panel shows where market pressure is accumulating, revealing whether the profile is dominated by:
Bullish flow (positive delta)
Bearish flow (negative delta)
Neutral flow (balanced or minimal delta)
█ Settings
Lookback – Number of bars scanned to build the profile.
Rows – Vertical resolution of price bins.
Source – Price source used to assign volume into rows.
Summary Sections – Number of vertical delta sectors.
Summary Width – Horizontal size of the delta bar panel.
Gap From Profile – Distance between profile and delta grid.
Show Delta Text – Toggle Δ% labels.
-----------------
Disclaimer
The content provided in my scripts, indicators, ideas, algorithms, and systems is for educational and informational purposes only. It does not constitute financial advice, investment recommendations, or a solicitation to buy or sell any financial instruments. I will not accept liability for any loss or damage, including without limitation any loss of profit, which may arise directly or indirectly from the use of or reliance on such information.
All investments involve risk, and the past performance of a security, industry, sector, market, financial product, trading strategy, backtest, or individual's trading does not guarantee future results or returns. Investors are fully responsible for any investment decisions they make. Such decisions should be based solely on an evaluation of their financial circumstances, investment objectives, risk tolerance, and liquidity needs.

QuantMotions - Smart Money BlocksSmart Money Blocks – Clean Edition is a minimalistic, high-precision Smart Money Concepts (SMC) tool designed for traders who want clean and reliable market structure signals without chart clutter.
This script detects and visualizes Order Blocks, Fair Value Gaps (FVGs), and Liquidity Levels using a strictly filtered, volume-based institutional logic.
Unlike many SMC indicators that overload the chart with noise, this version is built to stay fast, clean, and accurate — ideal for both scalpers and higher-timeframe traders.
🔍 Features
✔ Institutional Order Block Detection
• Identifies bullish and bearish order blocks
• Uses high-volume + price-displacement confirmation
• OBs extend forward and deactivate when broken
• Includes volume + tick range info-box
✔ Fair Value Gaps (FVG)
• Auto-detects bullish and bearish FVGs
• Marks imbalance zones until they are fully filled
• Clean, non-intrusive visualization
✔ Liquidity Levels
• Smart swing-high/swing-low liquidity detection
• Tracks touches to distinguish strong vs weak levels
• Marks support/resistance liquidity with labels only (no chart clutter)
⚙️ Clean & Minimal Design
This script is optimized for a clean workflow:
• No volume profile
• No BOS/CHOCH spam
• No unused SMC elements
• Only high-value SMC signals
• Clean color theme for dark charts
The goal is to provide only what matters, nothing more.
📈 Use Cases
• Smart Money / ICT style trading
• Scalping (1s – 1m)
• Intraday / London & New York session trading
• Swing trading
• Market structure analysis
• Liquidity and imbalance mapping
Whether you're identifying points of interest (POIs), building a bias, or mapping high-probability reaction zones — this tool helps you see structure clearly.
🔔 Alerts Included
• Order Block creation
• FVG creation
• Price touching an active Order Block
• Volume surge
• Institutional candle detection
• Structure break detection
Great for automation or bias confirmation.
🧠 Why This Script?
Many SMC indicators try to do everything — which often results in clutter, lag, and unreliable signals.
This edition focuses on precision, clarity, and real usability.
The logic is light, efficient, and suited for real-time execution on very fast charts.
📌 Note
This tool does not generate trade signals by itself.
It is designed as a market structure map for traders who already understand Smart Money principles such as:
• Displacement
• Imbalance
• Institutional candles
• OB mitigation
• Liquidity sweeps
Use it as part of your confluence system.

Daily POC Lines - Clustered
Overview
This indicator automatically plots horizontal lines at the Point of Control (POC) for each daily candle, intelligently clustering nearby levels to reduce visual noise and highlight the most significant price zones where volume concentration occurred.
What Makes This Original
Unlike standard volume profile indicators that show static profiles for the entire chart, this script:
Calculates individual POC levels for each daily candle within a user-defined lookback period
Implements an intelligent clustering algorithm that merges POC levels within a customizable percentage threshold, preventing chart clutter from redundant lines
Dynamically highlights high-significance clusters (multiple days sharing the same POC level) with customizable visual styling
Provides granular control over line extension, label positioning, and visual appearance
How It Works
The script divides each daily candle's price range into configurable bins (default 20) and distributes the day's volume across these levels to approximate the POC. When multiple days produce POC levels within the specified clustering threshold (default 2%), they merge into a single line with a counter showing how many days share that level.
Key Features
Adjustable lookback period (1-500 candles)
Intelligent clustering with customizable threshold percentage
Separate styling controls for regular POCs vs. high-count clusters
Toggle visibility for lines and labels independently
Configurable line colors, widths, styles (solid/dashed/dotted), and extension
Date labels with cluster count indicators
Adjustable label positioning and offset
Use Cases
Traders can use clustered POC levels to:
Identify key support and resistance zones based on historical volume concentration
Recognize high-significance price levels where multiple days' POCs converge
Reduce chart clutter while maintaining visibility of important volume-based levels
Combine with other technical analysis methods for confluence
Settings
The indicator organizes inputs into four logical groups:
General Settings - Lookback period, cluster threshold, volume bins
Line Settings - Visibility, color, width, style, and extension options
Label Settings - Visibility, position, offset, and color
Cluster Highlights - Threshold and custom styling for high-count clusters
Important Notes
This script uses an approximation method for POC calculation by dividing each candle's range into bins. For maximum accuracy, use on daily timeframe charts. The clustering feature is particularly useful when analyzing longer lookback periods where many POC levels may naturally converge around similar price zones.
Technical Details
Written in Pine Script v5
Maximum 500 lines on chart
Requests daily timeframe data using security function
Uses arrays to store and manage POC data efficiently
Redraws all lines on the last bar for optimal performance

Accumulation And Distribution Zones (Zeiierman)█ Overview
Accumulation And Distribution Zones (Zeiierman) is a structural zone indicator that highlights where the market has recently been absorbing sell pressure (Accumulation) or releasing buy pressure (Distribution).
The indicator tracks a refined sequence of swing highs and lows and measures how these swings tighten, expand, or step directionally. When they form staircase-style structures such as higher lows with compressing highs for Accumulation or lower highs with compressing lows for Distribution, the script marks these areas as shifts in market control.
Once the full pattern completes, the indicator converts it into an Accumulation or Distribution zone. Each zone is based on a confirmed structural sequence rather than a single point, making it more reliable and reflective of actual market behavior.
The indicator can also display a mini-volume profile within each zone and extend POC levels forward, showing where trading activity clustered most. Combined, these features reveal areas where price has recently shown acceptance, absorption, or rejection, helping you understand whether current price action is reacting to, breaking from, or retesting these important structural regions.
█ How It Works
⚪ Swing Structure
The indicator builds its foundation by detecting swing highs and lows using a configurable Swing Detection Window. Each confirmed swing is stored with its price, time, bar index, and direction. If two consecutive swings share the same direction, only the more extreme one is kept. This produces a clean structural sequence that removes noise and keeps only meaningful turning points.
⚪ Accumulation vs Distribution Pattern Logic
Using the refined swing sequence, the script looks for staircase-style formations that signal shifts in control:
Accumulation (bottoming): higher lows combined with compressing highs.
Distribution (topping): lower highs combined with compressing lows.
Two detection modes are available:
Quick for compact 4-swing formations
Slow for broader 6-swing structures
When a full structural pattern completes, the indicator marks the zone and resets the swing buffer for the next formation.
⚪ Volume Profile Construction
The price range between the zone’s upper and lower boundary is divided into several Rows. For every bar within the zone’s swing range, the bar’s volume is added to the appropriate price row.
Volume is classified as:
Bullish volume when close > open
Bearish volume when close < open
Each row is drawn as two horizontal segments (bull and bear), colored with smooth gradients based on your bull/bear color settings. This creates a compact profile that reveals where trading activity is concentrated inside the zone and whether buyers or sellers dominate those price levels.
█ How to Use
The indicator is designed to provide context and confluence, not raw buy/sell signals.
⚪ Spot Fresh Accumulation & Distribution
Use newly printed zones as a map of where the market has recently:
Absorbed selling and formed a floor (Accumulation below price).
Absorbed buying and formed a cap (Distribution above price).
In a trending environment, fresh accumulation zones below price are often areas to watch for pullbacks, while distribution zones above price can act as sell zones or targets.
⚪ Volume Profile
Longer horizontal bars show where the market traded the most volume inside the zone.
Bull-leaning rows inside an accumulation zone often signal strong buying interest during the formation.
Bear-leaning rows inside a distribution zone highlight concentrated selling pressure.
By combining this volume distribution with the zone label and the broader trend context, you can judge whether the structure is more likely to hold, break, or retest as the price approaches it again.
⚪ POC (Point of Control) Trading
Extended POC zones (Regular or Faded) can be treated as dynamic support/resistance rails:
When price revisits a prior accumulation POC and rejects it from above, the level may act as support. When price retests a distribution POC from below and fails to break through, it can act as resistance.
⚪ Combine with Your Own Strategy
The script does not decide direction for you. You get the most value by combining it with:
Your own trend filters (moving averages, higher timeframe structure, volatility measures).
Your preferred entry models (reversal candles, momentum breaks, liquidity grabs, etc.).
Higher-timeframe mapping.
Think of this tool as a map of where the market did meaningful business. You decide how to trade around those areas.
█ Settings
Acc/Dist Ranges – Master switch for drawing all Accumulation and Distribution zones. Turn this off to temporarily hide boxes while leaving supporting logic active.
Pattern – Shows or hides the swing-based pattern outline that formed each zone. Good for structural debugging and education.
Pattern Sensitivity
Quick – more responsive, detects smaller compact structures.
Slow – stricter, focuses on wider and more established zones.
Swing Detection Window – Pivot width used to confirm swing highs and lows. Larger values filter noise and produce bigger zones; smaller values pick up more minor structures.
Volume Profile – Enables the embedded volume profile inside each zone.
Rows – Number of price slices used to aggregate volume in the zone. Higher values give more detail but increase visual density.
Switch Order – Flips the horizontal order of bull vs bear volume segments within each row.
Extend Zones – Behaviour of POC and zone extension:
None – No forward extension.
Faded Zones – Store and draw up to four past POC zones as faded horizontal levels.
Regular Zones – Extend POC boxes forward until price breaks out.
-----------------
Disclaimer
The content provided in my scripts, indicators, ideas, algorithms, and systems is for educational and informational purposes only. It does not constitute financial advice, investment recommendations, or a solicitation to buy or sell any financial instruments. I will not accept liability for any loss or damage, including without limitation any loss of profit, which may arise directly or indirectly from the use of or reliance on such information.
All investments involve risk, and the past performance of a security, industry, sector, market, financial product, trading strategy, backtest, or individual's trading does not guarantee future results or returns. Investors are fully responsible for any investment decisions they make. Such decisions should be based solely on an evaluation of their financial circumstances, investment objectives, risk tolerance, and liquidity needs.

Momentum + Volume Percentile
This advanced momentum indicator combines smoothed momentum analysis with percentile-based volume filtering to identify high-quality trading opportunities backed by significant market participation.
How It Works:
The indicator calculates momentum (rate of change) over a customizable period and applies multiple smoothing techniques to reduce noise. It then filters price action by highlighting only periods where volume exceeds a specified percentile threshold.
The algorithm:
Calculates raw momentum based on price changes over the specified period
Applies customizable smoothing (SMA, EMA, WMA, or HMA) to the momentum values
Computes a moving average of the smoothed momentum as a trend reference
Analyzes volume over a lookback period to establish percentile rankings
Highlights candles where volume exceeds the percentile threshold with color-coded backgrounds
Distinguishes between bullish (green) and bearish (red) high-volume events

Distância Preço vs VWAPIt calculates the distance from the price to the VWAP. The idea is to make it easier to observe when the price might return to the VWAP.

Volume Pulse [ziksfx]Volume Pulse is a clean volume indicator designed to make it easier to read meaningful changes in activity without cluttering your chart. It enhances the standard volume view by supporting both classic volume and dollar volume , highlighting spikes and extreme bars and adding a compact label on the latest bar so you always see the current volume value at a glance. The script is intended to be used in a separate volume pane.
How it works
– Supports two modes: standard volume or dollar volume (close × volume).
– Colors volume bars by candle direction (up/down). Optionally, it can:
• highlight volume spikes above a moving average;
• mark the highest-volume bar over a user-defined lookback period.
– Plots a simple moving average of volume so you can quickly see when activity is above or below typical levels.
– On the latest bar, shows a small label with the current volume value, automatically abbreviated (K / M / B) and optionally prefixed with “$” in dollar-volume mode.
Inputs & customization
– Volume type: choose between standard volume and dollar volume.
– Volume MA length: controls how sensitive the moving average is to recent changes in activity.
– Spike highlighting: optional, turns on/off coloring for bars where volume exceeds the moving average.
– Highest-volume bar lookback: sets the period for detecting the highest-volume bar.
– Label position: choose whether the last-bar label appears on the left or right side of the bar, and optionally shift it slightly above the bar for better readability.
Use cases
Use Volume Pulse to:
– Spot sudden spikes in volume and compare them to the recent average.
– Identify sessions or candles with unusually high activity relative to a chosen TF.
– Visually study how volume behaves around price moves, breakouts or potential fakeouts to better understand their strength or weakness.
– Keep track of the latest bar’s volume instantly, without having to read the raw scale values.
This indicator works on any symbol that has volume data (stocks, futures, crypto and more), but volume quality may vary between markets and instruments. It is intended as an analytical and educational tool only: it does not constitute financial advice and does not provide or guarantee any trading results. Always combine volume context with your own analysis and risk management.

Volume–Phase Analyzer ProVolume–Phase Analyzer Pro – Trend & Institutional Volume Phases
This indicator analyzes how volume behaves relative to price movement to detect whether the market is in Accumulation, Markup, Distribution, or Markdown — the same phases institutions track in professional trading.
Unlike regular volume/MA mashups, this tool combines:
• Institutional volume classification (HighVol Up/Down, LowVol, Confused Vol)
• Price–volume efficiency and wick dominance
• Multi-Timeframe directional filters
• Volatility compression signals using Bollinger Width
• Volume mapped directly into the price chart as candles
• Smart signal engine with cooldown (prevents repeated signal spam)
This helps reveal w hen Smart Money is accumulating, pushing trends, unloading positions, or flushing liquidity.
────────────────────────────────────
How It Works
1️⃣ Volume Strength vs Average Volume
Identifies whether a move is backed by genuine buying/selling power.
2️⃣ Wick & Body Analysis
Confirms whether volume produced meaningful directional pressure — not just noise.
3️⃣ Trend Alignment
Fast EMA vs Slow EMA ensures signals align with active trend.
4️⃣ Higher-Timeframe Confirmation
Confirms if current movement agrees with a larger directional bias.
5️⃣ Compression Detection
When price volatility contracts while high-volume bars appear → phase shift often ahead.
────────────────────────────────────
Signals
BUY → Confirmed bullish demand with trend backing
SELL → Confirmed bearish supply taking control
TRAP → Likely stop-hunt or absorption — often before reversal
Signals only appear when multiple institutional conditions align.
A cooldown prevents repetitive signals like BUY-BUY-BUY.
────────────────────────────────────
Background shading helps visually locate these phases.
Markup phase:
• Meaning: Buyers are in control and the market is trending up
• Background color: Light green
Markdown phase:
• Meaning: Sellers are in control and the market is trending down
• Background color: Light red
Accumulation phase:
• Meaning: Smart Money quietly buying near the bottom before an uptrend
• Background color: Teal (blue-green)
Distribution phase:
• Meaning: Smart Money quietly selling near the top before a downtrend
• Background color: Light orange/yellow
Consolidation phase:
• Meaning: Sideways movement with low conviction
• Background color: Very light grey
Transition phase:
• Meaning: Market has not picked a direction yet
• Background color: No shading (clear background)
⸻
Quick Usage Notes
• Best trades are Buy signals during Markup and Sell signals during Markdown
• Accumulation and Distribution often come before reversals
• Consolidation is a low-quality trading zone
────────────────────────────────────
How to Trade It
• Take BUY signals during Markup
• Take SELL signals during Markdown
• Expect reversals near Trap signals, especially when phase is changing
• Avoid over-trading Consolidation zones
• Volume candles below price reveal when momentum is increasing or fading
Best applied on 5m–1H for intraday and swing confirmation.
────────────────────────────────────
Why This Indicator Is Unique
• It uses p rice-volume efficiency , not standard lagging signals
• It detects S mart Money intent , not retail reactions
• It avoids spam signals using an internal cooldown logic
• It gives context, not just entries — via live market-phase analysis
This makes it a multi-purpose tool for trend trading, breakout trading, and reversal anticipation.
────────────────────────────────────
Alerts Included
• Buy/Sell/Trap Signals
• Phase Change Alerts
────────────────────────────────────
This is a free tool and meant for educational use only.
Always use proper risk management.
────────────────────────────────────

Daily & Average Dollar VolumeCalculates the daily and average (20D) $ volume.
Fully customizable appearence and can be placed in any corner.

Turnover (Volume * HLC/3)Let's get the elephant out of the room. Everyone knows volume is the key to validate price movement, but you can't compare two volume candles of the same stock when the price is 3 times different you need to account for that. So here it is, Turnover chart, to replace volume entirely, because why would you look at volume when you can look at turnover instead?

RT-Split VolumeSplit Volume is a volume analytics tool that separates estimated buy and sell volume for each bar, highlights abnormal activity, and makes it easier to see when larger participants may be stepping in or out of the market.
Split Volume Introduction
Traditional volume tools only show you the data for the candle that "won". This leaves traders in the dark about the balance between buying and selling behind each bar. Often a candle close is a photo finish between bulls and bears, and other times it is hardly a battle at all.
The Split Volume Indicator looks at both sides of the flow and identifies which volume candles have been flagged as anomalies compared with the surrounding volume bars. It is designed to provide additional context around where and how volume is flowing, rather than only showing total volume per candle.
Traditional Volume vs Split Volume
While volume is one of the most important signals a trader can watch, traditional volume indicators only show a single bar for each candle. Only looking at one side of the story puts the trader at a disadvantage. Sometimes the battle between the bears and the bulls is a photo finish, and sometimes it is hardly a battle at all.
In the comparison chart below, the middle pane shows TradingView's built in Volume indicator, while the lower pane shows Split Volume, so you can compare a single bar view with the split buy and sell view side by side.
Split Volume estimates buy and sell pressure separately and plots them on different halves of the panel. This gives a clearer picture of what is actually happening in the underlying order flow, not just which side closed the bar.
How Split Volume Works
The Split Volume Indicator uses an algorithm to estimate the buy and sell volume for each candle. All of the estimated buy volume is placed on the upper half of the indicator, while all of the estimated sell volume is placed on the lower half of the indicator.
As the bulls and bears trade back and forth on each candle, the algorithm also calculates a baseline average of the volume being traded over a rolling window. This dynamic baseline is shown by the gray Ghost Line.
When either the buy side or the sell side volume spikes well above that Ghost Line, the corresponding bars are flagged as abnormal. These abnormal spikes are color coded so they stand out against normal background activity.
Volume Candle Types
Green volume candles - Normal buying volume above the midline.
Blue volume candles - Abnormal buying volume above the Ghost Line.
Red volume candles - Normal selling volume below the midline.
Yellow volume candles - Abnormal selling volume below the Ghost Line.
Volume Impulses
One key pattern to watch with Split Volume is volume impulses: short bursts of concentrated activity that stand out from the Ghost Line baseline. These can be easy to miss with standard volume bars but become very obvious when normal and abnormal buy and sell flows are separated.
Settings
Volume in USD toggle On/Off - Switch between volume being displayed in USD or in the number of units (stocks or tokens) being traded. This change is reflected on the Y axis of the indicator.
Volume smoother - Changes the smoothness setting of the Ghost Line. Higher values make the baseline slower and smoother, and lower values make it more responsive to recent changes in activity.
Volume displacement shifter - Adjusts the vertical height of the Ghost Line. This lets traders control where they want abnormal blue and yellow volume candles to start triggering.
What Makes This Tool Different
Separates estimated buy and sell volume into their own zones instead of showing a single undifferentiated volume bar.
Uses a dynamic Ghost Line baseline so spikes are judged relative to recent activity, not a fixed threshold.
Highlights abnormal volume with clear color coding, making it easier to see when activity is concentrated on one side of the tape.
Emphasizes volume impulses and clusters that can precede or accompany larger moves, rather than only tracking total daily or session volume.
This indicator is intended to provide additional context around order flow and volume behavior. It is not a standalone signal generator and should always be used together with your own analysis, risk management and trading plan. Historical volume patterns do not guarantee future results.
🐋 Tight lines and happy trading!
