Bubbles VolumeBubbles Volume Indicator
Overview
The Bubbles Volume Indicator is an advanced volume visualization tool that transforms traditional volume analysis into an intuitive, visual experience. By representing volume as dynamically-sized bubbles directly on your price chart, this indicator helps traders quickly identify significant volume events, potential support/resistance levels, and shifts in market sentiment.
Key Features
🔵 Visual Volume Representation
Displays volume as circular bubbles at the midpoint of each candle
Bubble size scales proportionally to volume significance
Instant visual identification of unusual volume activity
Clean, uncluttered chart presentation
📊 Dual Volume Modes
Total Volume Mode: Displays complete trading volume for each bar
Volume Delta Mode: Shows the difference between buying and selling pressure, helping identify market direction and strength
🎨 Advanced Coloring Systems
Simple Mode: Clear green/red coloring for buy/sell pressure
HeatMap Mode: Gradient coloring that intensifies with volume strength, providing instant visual feedback on volume intensity
📍 Significant Level Detection
Automatically identifies and marks price levels with exceptional volume
These levels often act as future support or resistance zones
Historical volume levels remain visible for reference
How to Use
For Day Traders
Identify volume climaxes that may signal reversals
Spot accumulation/distribution patterns through Volume Delta
Confirm breakouts with significant volume bubbles
For Swing Traders
Mark important support/resistance levels based on historical high-volume areas
Identify institutional activity through unusual volume patterns
Validate trend strength using volume confirmation
For Scalpers
Quick visual identification of liquidity pockets
Real-time volume delta for order flow analysis
Filter out low-volume noise with minimum contract settings
Parameter Settings
Volume Settings
Volume Type
Total Volume: Shows all traded volume for each bar - ideal for general volume analysis
Volume Delta: Displays the difference between buying and selling pressure - perfect for order flow analysis
Minimum Contracts
Filters out bubbles below a specified volume threshold
Set to 0 to disable filtering
Helps remove noise during low-volume periods
For Volume Delta: Filters based on absolute delta value
Bubble Display
Show Bubbles
Toggle the visibility of volume bubbles on/off
Bubbles appear at the middle price point (HL2) of each bar
Threshold
Statistical threshold measured in standard deviations
Controls sensitivity of volume significance detection:
1.0 = Shows top ~32% of volumes (more bubbles, common events)
2.0 = Shows top ~5% of volumes (significant events)
3.0 = Shows top ~0.3% of volumes (rare, extreme events)
Higher values display only the most significant volume spikes
HeatMap
OFF: Simple coloring scheme (green for buying, red for selling in Delta mode)
ON: Gradient coloring that intensifies with volume strength
Provides additional visual dimension to volume analysis
Volume Levels
Significant Levels
Draws horizontal lines at price levels where extreme volume occurred
Volume must exceed 3x the threshold setting to qualify
These levels often become important support/resistance zones
Levels Qty
Maximum number of significant volume level lines to display
Older lines are automatically removed when limit is exceeded
Keeps chart clean while maintaining relevant historical levels
Visual Indicators
Bubble Sizes (in order of significance)
Tiny: Minimal volume above baseline
Small: Low significant volume
Normal: Moderate volume activity
Medium: Above-average volume
Large: High volume activity
Huge: Exceptional volume
Labeled: Extreme volume with numeric display
Color Coding
Green: Buying pressure (in Volume Delta mode) or rising prices
Red: Selling pressure (in Volume Delta mode) or falling prices
Gradient Intensity: Stronger colors indicate higher relative volume
Information Display
The indicator includes a real-time information table showing:
Current operating mode (Total Volume or Volume Delta)
Live delta values with directional arrows (in Volume Delta mode)
Active minimum contracts filter setting
Best Practices
Start with default settings to familiarize yourself with the indicator
Adjust threshold based on your trading timeframe (lower for scalping, higher for position trading)
Use Volume Delta mode when analyzing order flow and market sentiment
Enable Significant Levels for swing trading to identify key support/resistance
Apply Minimum Contracts filter to reduce noise in low-volume markets
Technical Notes
The indicator requires volume data to function (not available on all symbols)
Volume Delta calculations use intrabar data for enhanced accuracy
Historical significant levels are preserved for technical analysis
Optimized for both light and dark chart themes
Trading Applications
Breakout Confirmation: Large bubbles during breakouts confirm strength
Reversal Detection: Extreme volume at tops/bottoms may signal reversals
Trend Analysis: Increasing bubble sizes confirm trend strength
Support/Resistance: High-volume levels often become future pivots
Order Flow: Volume Delta reveals real-time buying/selling pressure
X-volume
SRD
SRD v11 - Multi-Timeframe Volume Profile (POC, VAH, VAL)
Key Features
Dual Timeframe Analysis:
📈 Main Analysis (Daily): Calculates and displays the most significant levels based on a user-defined period of daily bars. This is ideal for identifying intraday and short-term trading opportunities.
📊 Strategic Analysis (Weekly): Plots key levels from a weekly perspective, giving you a broader, long-term view of market sentiment and structure. This can be toggled on or off.
Volume Profile Core Levels: The indicator automatically calculates and visualizes the three most important levels derived from volume analysis for both timeframes:
🎯 POC (Point of Control): The price level with the highest traded volume for the specified period. It acts as a powerful magnet for price and a key reference for market equilibrium.
🔴 VAH (Value Area High): The highest price level within the "Value Area" (where ~70% of the volume was traded). It often acts as a significant resistance zone.
🟢 VAL (Value Area Low): The lowest price level within the Value Area. It often serves as a strong support zone.
🟠 24-Hour High: An optional feature that plots the highest price reached in the last 24 hours, providing a crucial reference point for breakout and reversal traders.
Dynamic and Non-Repainting: The levels are calculated based on historical confirmed bars and update automatically as new periods (daily or weekly) close. The lines extend to the right, remaining relevant until a new calculation period begins.
Integrated Alert System: Never miss a key price interaction. The indicator includes a comprehensive alert system for:
Breakouts: Triggers when the price crosses above or below the POC, VAH, or VAL.
Touches: Triggers when the price touches one of these key levels without breaking through it (within a small tolerance).
Unified Alert: A single alert that notifies you of any of the above conditions.
Customization
The SRD v11 is fully customizable to fit your trading style. You can adjust:
Timeframes: Change the base timeframes for both the main (default Daily) and strategic (default Weekly) analysis.
Analysis Periods: Define the number of bars (days or weeks) to include in the Volume Profile calculation.
Visuals: Customize the color, width, and style (solid, dashed, dotted) of every line and label for clear and intuitive visualization.
Toggle Elements: Easily show or hide the strategic (weekly) analysis and the 24-hour high line.
How to Use It >
Identify Key Zones: Use the VAH (resistance) and VAL (support) lines to identify potential entry and exit zones. The area between VAH and VAL is the "Value Area," where the market has found acceptance.
Monitor the POC: The Point of Control is the ultimate level of equilibrium. Watch for price reactions around the POC. A sustained break above or below can signal a new trend.
Combine Timeframes: Use the strategic (weekly) levels as major, long-term points of interest and the main (daily) levels for your day-to-day trading setup. Confluence between levels from different timeframes can indicate extremely strong support or resistance.
Set Alerts: Configure alerts for breakouts or touches to be notified of critical market movements in real-time, even when you are away from the charts.

Delta Money Flow IndexThe Delta Money Flow Index is a modified version of the traditional Money Flow Index that uses directional volume instead of total volume to measure buying and selling pressure in a different way.
It helps traders identify overbought/oversold conditions based on actual buy/sell pressure rather than just total volume. It's designed for traders who want to see if price movements are backed by genuine buying or selling activity.
How to use it:
- Values above 80 indicate overbought conditions
- Values below 20 indicate oversold conditions
- The 50 level acts as a neutral zone. Above suggests buyers are in control, below suggests sellers are in control.
- Traders can check for divergences for potential reversal signals
- Works best on intraday timeframes where delta volume is most meaningful
What makes it different:
Unlike the standard MFI which uses total volume, the Delta MFI calculates an approximation of volume delta by assigning positive volume to up-closing candles and negative volume to down-closing candles.
This means:
- It focuses on directional pressure, not just activity
- Filters out low-conviction volume that doesn't move price
- Provides clearer signals when actual buying/selling dominates
The indicator includes visual aids like background colors for overbought/oversold and a fill showing whether the Delta MFI is above or below the 50 midpoint for quick interpretation.

Volume Area 80 Rule Pro - Adaptive RTHSummary in one paragraph
Adaptive value area 80 percent rule for index futures large cap equities liquid crypto and major FX on intraday timeframes. It focuses activity only when multiple context gates align. It is original because the classic prior day value area traverse is fused with a daily regime classifier that remaps the operating parameters in real time.
Scope and intent
• Markets. ES NQ SPY QQQ large cap equities BTC ETH major FX pairs and other liquid RTH instruments
• Timeframes. One minute to one hour with daily regime context
• Default demo used in the publication. ES1 on five minutes
• Purpose. Trade only the balanced days where the 80 percent traverse has edge while standing aside or tightening rules during trend or shock
Originality and usefulness
• Unique fusion. Prior day value area logic plus a rolling daily regime classifier using percentile ranks of realized volatility and ADX. The regime remaps hold time end of window stop buffer and value area coverage on each session
• Failure mode addressed. False starts during strong trend or shock sessions and weak traverses during quiet grind
• Testability. All gates are visible in Inputs and debug flags can be plotted so users can verify why a suggestion appears
• Portable yardstick. The regime uses ATR divided by close and ADX percent ranks which behave consistently across symbols
Method overview in plain language
The script builds the prior session profile during regular trading hours. At the first regular bar it freezes yesterday value area low value area high and point of control. It then evaluates the current session open location the first thirty minute volume rank the open gap rank and an opening drive test. In parallel a daily series classifies context into Calm Balance Trend or Shock from rolling percentile ranks of realized volatility and ADX. The classifier scales the rules. Calm uses longer holds and a slightly wider value area. Trend and Shock shorten the window reduce holds and enlarge stop buffers.
Base measures
• Range basis. True Range smoothed over a configurable length on both the daily and intraday series
• Return basis. Not required. ATR over close is the unit for regime strength
Components
• Prior Value Area Engine. Builds yesterday value area low value area high and point of control from a binned volume profile with automatic TPO fallback and minimum integrity guards
• Opening Location. Detects whether the session opens above the prior value area or below it
• Inside Hold Counter. Counts consecutive bars that hold inside the value area after a re entry
• Volume Gate. Percentile of the first thirty minutes volume over a rolling sample
• Gap Gate. Percentile rank of the regular session open gap over a rolling sample
• Drive Gate. Opening drive check using a multiple of intraday ATR
• Regime Classifier. Percentile ranks of daily ATR over close and daily ADX classify Calm Balance Trend Shock and remap parameters
• Session windows optional. Windows follow the chart exchange time
Fusion rule
Minimum satisfied gates approach. A re entry must hold inside the value area for a regime scaled number of bars while the volume gap and drive gates allow the setup. The regime simultaneously scales value area coverage end minute time stop and stop buffer.
Signal rule
• Long suggestion appears when price opens below yesterday value area then re enters and holds for the required bars while all gates allow the setup
• Short suggestion appears when price opens above yesterday value area then re enters and holds for the required bars while all gates allow the setup
• WAIT shows implicitly when any required gate is missing
• Exit labels mark target touch stop touch or a time based close
Inputs with guidance
Setup
• Signal timeframe. Uses the chart by default
• Session windows optional. Start and end minutes inside regular trading hours
• Invert direction is not used. The logic is symmetric
Logic
• Hold bars inside value area. Typical range 3 to 12. Raising it reduces trades and favors better traverses. Lowering it increases frequency and risk of false starts
• Earliest minute since RTH open and Latest minute since RTH open. Typical range 0 to 390. Reducing the latest minute cuts late session trades
• Time stop bars after entry. Typical range 6 to 30. Larger values give setups more room
Filters
• Value area coverage. Typical range 0.70 to 0.85. Higher coverage narrows the traverse but accepts fewer days
• Bin size in ticks. Typical range 1 to 8. Larger bins stabilize noisy profiles
• Stop buffer ticks beyond edge. Typical range 2 to 20. Larger buffers survive noise
• First thirty minute volume percentile. Typical range 0.30 to 0.70. Higher values require more active opens
• Gap filter percentile. Typical range 0.70 to 0.95. Lower values block more gap days
• Opening drive multiple and bars. Higher multiple or longer bars block strong directional opens
Adaptivity
• Lookback days for regime ranks. Typical 150 to 500
• Calm RV percentile. Typical 25 to 45
• Trend ADX percentile. Typical 55 to 75
• Shock RV percentile. Typical 75 to 90
• End minute ratio in Trend and Shock. Typical 0.5 to 0.8
• Hold and Time stop scales per regime. Use values near one to keep behavior close to static settings
Realism and responsible publication
• No performance claims. Past results never guarantee future outcomes
• Shapes can move while a bar forms and settle on close
• Sessions use the chart exchange time
Honest limitations and failure modes
• Economic releases and thin liquidity can break the balance premise
• Gap heavy symbols may work better with stronger gap filters and a True Range focus
• Very quiet regimes reduce signal contrast. Consider longer windows or higher thresholds
Legal
Education and research only. Not investment advice. Test in simulation before any live use.

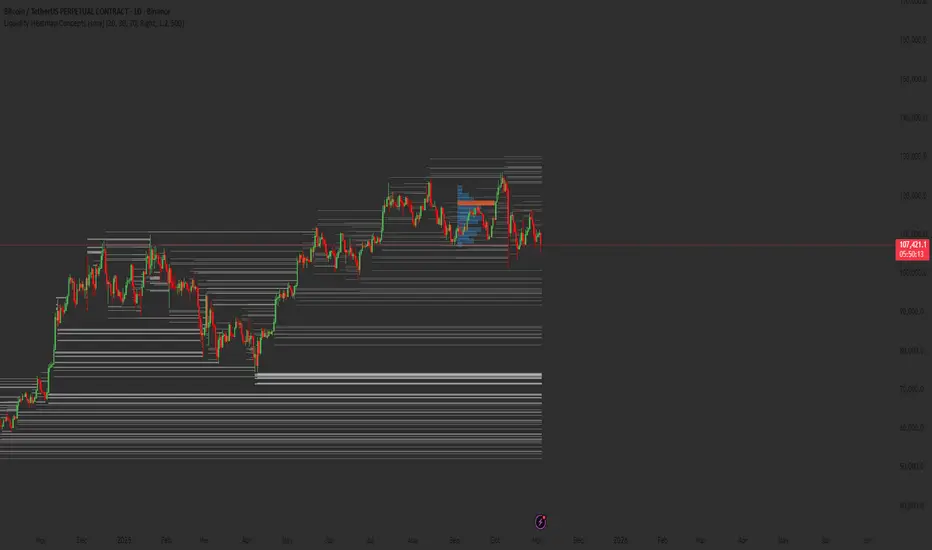
Liquidity Heatmap Concepts [sma] Overview
Liquidity Heatmap Concepts is a sophisticated visualization tool that maps potential liquidation zones for leveraged positions across multiple timeframes. It calculates and displays where high-volume liquidations might occur at various leverage levels (25x, 50x, 100x, 150x), helping traders identify potential support/resistance zones created by cascading liquidations. Additionally, it includes a quarterly volume profile to show historical price distribution and Point of Control levels.
### Volume-Based Trigger System
Lines are only drawn when volume exceeds a threshold:
1. Calculates 14-period simple moving average of volume
2. Applies configurable multiplier (default 1.2x) to determine significance
3. Only plots liquidation levels when current volume > (Volume SMA × Multiplier)
4. This filters out low-volume noise and focuses on meaningful zones
### Visual Intensity System
The indicator uses a gradient coloring system based on relative volume:
- **Peak Volume (White)**: When current bar has maximum volume in the dataset
- Line width: 3 pixels
- Brightest color intensity
- **Above Average Volume**: Volume exceeds average but isn't peak
- Line width: 2 pixels
- Medium color intensity
- **Standard Volume**: Exceeds threshold but below average
- Line width: 1 pixel
- Base color intensity
### Line Extension & Management
- Lines extend horizontally to the right until price crosses them
- Automatic cleanup removes lines after maximum count (default 500)
- Lines persist until invalidated by price action crossing the level
- Oldest lines are removed first when limit is reached
### Quarterly Volume Profile
An optional fixed-range volume profile that:
1. **Automatic Quarter Detection**: Identifies Q1 (Jan-Mar), Q2 (Apr-Jun), Q3 (Jul-Sep), Q4 (Oct-Dec)
2. **Price Distribution Analysis**: Divides the quarter's price range into configurable rows (default 20)
3. **Volume Aggregation**: Accumulates volume at each price level throughout the quarter
4. **POC Identification**: Highlights the price level with highest volume (Point of Control)
5. **Value Area**: Shows the price range containing 70% (configurable) of total volume
6. **Profile Drawing**: At the start of each new quarter, draws the previous quarter's profile as horizontal bars
The volume profile can be positioned on either left or right side of the quarter range with adjustable width.
## Key Features
- **Multi-Leverage Display**: Toggle between 25x, 50x, 100x, and 150x leverage levels independently
- **Dual Side Tracking**: Separate visualization for long and short liquidation zones
- **Volume-Weighted Importance**: Visual intensity correlates with volume significance
- **Gradient Coloring**: Color intensity reflects relative volume magnitude
- **Smart Line Management**: Automatic cleanup prevents chart clutter
- **Historical Context**: Quarterly volume profile shows where price spent most time
- **Fully Customizable**: All colors, thresholds, and display options are adjustable
- **HD Mode**: Uses absolute volume for more precise visualization
## Parameters
### Leverage Selection
- **25x, 50x, 100x, 150x Toggles**: Enable/disable specific leverage levels
- Each level can be controlled independently
### Volume Configuration
- **Minimum Volume Multiplier** (default 1.2): Threshold above volume SMA to trigger lines
- Higher values = fewer but more significant levels
- Lower values = more levels but increased noise
### Advanced Settings
- **Maximum Lines** (default 500, range 50-500): Memory management limit
- Controls how many historical liquidation lines are maintained
### Quarterly Volume Profile
- **Show Previous Q Volume Profile** (default on): Toggle profile visibility
- **Number of Rows** (default 20, range 10-50): Price distribution granularity
- **Profile Width** (default 30%): Visual width as percentage of quarter range
- **Value Area** (default 70%): Percentage of volume for value area calculation
- **Position** (Left/Right): Profile placement relative to quarter
- **Show Values** (default off): Display POC volume label
- **Colors**: Customizable base and POC colors
### Color Customization
- **Long Colors**: Individual colors for each leverage level (25x, 50x, 100x, 150x)
- **Short Colors**: Separate color scheme for short liquidation zones
- **VP Colors**: Base color and POC highlight color for volume profile
## Interpretation
### Liquidation Clusters
- **Dense Line Areas**: Multiple overlapping liquidation levels suggest strong magnetic zones
- **High-Volume Lines**: Brighter/thicker lines indicate more significant potential liquidations
- **Line Breaks**: Price crossing multiple liquidation lines may trigger cascade effects
### Trading Applications
- **Support/Resistance**: Liquidation clusters often act as temporary support/resistance
- **Stop Hunt Zones**: Areas where price may spike to trigger liquidations before reversing
- **Momentum Acceleration**: Breaking through dense clusters can indicate strong directional moves
- **Risk Management**: Avoid placing stops directly at obvious liquidation levels
### Volume Profile Usage
- **POC (Point of Control)**: Price level with highest volume - often acts as strong support/resistance
- **Value Area**: Where most trading activity occurred - indicates fair value range
- **Profile Shape**:
- Balanced profile (bell curve) = ranging market
- Skewed profile = trending market with acceptance at extremes
- **Profile Gaps**: Low volume areas suggest price may move quickly through these zones
### Combined Analysis
- Liquidation lines near quarterly POC create extra-strong zones
- Price returning to value area from outside often finds support/resistance
- Liquidation clusters at value area edges suggest potential reversal points
## Technical Implementation
This indicator features:
- **Custom Type Structures**: Uses type definitions for organized data storage
- `BarData`: Stores OHLCV and index information
- `LiquidityBin`: Manages arrays of line objects for each leverage level
- `VolumeProfileData`: Handles profile boxes, labels, and range data
- **Dynamic Line Objects**: Creates, updates, and deletes line primitives programmatically
- **Array-Based History**: Maintains volume history for gradient calculations
- **Intelligent Cleanup**: Automatic memory management prevents performance degradation
- **Mathematical Precision**: Leverage-based liquidation formulas ensure accurate price levels
- **Quarterly Aggregation**: Efficient volume accumulation with automatic period detection
- **Box Drawing System**: Dynamic profile visualization using box primitives
## Originality Statement
This indicator presents a unique approach to liquidity visualization:
- Implements leverage-specific liquidation price calculations based on mathematical formulas
- Uses volume-weighted gradient coloring system that adapts to relative volume significance
- Combines real-time liquidation mapping with historical volume profile analysis
- Features intelligent line lifecycle management with automatic extension and cleanup
- Integrates quarterly volume profile with configurable value area and POC detection
- Employs multi-layer visual hierarchy (line width + color intensity) for information density
- Uses custom data structures to efficiently manage hundreds of line objects simultaneously
The combination of mathematical liquidation pricing, volume-based filtering, gradient visualization, and quarterly volume distribution creates a comprehensive liquidity analysis tool.
## Best Practices
- Use on liquid markets (major cryptocurrencies, forex pairs) for best accuracy
- Lower timeframes (1m-15m) for day trading and scalping
- Higher timeframes (1h-4h) for swing trading context
- Combine with volume profile to identify high-probability reversal zones
- Watch for price reactions when approaching dense liquidation clusters
- Increase volume multiplier in choppy markets to reduce noise
- Reduce maximum lines on lower timeframes to maintain performance
- Use quarterly volume profile to understand longer-term fair value
## Important Notes
- Liquidation prices are estimates based on leverage ratios
- Actual exchange liquidation prices may vary due to:
- Maintenance margin requirements
- Mark price vs last price calculations
- Individual exchange liquidation engines
- Insurance fund mechanisms
- This tool shows potential zones, not guaranteed liquidation prices
- Volume profile resets each quarter automatically
---
Works on all timeframes and asset classes. Designed for crypto/forex leverage markets. For educational purposes only. Not financial advice.
Volume Category IndicatorThis indicator analyzes historical volume data and categorizes each trading period into one of six levels: Outlier, Low, Below Average, Average, Above Average, or High.
How it works:
1. Filters out extremities - Excludes abnormal volume spikes/drops using standard deviation (default: 3σ threshold) to create a "clean" dataset
2. Calculates percentiles - Divides the clean volume distribution into quintiles (20th, 40th, 60th, 80th percentiles)
3. Reduces noise - Applies a 3-period moving average to volume to prevent rapid category changes
4. Categorizes current volume - Compares today's smoothed volume against historical percentiles to assign a category
5. Visual display - Shows volume bars in grayscale (darker = lower volume, lighter = higher volume) with an optional info table
Key parameters:
* Lookback Period (100): How many bars of history to analyze
* Smoothing (3): Moving average length to stabilize categories
* Outlier Threshold (3.0): Standard deviations for filtering extremes
The result is a stable, clean indicator that identifies whether current volume is genuinely low, average, or high relative to recent history—without being thrown off by occasional volume anomalies.

TernTable: VolViz
VolViz - Overview
VolViz is designed to give traders an instant volume strength visualisation tool using multiple timeframes. It provides an interactive table overlay that allows users to track volume metrics across a range of custom-selected timeframes. The table can dynamically display relative volume (RVOL), average volume, and current volume for each selected timeframes in real time.
Additionally, users can toggle various features and adjust thresholds to receive alerts for both high and low volume conditions.
Key Features
* Volume Metrics: Displays three main volume-related data points across multiple timeframes: Relative Volume (RVOL), Average Volume, and Current Volume.
* Timeframe Flexibility: Supports a range of customisable timeframes from seconds, minutes, hours to daily weekly and monthly intervals up to 12 months. Users can select which timeframes to display.
* Dynamic Table: A table is dynamically updated with data for each enabled timeframe, allowing traders to quickly compare volume data across different periods.
* Optional alert System: Includes alert functionality for high and low volume conditions based on customisable thresholds. Alerts can be set for a minimum number of timeframes for a condition to trigger.
Colour Logic
The script uses specific colours to enhance the visual alert properties that represent different ranges of Relative Volume (RVOL), which are used in the table to visually highlight the volume data:
1. Red: RVOL is less than 1.0, indicating low relative volume.
2. Green: RVOL is between 1.0 and 1.2, indicating moderate relative volume.
3. Purple: RVOL is between 1.2 and 1.5, indicating above average relative volume.
4. Orange: RVOL is between 1.5 and 2.0, indicating higher relative volume.
5. Yellow: RVOL is greater than 2.0, indicating very high relative volume.
How to use
1. Inputs:
* Volume Period: Set the period for calculating the moving average of volume (14 period default).
* The script defaults to the 2m 5m 15m 30m 1h 4h 12h D W M timeframes but user defined custom timeframes can be used (comma-separated) to specify the timeframes to track ( e.g "D,W,M,3M,6M,12M”) to a max of 10 timeframes. The table dynamically adjusts its size dependant on how many timeframes the user chooses to input.
* Table Position: Choose where to display the table: Top Left, Top Right, Bottom Left, or Bottom Right.
* Maximum Decimal Places: Control how many decimal places are shown for volume data.
2. Toggles:
* Enable High Volume Alert: Toggle this to activate the high volume alert.
* Enable Low Volume Alert: Toggle this to activate the low volume alert.
* Enable Minimum Timeframes for Alerts: Toggle this to require a specific number of timeframes to meet the alert condition before triggering.
* Pane Labels: There is also an optional debug label found in the Style tab to identify / confirm the current mode selected and the number of timeframes that meet the alert mode criteria.
The Show Row toggles can be utilised to include or exclude rows to take up less space on the chart.
* Show RVOL Row: Toggle to show the relative volume row in the table.
* Show Avg Volume Row: Toggle to show the average volume row in the table.
* Show Current Volume Row: Toggle to show the current volume row in the table.
* Show Spacer Row Below Table: Toggle to show or hide a blank spacer row below the table.
* Show Spacer Row Above Header: Toggle to show or hide a blank spacer row above the header.
3. How the Table Works:
* The table is populated with the following rows:
1. Spacer Row Above Header (optional): Adds space above the table header.
2. Header Row: Displays the timeframes (e.g., "1h", "4h", "12h", etc.).
3. Relative Volume (RVOL): Shows the RVOL for each timeframe, colored according to the thresholds.
4. Average Volume: Shows the average volume for each timeframe.
5. Current Volume: Displays the current volume for each timeframe.
6. Spacer Row Below Table (optional): Adds space below the data rows.
4. Optional Visual Alerts:
* High Volume Alert: When the current volume exceeds the default or user specified threshold compared to the average volume for the enabled timeframes.
* Low Volume Alert: When the current volume is below the default or user specified threshold compared to the average volume for the enabled timeframes.
When the visual alerts trigger unobtrusive diamonds will appear on the chart. White diamonds above the bar to indicate high volume and yellow diamonds below the bar to indicate low volume. These are not trend direction nor entry or exit signals but may be used in conjunction with other indicators for contextual purposes.
Questions or comments are always welcomed and I hope it helps with your trading !

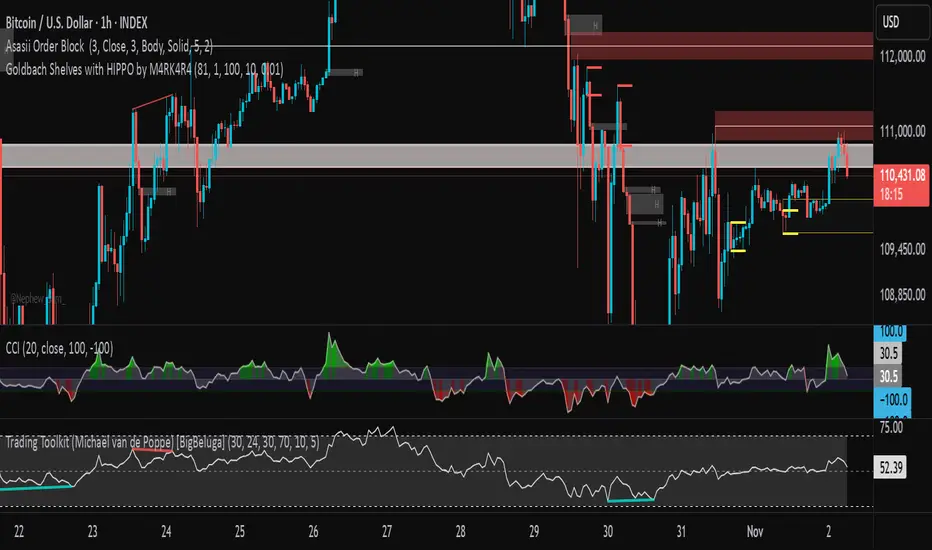
Goldbach Shelves with HIPPO by M4RK4R4Goldbach Hippo M4RK
The idea is that you are using a higher Po3 range, but trading within the smaller 3 sections, that I call "shelves", Bottom Shelf, Mid Shelf, Top Shelf. The three sections are split with the 0.33 and 0.66 Non GB levels.
Each shelf has two FV levels (gray lines), and you should TP or take most off at opposite FV level, with the stop at the NonGB lines (thick white lines), or the FV level past that.
Can also crank SL up after price goes to opposite FV. This gives you about 2.3RR, which is excellent for long term stability and automation.
Future updates:
auto Po3 range suggestion.,
current Po3 in use label (done),
section labels/tool tips,
custom colors (done)
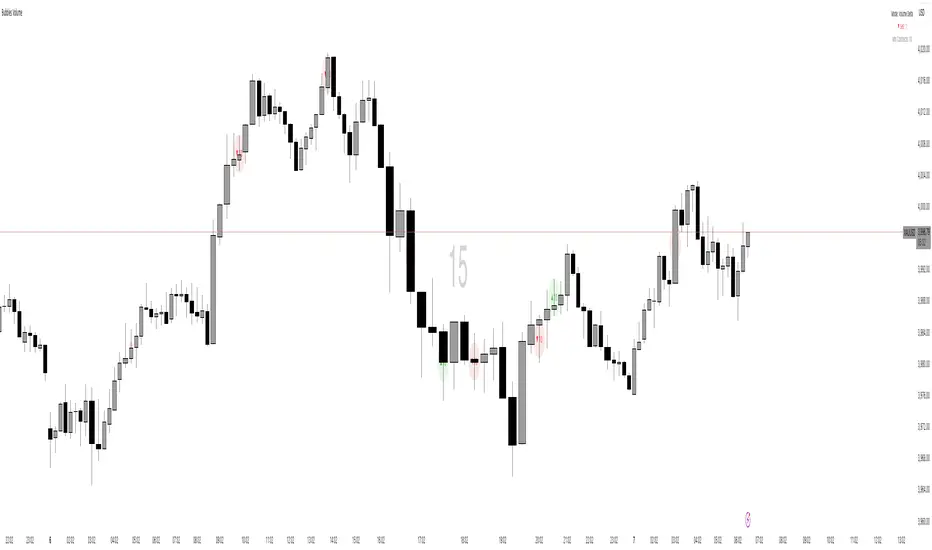
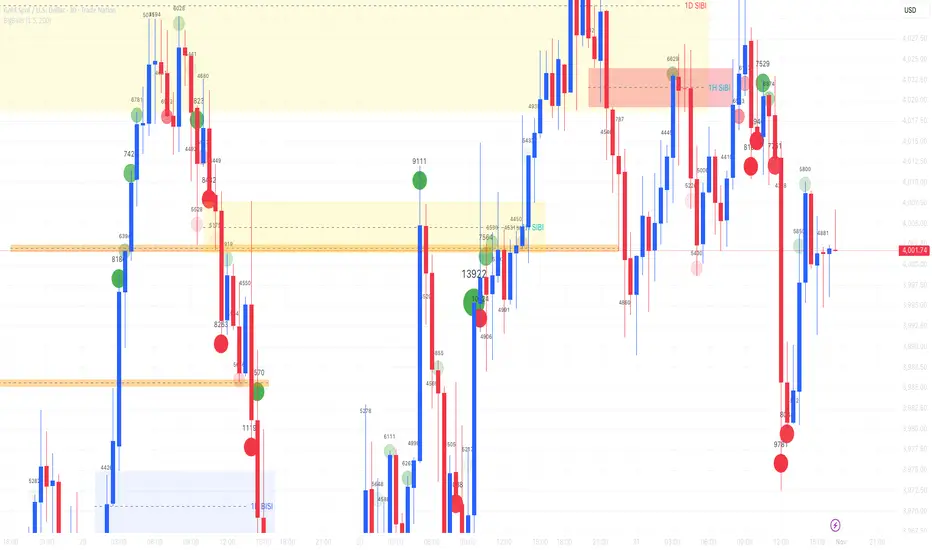
BigBallsCalculate normalized volume based on StdDev of volume over 200 bars and show volume as a circle on candles.
Sometimes useful for "follow through".
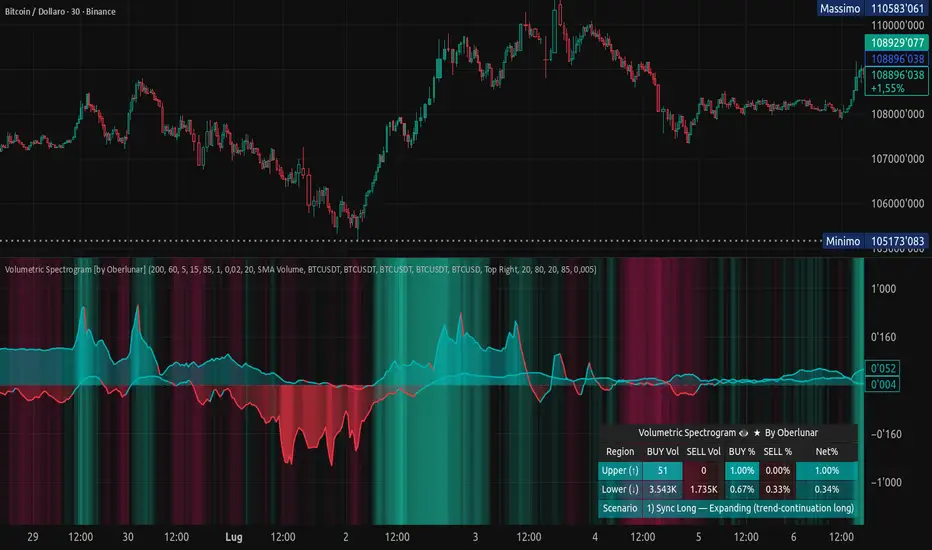
Volumetric Spectrogram [by Oberlunar]Volumetric Spectrogram
A two-pole, price-relative volume profiler that turns regional buy/sell pressure into clean oscillators and actionable regimes in a multi-broker setup.
What it measures
The indicator divides the recent price span into bins and accumulates buy vs. sell volume in each bin, then summarises two regions with respect to the current price:
Upper (↑) — volume that traded above the current price (overhead supply/demand).
Lower (↓) — volume that traded below the current price (underfoot bid/pressure).
Per region, it computes BUY% and SELL%, then forms two normalised oscillators in :
Upper Osc = Upper(BUY%) − Upper(SELL%) → positive when overhead offers are being lifted (breakout acceptance), negative when overhead sell pressure dominates (resistance).
Lower Osc = Lower(BUY%) − Lower(SELL%) → positive when sub-price bids strengthen (support/absorption), negative when selling persists beneath price (weak underbelly).
Both oscillators are optionally smoothed with EMA and can be filled to zero or between curves for quick polarity/strength reading.
Candle-fill modes across brokers
The indicator supports multiple candle-fill policies tied to cross-broker volumetric agreement (e.g., spectral/range-only fills when ≥N brokers align above 70% bullish or below 20% bearish Buy%). This makes regime and pressure shifts visually explicit while filtering out unconfirmed noise.
How it works (core algorithm)
Over a lookback window, find the high/low and split the range into N bins .
For each historical bar, approximate “buy” vs “sell” volume using candle direction and the close relative to each bin’s midprice; update left/right profiles per bin.
Aggregate bins above the current price into the Upper region and bins below into the Lower region; compute regional totals and percentages.
Convert to signed oscillators and smooth (EMA length per input).
Scenario engine (table, every bar)
A compact table reports, for Upper/Lower: BUY Vol, SELL Vol, BUY%, SELL%, and Net%. A classifier labels 8 regimes based on oscillator sign and recent expansion/decay: Sync Long/Short (Expanding/Decaying), Opposite Signs (Widening/Converging), and Tilts (Upper/Lower). This helps distinguish trend continuation, fade risk, compression before break, and asymmetric pressure (e.g., “Tilt Lower — bid/support strengthening”).
# Example strategies and annotated cases:
There are different operational strategies:
1) Bottle-neck Strategy with multi-broker confirmation
When both oscillators are red and they compress toward the zero line (a bottle-neck [/i>), if the squeeze does not flip into the opposite trend but instead resolves in the same direction, you have a continuation setup that can be exploited:
• Pattern: both oscillators red → short, visible contraction (narrow, low-variance cluster) → break of the cluster lows → background shadow bars align bearish (multi-broker agreement).
Example:
This sequence often supports a 1.5–2.5 R/R trade, as in:
Bullish mirror
If both oscillators are teal and compress, then expand upward with multi-broker agreement, the scenario becomes bullish after several bars; the position can be profitable with a reasonable risk setup:
Example:
Follow-through:
Here are the additional, English “playbook” examples you can append to the previous description.
2) Dual-confirmation on volume spikes + multi-broker checks
When pronounced volumetric spikes appear (up or down), trend often reverses sharply. In the figure, the circles highlight the spikes; once the spike subsides (reversion toward baseline), the oscillator turns bullish. The double confirmation of two consecutive minimum spikes acts as support for an ensuing up-move, with fill colors confirming direction.
Chart:
Even with a single spike confirmation, the reversion from an extreme often provides actionable long setups.
3) Volume-pressure + regime-change (multi-broker)
A prospective long configuration emerges when bullish volumetric pressure dominates and bearish pressure fades, especially if this occurs after a lateral phase, followed by a bullish volume spike and multi-broker confirmation .
Chart:
Shadow bars subsequently confirm continuation in a bullish regime; however, a possible regime change is flagged by the scenario classifier and by a color flip in the volumetric borders ( “Possible regime change, but without multi-broker confirmation.” is an appropriate label when applicable).
Chart:
After a verified mean-reversion, price transitions into a bearish configuration: both oscillators turn red. One can wait for a pullback and seek short entries.
Chart:
As shown here, the regime change is anticipated well in advance by the oscillators and multi-broker pressure:
Chart:
4) Contrastive regime-shift with multi-broker validation
In a contrastive trading phase, the lower volumetric oscillator flips color first—buyers start attacking. The first set of background shadow bars does not agree with the regime flip; the second set does. This sequence (oscillator flip → later multi-broker agreement) is a robust early sign of a potential long setup.
Chart:
At the multi-broker level, all shadow bars turn fully green and the setup becomes unambiguously bullish.
Chart:
Note that bearish pressure can still be non-trivial on the volumetric scale—even if it does not reach prior extreme minima—so risk controls should reflect the residual supply.
Delta-bar coloring (optional)
Bars (or candle overlays) can be tinted by a multi-venue weighted bias:
Choose venues (OKX, Coinbase, Bybit, Binance, BlackBull…).
Weight by Equal / Last Volume / SMA Volume.
Apply deadband to suppress flicker around neutrality and a gamma curve to modulate opacity with |bias|.
This layer is independent of the spectrogram core but provides immediate market-wide flow context, consistent with the table and fills.
Inputs (essentials)
Calculation Period and Bins — resolution and depth of the price-range histogram.
EMA length — smoothing per oscillator (optional)
Fill options — to zero / between curves, gradual opacity by |osc|, min/max alpha.
Delta Bar — enable tinting, gamma, neutral band; venue list and weighting mode.
Reading guide
Upper > 0 & expanding : overhead supply is being lifted → breakout acceptance risk rises.
Lower > 0 & expanding : sub-price bids strengthen → pullbacks more likely to absorb.
Opposite signs widening : tug-of-war; avoid late entries.
Converging : compression → prepare for break.
Use the table’s regime label to keep the narrative honest bar-by-bar.
Notes & limits
Buy/Sell attribution uses candle direction and range partitioning (no L2/tick tape).
Venue aggregation relies on per-exchange volume and your chosen weighting; symbols must align (e.g., BTCUSDT pairs).
Oscillators are relative to the current price (regional) by design; they complement, not replace, classical volume profile.
— Oberlunar 👁 ★
Delta Arbitrage [by Oberlunar]Delta Arbitrage turns fragmented exchange activity into a single, readable pulse. Each broker breathes at its own rhythm; this tool measures the share of “buy vs. sell” participation per broker, weights those brokers by liquidity/activity, and blends them into one continuous bias. The result is a chart you can read in seconds: aqua when buy-side dominates, red when sell-side does—stronger shades for stronger imbalances.
Delta Arbitrage indicator supports several ways to colour candles based on the aggregated, cross-venue delta, so you can match visual feedback to the strength/consensus of flow.
Examples
LONG opportunity — broad bullish agreement (>70% weighted Buy%)
In this case, a LONG setup formed because a high proportion of brokers simultaneously pushed bullish volumetric deltas (>70%).
The corridor then stayed positive across multiple bars, with sustained long strength in agreement across venues:
Follow-through:
SHORT opportunity — broad bearish agreement (<20% weighted Buy%)
Here, a SHORT setup formed because a high proportion of brokers simultaneously pushed bearish volumetric deltas (<20%).
The corridor remained negative over several bars, showing high-intensity short pressure in cross-venue agreement:
Follow-through:
Spectral mode
You can enable the spectral mode, where range candles are colored only when multiple brokers are in volumetric agreement. You’ll see bullish pressure when weighted Buy% exceeds ~70%; when direction changes, range candles fade out and the lower tiles flip red to reflect rising short pressure.
Example:
How it’s built (in plain words)
For every selected broker, the script computes a robust Buy% over a rolling window and maps it to a signed bias (−1…+1).
Venues are then combined with flexible weighting—Equal, Last Volume, SMA Volume, or Relative-to-SMA—to emphasise who is active now .
A small neutral band near zero calms noise; an intensity curve (gamma) makes strong pushes visually obvious without overshooting weak ones.
What you see
Tinted bars/background : the aggregate bias colours the chart so the prevailing side is instantly clear.
Dashboard : a compact meter for each venue (SELL⇄BUY), its normalised weight, and exact Buy%/bias, plus a summary line for the weighted & unweighted aggregates. It shows whether one venue is dragging the whole market or if participation is broad.
Lower panel (timeline) : a tile-per-bar strip using the same bias logic. Long, saturated runs = sustained participation; choppy, desaturated tiles around zero = balance/compression. The strip’s height is fixed vs. a recent range, so it remains legible on any zoom.
How to act on it (minimal, auditable rules)
Entries: a one-shot arrow when the weighted Buy% crosses a high/low threshold (e.g., >70 for longs, <30 for shorts).
Exits: trail the indicator itself—close when the weighted Buy% retraces by a set number of points from its peak (long) or trough (short).
Context: prefer entries that align with a fresh, persistent run in the lower strip and supportive rows in the dashboard; fade/exit when the strip desaturates or flips.
Do not operate when the average volumetric pressure (avg) is around 50% +- 15%
Why it matters
This is not tick-level microstructure; it’s a fast, stable cross-venue proxy designed for operational use on any timeframe. By unifying “who’s in charge, for how long, and how strongly,” the indicator reduces discretionary noise and turns participation into a tradable, testable context.
— Oberlunar 👁 ★

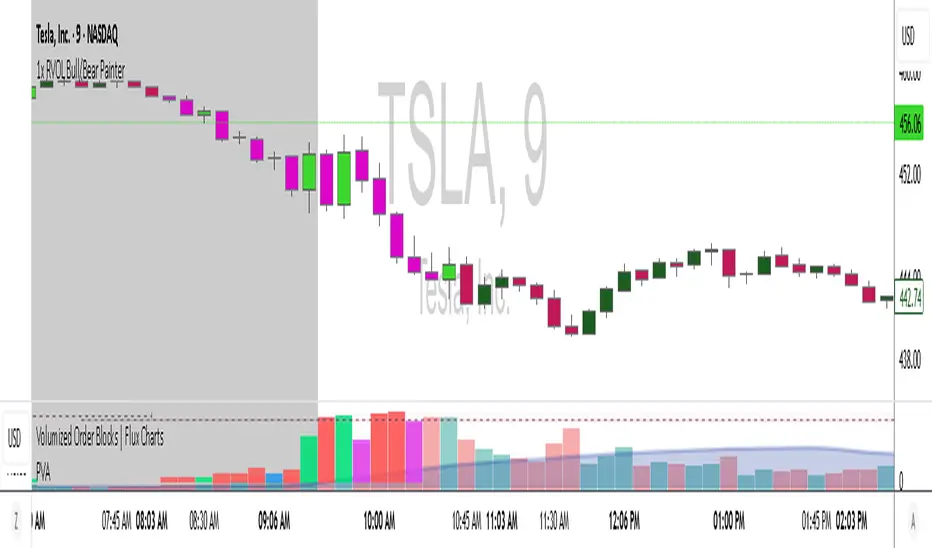
RVOL CandlesRvol indicator shows relative volume on each candle and can be adjusted and color change.
Balanced Delta Volume Profile (Zeiierman)█ Overview
Balanced Delta Volume Profile (Zeiierman) builds a vertical, price-by-price profile that blends total participation with balance quality. Instead of plotting raw volume alone, it weights each price bin by:
how balanced buyers vs. sellers were,
how compressed price was inside that bin,
how often price revisited it.
The result spotlights fair value and acceptance zones while still revealing momentum/imbalance areas—ideal for reading rotation vs. trend, continuation vs. exhaustion, and the prices that truly matter.
Highlights
Balanced score that fuses delta symmetry, price compression, and hit frequency.
Optional heat spectrum for instant read of participation density and balance strength.
POC-like auto highlight of the dominant price level within the lookback window.
Works across timeframes for session profiling, swing context, or regime shifts.
█ How It Works
⚪ Profile Construction
The script scans a fixed History Length and divides the full high–low span into Bin Count price bins. For every bar in the window, its volume is proportionally distributed across the bins it overlaps, so wide-range bars contribute across multiple bins, while narrow bars concentrate where they traded most. This yields per-bin totals for:
Total Volume (participation)
Positive / Negative Volume (up vs. down bar contribution)
Hit Count (how often price touched the bin)
Average Price Range (mean bar range inside the bin; a proxy for compression)
⚪ Delta & Direction
For each bin, delta symmetry is measured via the ratio of |pos − neg| to total volume. Bins with balanced two-sided flow score higher than one-sided, runaway bins. This curbs the tendency of raw volume profiles to over-reward impulsive bursts.
⚪ Balance Score
Each price bin gets a balance score that multiplies three normalized components:
Delta Balance: rewards bins where buy/sell pressure is symmetrical (configurable via Volume Momentum Weight).
Price Compression: rewards bins where average bar range is relatively small (configurable via Price Momentum Weight).
Durability: rewards bins revisited often (configurable via Hits Weight).
A Min Hits Filter removes flimsy, single-touch bins from dominating the score. The profile can display pure totals or Average Mode (Vol/Hit) to compare bins fairly when hit counts differ.
⚪ Display & Heat Spectrum
The final plotted bar length per bin is the display volume (total or average) weighted by the balance score and normalized to 100.
POC-like Highlight: The 100% bin is outlined (and labeled) when Highlight Max Volume Bin is ON.
Heat Spectrum (optional): A background gradient scales with normalized bar length and balance hue.
Balance Hue: Interpolates between Balance Low/High Colors so high-balance bins visually pop as “accepted value.”
█ How to Use
The profile is effectively a map of price acceptance:
High, bright bars = strong participation at balanced prices → fair value/rotation zones.
Thin, muted bars = poor acceptance → imbalance or transition areas.
POC-style level = most influential price in the lookback window.
⚪ Find Fair Value & Acceptance
Thick, high-balance bins mark value. Expect rotation: price often revisits or oscillates around these areas. They’re prime zones for mean-reversion fades, scale-ins, and risk-defined trades against the edges.
⚪ Identify Imbalance & Funnels
Low-balance, low-hit bins often act like air pockets—price can move through them quickly. These zones are helpful for continuation trades into thin areas or for timing breakout pulls back into acceptance.
⚪ POC Dynamics
When price leaves the POC and returns, watch for re-acceptance (price comes back into the POC or high-balance zone and stays there.) vs. rejection (trend continuation away from value). The auto-highlight makes this quick to judge.
█ Settings
History Length – Bars scanned for the profile. Longer = broader context, slower to adapt.
Bin Count – Vertical resolution of bins between the window’s min and max price.
Display Shift – Offsets the rendering rightward for clarity.
Average Mode (Vol/Hit) – ON uses average volume per visit; OFF uses total volume.
Volume Momentum Weight – Emphasizes two-way flow; higher values favor balanced bins over one-sided deltas.
Price Momentum Weight – Emphasizes compression; higher values favor narrow-range, coiling price action.
Hits Weight – Rewards bins revisited often; higher values favor durable acceptance.
Min Hits Filter – Minimum visits a bin needs to qualify for the balance score.
Show Heat Spectrum – Background gradient for quick read of density and balance.
Highlight Max Volume Bin – Outline + raw volume label for the dominant bin.
Max Volume Color – Color used for that highlight.
Balance Low/High Colors – Gradient endpoints for balance hue across the profile.
-----------------
Disclaimer
The content provided in my scripts, indicators, ideas, algorithms, and systems is for educational and informational purposes only. It does not constitute financial advice, investment recommendations, or a solicitation to buy or sell any financial instruments. I will not accept liability for any loss or damage, including without limitation any loss of profit, which may arise directly or indirectly from the use of or reliance on such information.
All investments involve risk, and the past performance of a security, industry, sector, market, financial product, trading strategy, backtest, or individual's trading does not guarantee future results or returns. Investors are fully responsible for any investment decisions they make. Such decisions should be based solely on an evaluation of their financial circumstances, investment objectives, risk tolerance, and liquidity needs.

Weis Wave Volume MTF 🎯 Indicator Name
Weis Wave Volume (Multi‑Timeframe) — adapted from the original “Weis Wave Volume by LazyBear.”
This version adds multi‑timeframe (MTF) readings, configurable colors, font size, and screen position for clear dashboard‑style display.
🧠 Concept Background — What is Weis Wave Volume (WWV)?
The Weis Wave Volume indicator originates from Wyckoff and David Weis’ techniques.
Its purpose is to link price movement “waves” with the amount of traded volume to reveal how strong or weak each wave is.
Instead of showing bars one by one, WWV accumulates the total volume while price keeps moving in the same direction.
When price direction changes (up → down or down → up), it:
Finishes the previous wave volume total.
Starts a new wave and begins accumulating again.
Those wave volumes help traders see:
Effort vs Result: Big volume with small price move ⇒ absorption; low volume with big move ⇒ weak participation.
Trend confirmation or exhaustion: High volume waves in trend direction strengthen it, while low‑volume waves hint exhaustion.
⚙️ How this Script Works
Trend & Wave Detection
Compares close with the previous bar to determine up or down movement (mov).
Detects trend reversals (when mov direction changes).
Builds “waves,” each representing a continuous run of bars in one direction.
Volume Accumulation
While price keeps the same direction, the script adds each bar’s volume to the running total (vol).
When direction flips, it resets that total and starts a new wave.
Multi‑Timeframe Computation
Calculates these wave volumes on three timeframes at once, chosen dynamically:
Active Chart Timeframe Displays WWV for:
1 min 1 min
5 min 5 min
15 min 15 min
Any other Chart TF
It uses request.security() to pull each timeframe’s latest WWV value and current wave direction.
Visual Output
Instead of plotting histogram bars, it shows a table with three numeric values:
WWV (1): 25.3 M | (15): 312 M | (240): 2.46 B
Each value is color‑coded:
user‑selected Uptrend Color when price wave = up
user‑selected Downtrend Color when wave = down
You can position this small table in any corner/center (top / bottom × left / center / right).
Font size is user‑adjustable (Tiny → Huge).
📈 How Traders Use It
Quickly gauge buying vs selling effort across multiple horizons.
Compare short‑term wave volume to higher‑timeframe waves to spot:
Alignment → all up and big volumes = strong trend
Divergence → small or opposite‑colored higher‑TF wave = potential reversal or pause
Combine with Wyckoff, VSA, or standard trend analysis to judge if a breakout or pullback has real participation.
🧩 Key Features of This Version
Feature Description
Multi‑Timeframe Panel Displays WWV values for 3 selected TFs at once
Dynamic TF Mapping Auto‑adjusts which TFs to use based on chart
Up/Down Color Coding Customizable colors for wave direction
Adjustable Font and Placement Set font size (Tiny→Huge) and screen corner/center
No Histograms Keeps chart clean; acts as a compact WWV dashboard

Percentile Rank Oscillator (Price + VWMA)A statistical oscillator designed to identify potential market turning points using percentile-based price analytics and volume-weighted confirmation.
What is PRO?
Percentile Rank Oscillator measures how extreme current price behavior is relative to its own recent history. It calculates a rolling percentile rank of price midpoints and VWMA deviation (volume-weighted price drift). When price reaches historically rare levels – high or low percentiles – it may signal exhaustion and potential reversal conditions.
How it works
Takes midpoint of each candle ((H+L)/2)
Ranks the current value vs previous N bars using rolling percentile rank
Maps percentile to a normalized oscillator scale (-1..+1 or 0–100)
Optionally evaluates VWMA deviation percentile for volume-confirmed signals
Highlights extreme conditions and confluence zones
Why percentile rank?
Median-based percentiles ignore outliers and read the market statistically – not by fixed thresholds. Instead of guessing “overbought/oversold” values, the indicator adapts to current volatility and structure.
Key features
Rolling percentile rank of price action
Optional VWMA-based percentile confirmation
Adaptive, noise-robust structure
User-selectable thresholds (default 95/5)
Confluence highlighting for price + VWMA extremes
Optional smoothing (RMA)
Visual extreme zone fills for rapid signal recognition
How to use
High percentile values –> statistically extreme upward deviation (potential top)
Low percentile values –> statistically extreme downward deviation (potential bottom)
Price + VWMA confluence strengthens reversal context
Best used as part of a broader trading framework (market structure, order flow, etc.)
Tip: Look for percentile spikes at key HTF levels, after extended moves, or where liquidity sweeps occur. Strong moves into rare percentile territory may precede mean reversion.
Suggested settings
Default length: 100 bars
Thresholds: 95 / 5
Smoothing: 1–3 (optional)
Important note
This tool does not predict direction or guarantee outcomes. It provides statistical context for price extremes to help traders frame probability and timing. Always combine with sound risk management and other tools.

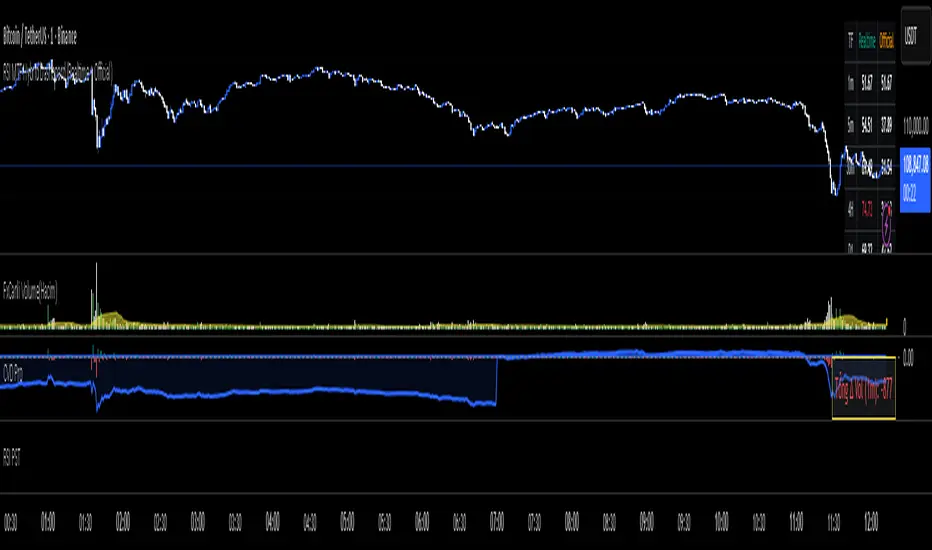
RKT_(CVD + Δ Vol) DESCRIPTION
The Volume & Volume Delta (CVD) indicator tracks buy–sell imbalance to gauge money flow strength. Delta is calculated from aggressive (market) volume and accumulated into CVD to identify directional flow. Suitable for crypto/futures/forex, intraday and swing trading.
HOW TO USE
When Delta > 0 and CVD makes higher highs → favor the uptrend; when Delta < 0 and CVD makes lower lows → favor the downtrend.
Divergence between price and CVD suggests potential reversals or pullbacks.
Recommend confirming with price structure/MA/volume before acting.
RightFlow Universal Volume Profile - Any Market Any TimeframeSummary in one paragraph
RightFlow is a right anchored microstructure volume profile for stocks, futures, FX, and liquid crypto on intraday and daily timeframes. It acts only when several conditions align inside a session window and presents the result as a compact right side profile with value area, POC, a bull bear mix by price bin, and a HUD of profile VWAP and pressure shares. It is original because it distributes each bar’s weight into multiple mid price slices, blends bull bear pressure per bin with a CLV based split, and grows the profile to the right so price action stays readable. Add to a clean chart, read the table, and use the visuals. For conservative workflows read on bar close.
Scope and intent
• Markets. Major FX pairs, index futures, large cap equities and ETFs, liquid crypto.
• Timeframes. One minute to daily.
• Default demo used in the publication. SPY on 15 minute.
• Purpose. See where participation concentrates, which side dominated by price level, and how far price sits from VA and POC.
Originality and usefulness
• Unique fusion. Right anchored growth plus per bar slicing and CLV split, with weight modes Raw, Notional, and DeltaProxy.
• Failure mode addressed. False reads from single bar direction and coarse binning.
• Testability. All parts sit in Inputs and the HUD.
• Portable yardstick. Value Area percent and POC are universal across symbols.
• Protected scripts. Not applicable. Method and use are fully disclosed.
Method overview in plain language
Pick a scope Rolling or Today or This Week. Define a window and number of price bins. For each bar, split its range into small slices, assign each slice a weight from the selected mode, and split that weight by CLV or by bar direction. Accumulate totals per bin. Find the bin with the highest total as POC. Expand left and right until the chosen share of total volume is covered to form the value area. Compute profile VWAP for all, buyers, and sellers and show them with pressure shares.
Base measures
Range basis. High minus low and mid price samples across the bar window.
Return basis. Not used. VWAP trio is price weighted by weights.
Components
• RightFlow Bins. Price histogram that grows to the right.
• Bull Bear Split. CLV based 0 to 1 share or pure bar direction.
• Weight Mode. Raw volume, notional volume times close, or DeltaProxy focus.
• Value Area Engine. POC then outward expansion to target share.
• HUD. Profile VWAP, Buy and Sell percent, winner delta, split and weight mode.
• Session windows optional. Scope resets on day or week.
Fusion rule
Color of each bin is the convex blend of bull and bear shares. Value area shading is lighter inside and darker outside.
Signal rule
This is context, not a trade signal. A strong separation between buy and sell percent with price holding inside VA often confirms balance. Price outside VA with skewed pressure often marks initiative moves.
What you will see on the chart
• Right side bins with blended colors.
• A POC line across the profile width.
• Labels for POC, VAH, and VAL.
• A compact HUD table in the top right.
Table fields and quick reading guide
• VWAP. Profile VWAP.
• Buy and Sell. Pressure shares in percent.
• Delta Winner. Winner side and margin in percent.
• Split and Weight. The active modes.
Reading tip. When Session scope is Today or This Week and Buy minus Sell is clearly positive or negative, that side often controls the day’s narrative.
Inputs with guidance
Setup
• Profile scope. Rolling or session reset. Rolling uses window bars.
• Rolling window bars. Typical 100 to 300. Larger is smoother.
Binning
• Price bins. Typical 32 to 128. More bins increase detail.
• Slices per bar. Typical 3 to 7. Raising it smooths distribution.
Weighting
• Weight mode. Raw, Notional, DeltaProxy. Notional emphasizes expensive prints.
• Bull Bear split. CLV or BarDir. CLV is more nuanced.
• Value Area percent. Typical 68 to 75.
View
• Profile width in bars, color split toggle, value area shading, opacities, POC line, VA labels.
Usage recipes
Intraday trend focus
• Scope Today, bins 64, slices 5, Value Area 70.
• Split CLV, Weight Notional.
Intraday mean reversion
• Scope Today, bins 96, Value Area 75.
• Watch fades back to POC after initiative pushes.
Swing continuation
• Scope Rolling 200 bars, bins 48.
• Use Buy Sell skew with price relative to VA.
Realism and responsible publication
No performance claims. Shapes can move while a bar forms and settle on close. Education only.
Honest limitations and failure modes
Thin liquidity and data gaps can distort bin weights. Very quiet regimes reduce contrast. Session time is the chart venue time.
Open source reuse and credits
None.
Legal
Education and research only. Not investment advice. Test on history and simulation before live use.

5x Relative Volume vs 30-Day AverageRelative Volume.
If today's volume is more than average of last 30 days volume by 5x.

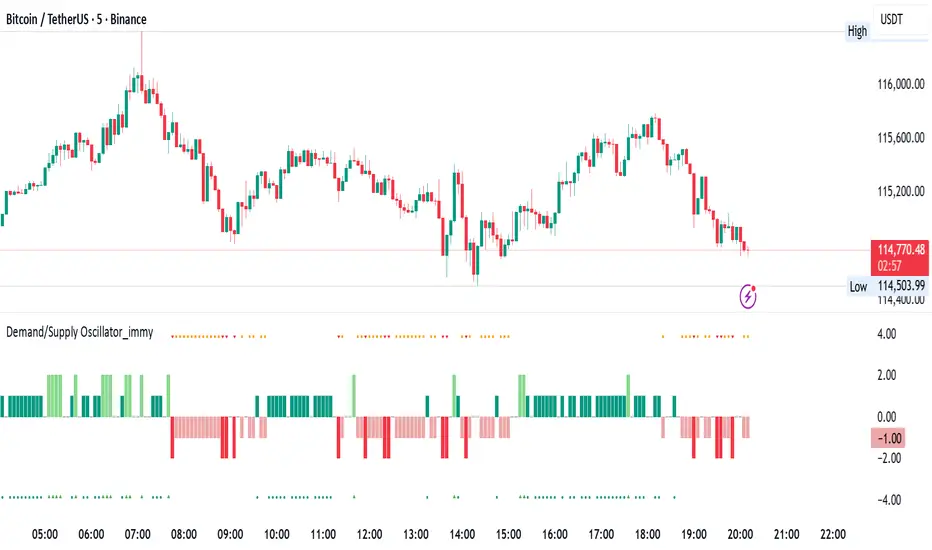
Demand/Supply Oscillator_immyDemand/Supply Oscillator, probably the only D/S oscillator on TV which doesn't draw the lines on the chart but to show you the actual reasons behind the price moves.
Concept Overview
A demand/supply oscillator would aim to look for the hidden spots/order which institutes place in small quantities to not to upset the trend and suddenly place one big order to liquidate the retailers and make a final big move.
The lite color candles in histogram shows the hidden demand/supply which is the reason behind the sudden price pullback, even for short period of time.
Measure demand and supply based on volume, price movement, or candle structure
Identify price waves or impulses (e.g., using fractals, zigzag, or swing high/low logic)
Detect hidden demand/supply (e.g., low volume pullbacks or absorption zones)
Plotted on histogram boxes to visualize strength and direction of each wave
What “Hidden Demand” Means?
Hidden demand refers to buying pressure that isn’t immediately obvious from price action — in other words, buyers are active “behind the scenes” even though the price doesn’t yet show strong upward movement.
What Hidden supply Means?
refers to selling pressure that isn’t obvious yet on the price chart. It means smart money (big players) are quietly selling or distributing positions, even though the price might not be dropping sharply yet.
It usually appears when:
The price is pulling back slightly (down candle),
But volume or an oscillator (like RSI, MACD, or OBV) shows bullish strength (e.g., higher low or positive divergence).
That suggests smart money is accumulating (buying quietly) while the public may think it’s just a normal dip.
💹 Price Reaction — Up or Down?
If there is hidden demand, it’s generally a bullish signal → meaning price is likely to go up afterward.
However, on that exact candle, the price may still be down or neutral, because:
Hidden demand is “hidden” — buyers are absorbing supply quietly.
The move up usually comes after the hidden demand signal, not necessarily on the same candle.
📊 Example
Suppose:
Price makes a slightly lower low,
But RSI makes a higher low → this is bullish (hidden) divergence, or “hidden demand.”
➡️ Interpretation:
Smart buyers are stepping in → next few candles likely move up.
The current candle might still be red or show a small body — that’s okay. The key is the shift in underlying strength.
🧭 Quick Summary
Term Meaning Candle Effect Expected Move After
Hidden Demand Buyers active below surface Candle may still go down or stay flat
Hidden Supply Sellers active behind the scenes Price likely to rise soon
🛠️ Key Components
Best results with Price/Action e.g. Use swing high/low or zigzag to segment price into waves.
Optionally apply fractal logic for more refined wave detection
Combine with other indicators (e.g., RSI, OBV) for confirmation
Include zone strength metrics (e.g., “Power Number” as seen in some indicators)
Demand/Supply Calculation
Demand: Strong bullish candles, increasing volume, breakout zones
Supply: Strong bearish candles, volume spikes on down moves
Hidden Demand/Supply: Pullbacks with low volume or absorption candles
Histogram Visualization
Use plot() or plotshape() to draw histogram bars
Color-code bars: e.g., green for demand, red for supply, lite colors for hidden zones
Add alerts for wave transitions or hidden zone detection
How It Works
Demand/Supply: Detected when price moves strongly with volume spikes.
Hidden Zones: Detected when price moves but volume is low (potential absorption).
Histogram Values:
+2: Strong Demand
+1: Hidden Demand
-1: Hidden Supply
-2: Strong Supply
0: Neutral
Feature Demand (Visible) Hidden Demand
Visibility Clearly seen on price charts Subtle, often masked in consolidation
Participants Retail + Institutional Primarily Institutional
Price Behavior Sharp rallies from zone Sideways movement, low volatility
Tools to Identify Candlestick patterns, support zones Volume profile, order flow, price clusters
Risk/Reward Moderate (widely known) High (less crowded, early entry potential)
Market Order BubblesMarket Order Bubbles is a streamlined, volume-driven overlay indicator designed to spotlight sudden spikes in trading activity, highlighting potential shifts in market momentum.
By detecting deviations in volume from its recent average, it plots intuitive bubble markers to reveal aggressive order flows—ideal for traders seeking early warnings of exhaustion or reversal setups in fast-moving markets.
What makes this indicator different
This indicator draws inspiration from established volume analysis tools but stands out with a refined, lightweight approach. Unlike more complex models that layer multiple filters or emulate cumulative metrics, it leverages a weighted moving average (WMA) of volume paired with statistical deviation for a direct, responsive measure of "surge intensity."
This results in cleaner signals with less noise, making it particularly suited for intraday scalpers or swing traders who value simplicity without sacrificing depth. The focus on excess volume relative to a dynamic baseline ensures bubbles only emerge during truly anomalous activity, setting it apart from generic volume oscillators or basic footprint indicators that often flood charts with irrelevant data.
Core Mechanics
At its heart, the indicator computes a smoothed volume baseline using a WMA over a user-defined period, then applies a volatility-adjusted threshold derived from the standard deviation of that same period. A "surge" triggers when actual volume exceeds this baseline plus the threshold, with the excess amount determining bubble size. Price direction (bullish or bearish close) classifies the surge as buying or selling pressure:
Buy Surges (plotted as blue bubbles above the bar): Indicate potential overextension in upward moves.
Sell Surges (plotted as red bubbles below the bar): Flag possible downside fatigue.
Bubble opacity and size scale with surge magnitude—fainter, smaller bubbles for mild excesses; bolder, larger ones for extreme outliers—providing a visual gradient of intensity at a glance.
How to use this tool:
Use this tool as a contrarian edge to anticipate potential pullbacks or reversals, rather than chasing the trend. Large clusters of buy bubbles during a rally could signal "capitulation" from late entrants or forced covers, priming the market for a downside move. Conversely, sell bubbles in a downward move can mark bottoming exhaustion, cueing possible upside bounces.
For best results:
Confluence: Pair with price action, momentum indicators, or other orderflow tools.
Timeframe Flexibility: Excels on low timeframe for day trading; scale up to hourly for swings.
Treat bubbles as filters, not standalone signals—always confirm with broader context.
In essence bubbles don't predict direction but can illuminate when the crowd's aggression might soon flip.
Bubble Sizing and Interpretation
Bubbles are tiered by surge strength for quick assessment:
Small Bubbles: Minor excess — a little more pressure on volume.
Medium Bubbles: Notable excess — moderate alert.
Large Bubbles: Major excess — high-impact event.
Customizing Settings
The indicator keeps things minimal with just two changeable inputs, highlighting quick tweaks without overwhelming options.
WMA Length (default: 100): Controls the lookback for the volume baseline. Increase for smoother, less reactive signals (fewer but more reliable bubbles in volatile assets). Decrease for heightened sensitivity (more frequent alerts in choppy sessions).
Threshold Multiplier (default: 1.5): Scales the deviation buffer. Higher values tighten criteria, reducing bubble frequency for more conservative filtering; lower values loosen it, capturing subtler surges but risking more noise.
These adjustments let traders dial in the indicator to their style.

Volume Profile Area [BigBeluga]🔵 OVERVIEW
The Volume Profile Area is an advanced profiling tool that calculates and visualizes the value area within a chosen period’s volume distribution. It first builds a main profile of the entire range, then constructs a secondary profile inside the defined value area, allowing traders to examine market balance and key trading zones in greater detail.
🔵 CONCEPTS
Volume Profile – Distributes traded volume across price levels to highlight areas of market activity.
Value Area (VA) – The price range containing a chosen percentage of total volume (commonly 50–70%).
Point of Control (PoC) – The price level with the highest traded volume, often acting as a magnet for price.
Nested Profiles – A profile inside the VA adds a second layer of precision, showing where liquidity clusters within the “fair value” zone.
🔵 FEATURES
Main Profile – Full distribution of volume over the selected lookback period.
Secondary Profile – Built only inside the VA of the main profile, highlighting intrabalance structure.
Customizable PoC Selection – Choose between showing the PoC of the
Main Profile ,
the Area Profile ,
their Average ,
or None .
Dynamic Value Area Levels – Automatically plots VAL (Value Area Low) and VAH (Value Area High) with labels.
Overlay Toggles – Show/hide range extremes, VA lines, or PoCs for a cleaner chart view.
Visual Profiles – Main profile shaded in darker blue; the VA profile inside is lighter for clear separation.
Automatic Scaling – Profiles adapt to period highs/lows and auto-adjust bins for consistent resolution.
Volume Labels – PoCs can display traded volume, giving numeric confirmation of liquidity concentration.
🔵 HOW TO USE
Set the Period to define how many bars to include in the main profile.
Adjust the Value Area % to control how much volume defines the VA (e.g., 50% by default).
Pick your PoC option: Main , Area , or Average , depending on focus.
Use VAH/VAL lines as support/resistance levels where most trading occurred.
Compare reactions at Main vs VA PoC levels to spot potential breakouts or mean reversions.
🔵 CONCLUSION
The Volume Profile Area extends traditional profiling by nesting a secondary VA profile inside the main distribution. This dual-layer approach reveals not just where the market was active overall, but where liquidity concentrated within the “fair value” zone—powerful for refining entries, exits, and risk placement across intraday and swing horizons.

Volume + MA5 & MA10This Volume + MA5 & MA10 (Technical Volume Trend Analysis)
The Volume + MA5 & MA10 indicator provides a precise view of market participation and volume momentum by combining raw volume data with two moving averages (MA5 and MA10). It’s designed for traders who rely on volume-based confirmation to validate price movements, breakouts, and trend reversals.
🔍 Overview
This indicator displays volume bars alongside two smooth volume averages — MA5 (short-term) and MA10 (medium-term) — making it easier to detect shifts in market activity.
When the short-term average crosses above or below the long-term average, it signals a potential change in trading intensity or market sentiment.
⚙️ Key Features
Dual Volume Moving Averages (MA5 & MA10) for short- and medium-term analysis.
Dynamic Bar Coloring based on whether current volume exceeds MA5 or MA10.
Crossover Detection with visual markers for MA5/MA10 intersections.
Alert Conditions to notify you of significant volume trend shifts.
Fully customizable appearance and smoothing options.
📊 How to Interpret
MA5 > MA10 → Increasing short-term volume activity (strengthening momentum).
MA5 < MA10 → Decreasing short-term volume (weakening participation).
Rising volume with price → Confirms trend strength.
Falling volume with rising/falling price → Suggests potential reversal or reduced conviction.
💡 Applications
Confirm breakouts and trend continuations.
Identify momentum divergences between price and volume.
Filter out low-volume or weak-trend setups.
Combine with RSI, MACD, or moving averages for enhanced signal validation.
✅ Advantages
Simple yet powerful structure for clean visual analysis.
Works across all timeframes and markets (crypto, stocks, forex, indices).
No repainting — reliable for both live and historical backtesting.
Use Volume + MA5 & MA10 to strengthen your technical analysis and gain a deeper understanding of how market participation drives price trends.
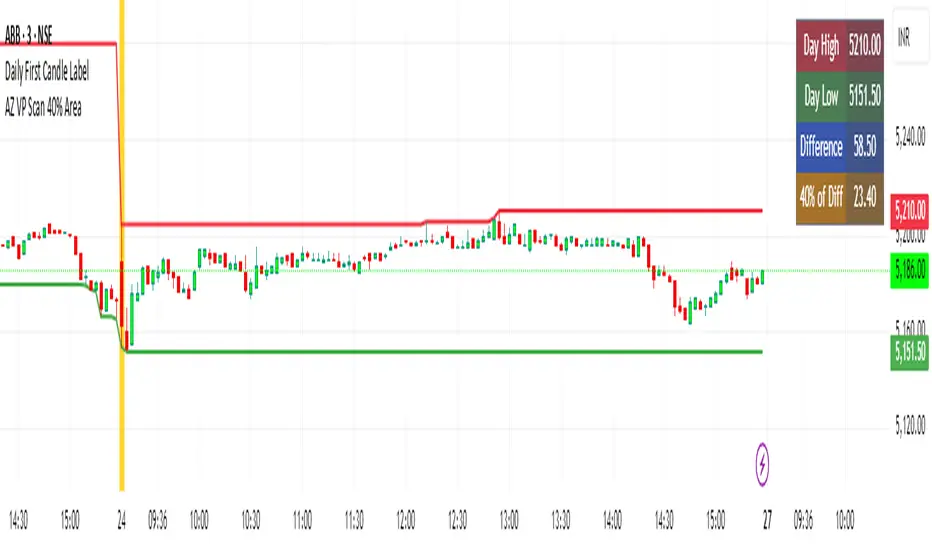
AZ VP Scan 40% AreaThis indicator is developed by Ankur Zaveri, Gujarat, India. This indicator marks the Day's High and Day's Low for the underlying and calculates the difference between the two extrme values of the day in a separate table on the chart. It also shows 40% value of the difference between the Day's High and Day's Low to help scan the underlyings for taking trades based on Volume Profile.