Bitmex BTC Perpetual Premium and FundingThis script tracks the premium (default red line) and the funding rate (default yellow area) of the Bitmex XBTUSD pair perpetual contract.
The calculations are based on the 8H TWAP of interest rates and premium index from Bitmex.
XBTUSD
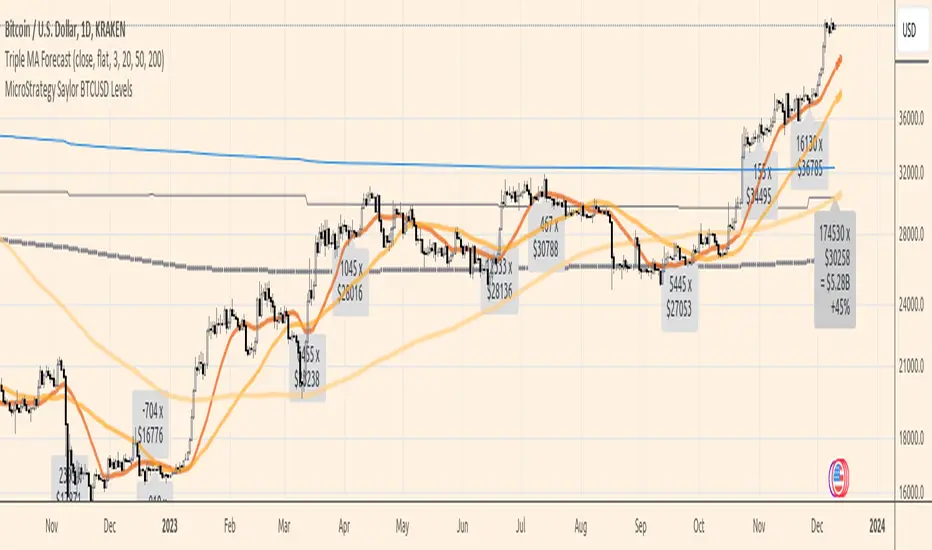
MicroStrategy Saylor BTCUSD LevelsDisplays the price levels of MicroStrategy's Bitcoin acquisitions according to their 8-K filings, total accumulated BTC, average USD price, and current gain.
Bitcoin Top Finder by DataDaterBitcoin Top Finder is an indicator that detects the absolute top of BTCUSD in each bull cycle (red line). It is also helpful in detecting bottoms of cycle (blue). It is based on cost of electricity and mining hash rate.
If you'd like access to this script, please send me a direct message.

PT Crypto Kill ZonesVersion 1.0 of our PT Crypto Kill Zones indicator helps create a visual of specific times throughout the trading day, which we can expect volatility. The market moves within particular sessions. These sessions are broken up as such in three segments, NY, London & Asia.
Toggles -
Market Open highlights the opening of each market.
Daily Zone – highlights a period around the daily crypto candle close.
NY Open Zone – highlights a period around the NY market open.
NY Close Zone – highlights a period around the NY market close.
London Open Zone – highlights a period around the London market open.
London Open Zone – highlights a period around the London market close.
Asia Zone – highlights a period around the Asia market open.
Preferred zones are settings we came up with by running backtests to figure out which periods are close to the kill zones, which offer a better reaction.
Strategy: Use the sub 1h time-frame (30m is ideal) and scalp the London & NY zones with the PT Liquidity & PT Buy/Sell indicator.
This Oscillator was built around our buy sell & Liquidity indicator for scalping. It is included as part of the library. Just message us for access!

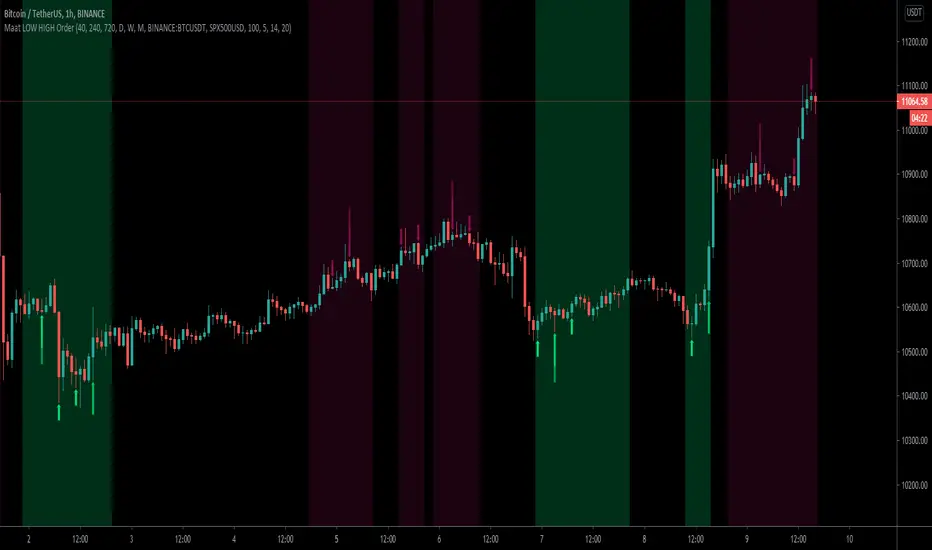
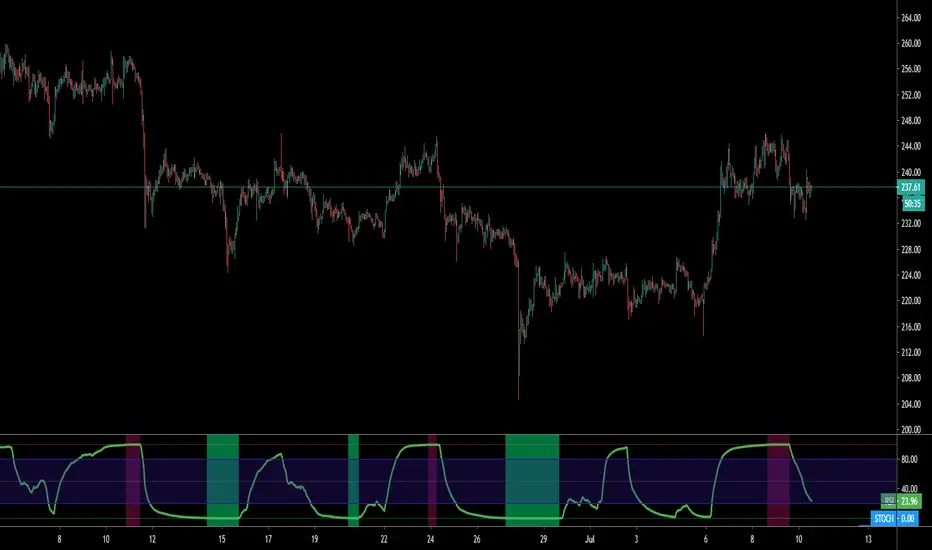
Maat LOW HIGH OrderWelcome to Maat LOW HIGH Order
Maat LOW HIGH Order is an oscillator based on volume weighted RSI and it can show local lows quite nicely (green arrows). The red arrows can indicate a local overbought area and can be uses as a sell or take profit signal. The length of the arrow is defined by the time frame. Highest time frame -> longest arrow. Arrows can also overlap to indicate a stronger signal.
Shorting on red arrows is not reliable yet.
Huge part is the multi time frame addition, so you can get a confirmation from multiple time frames on one screen.
Check the settings I used for 1h chart. Lower TF also possible, just change the settings accordingly.
To make this even more precise I incorporated my HORUS script as a filter. The HORUS checks the spread of two tickers and may indicate oversold / overbought conditions compared to one or the other (Eg. BTCUSD and SPX500).
That way you will only see green / red arrows when HORUS is also showing some overbought / oversold signs.
Use other indicators and PA for more confluence.
Wuuzzaa
BITCOIN Miners Revenue VS Price Correlation OscillatorUse 3D(3-day candle) as timeframe for best reading.
------
original template for Correlation indicator was created by obaranova. credit goes to her.

[2020 Updated]Bitcoin Logarithmic Growth CurvesCredit goes to the original writer of the script, Quantadelic, who generously allowed anyone to copy/edit. I adjusted the value of the bottom/top intercept and slope to better fit the March 2020 coronavirus dip.
Use Bitstamp BTCUSD for better reading.

Horus Spreadmaster
Hello Traders,
Horus Spreadmaster is an oscillator based on the spread of two tickers and may indicate oversold / overbought conditions compared to one or the other . You can also setup an other time frame.
How it works?
- Setup the tickers
- Check the invert box if you have the correct ticker order
- Setup any time frame you want
- Display Stochastic
- Display StochRSI
If its indicated overbought, this does not mean it can't go higher. Same the other way around.
Use other indicators and PA for more confluence.
Wuuzzaa
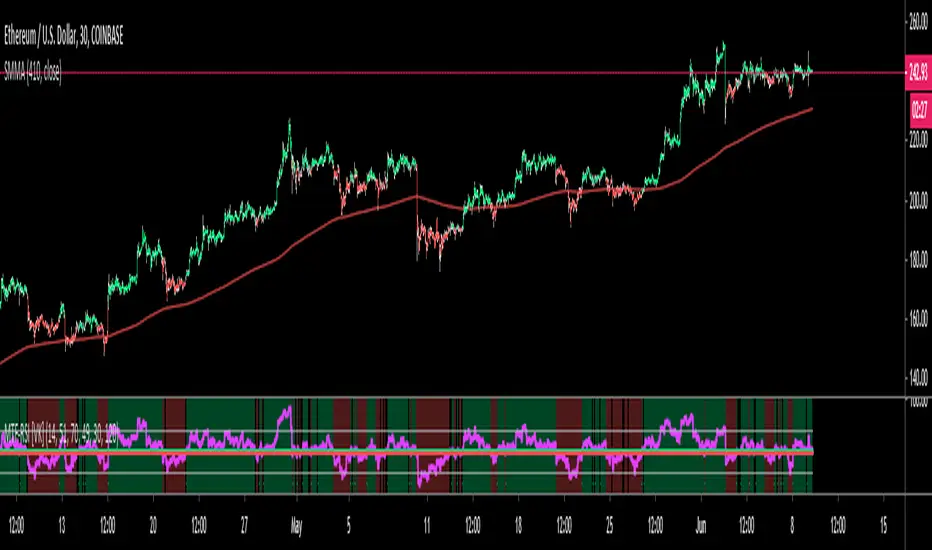
MACD Trend [VK]This strategy shows the trend using MACD
Use higher TF for better view
Combine MTF -RSI for entry points and use both indicators together to better understand the trend
THANK YOU

15 SquidwardsThis is a unfinished script and ONLY works on 15min and XBTUSD, its not tested for other exchanges and it gives different results there from what I saw!
The things I wanted to Implement but Im too lazy for it bcs I dont use indicators anyways:
Divergences - would take allot of time to make it work, but it would fix some issues with this
loosing or gaining support - higher timeframe lost supports or gained supports should make the indicator ignore the next longs until it dumps a certain %, but I did not find a way to make a script that detects S/R the way I want
Auto adjusting - the indicator is sensitive in what market phase it is, I tried to filter out the inaccurate market phases, but if it was auto adjusting I would not have to do that, not sure how well can you make it auto adjust but it would certainly help to a extent
The mods did not allow me to put a password on the script so here you go, just dont come at me screaming how you lost money, thank you <3
And almost forgot
Modified again by Deppengu for 15min scalps by implementing: Modified Wavetrend, Squid Indicator V2(Woody CCI, TTM, GODMODE, RSI), Intrabar Volume, and a few filters and modifications

MTF-RSI+Candles [VK]This is the strategy where we buy when RSI is above 51 line and sell below 49 line
Ability to change RSI TF
Ability to change default value of RSI/upline/lowline/oversold/overbought lines
Ability to switch show/hide backgrount color
Ability to switch on/off candle colors when RSI crosses up/upline down/lowline
Ability to plot B/S signals when RSI crosses up/upline down/lowline
alerts added
can also be used as standard RSI
MA Pull [VK] - alert version of vkscalperThis is the alert version of vkscalper
you will need to change the settings for different TF also try changing MA types
Ability to choose MA types
Ability to plot stop loss / take profit lines
simply select buy alert or sell alert for alerts

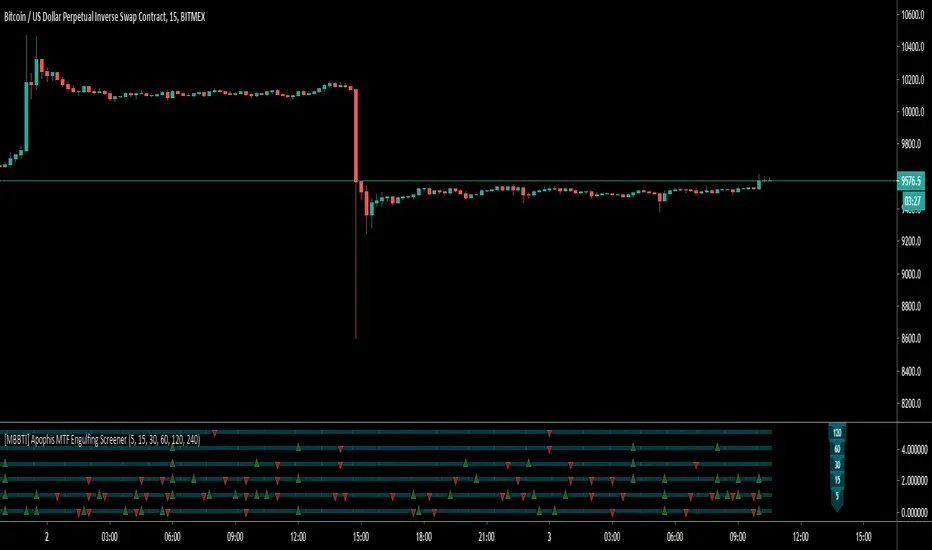
[MBBTI] Apophis MTF Engulfing ScreenerHello Traders,
Apophis MTF Engulfing Screener is based on Daveatt's Engulfing Screener and will screen for engulfing candles on multible time frames. It can help detecting not obvious engulfing candles.
How it works?
- choose your preferable time frames
- green triangle up -> bullish engulfing on this time frame
- red triangle down -> bearish engulfing on this time frame
Contact me if you have any questions or change requests
Wuuzzaa
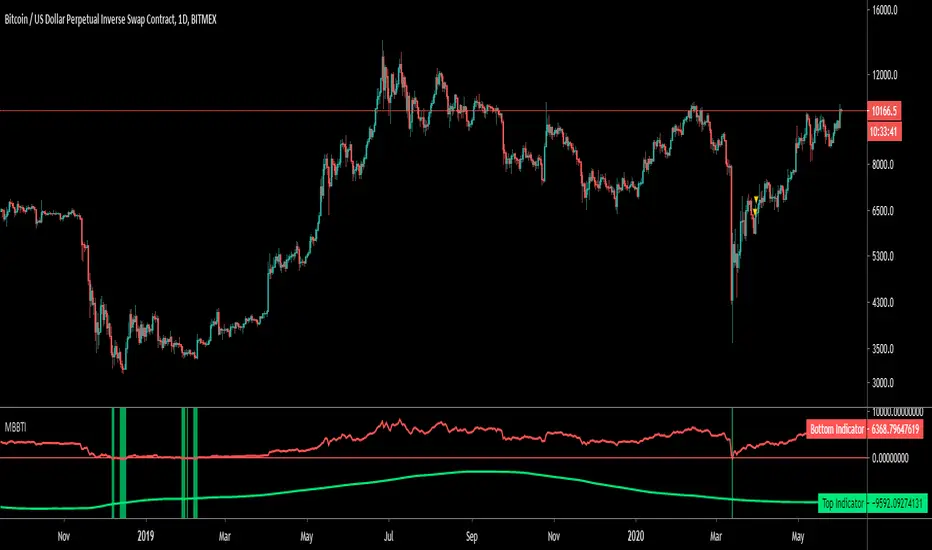
[MBBTI] BTC Thot
Hello Traders,
Thot is indicator which utilizes moving averages to indicate the potential high or bottom.
How it works?
- it utilizes different moving averages and weighting them with fibonacci multiples.
- some crosses proved indicating highs and lows in the past
- red indicates potential high
- green indicates potential low
- only good on daily chart
- check BLX for past performance
Note: This is based on past performance an not quarantining any future performance.
Contact me if you have any questions or change requests
Wuuzzaa

Relative Volume Bars / Moving AverageThis indicator is highly experimental and settings are meant to be adapted to your time frame and asset of choice.
This indicator is a moving average that focuses on relative volume instead of all volume. It only factors in prices of candles that are meeting your relative volume input.
The multipliers can be used to smooth your average towards buy side or sell side or keep them the same.
I have also added in averages for buy side only and sell side only, these are highly experimental and turned off by default. Feel free to play with them.
This indicator is free to all Oasis Trading Group Members.
For Access or Questions Please Private Message Us, Thank you.

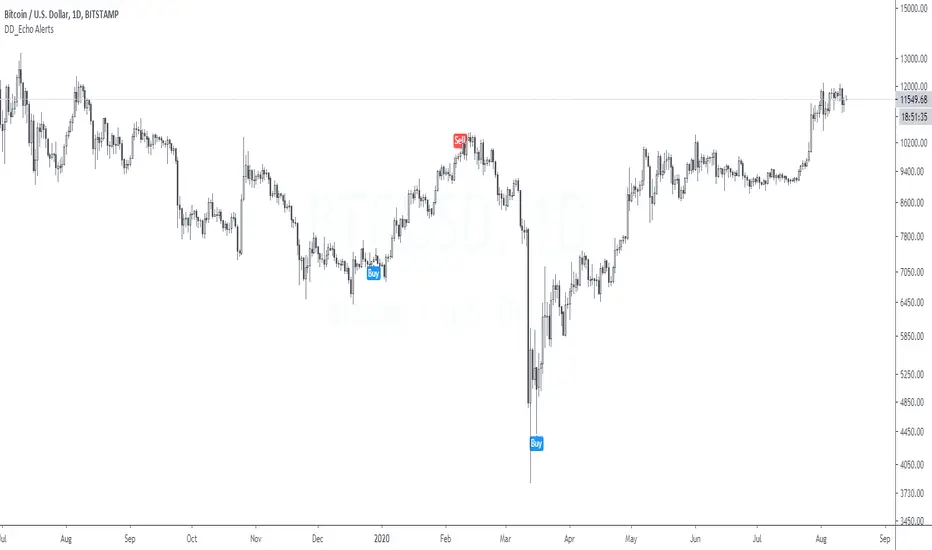
DD_Echo AlertsDD_Echo is a buy/sell trading strategy based on sentiment analysis such as fear and greed, Bitmex premium and quantity theory of money.
The performance metrics are as follows:
Net Profit: 412%
Sharpe Ratio: 1.27
Profit Ratio: 2.55
Hit Rate: 100%
If you want to access this, please DM me.
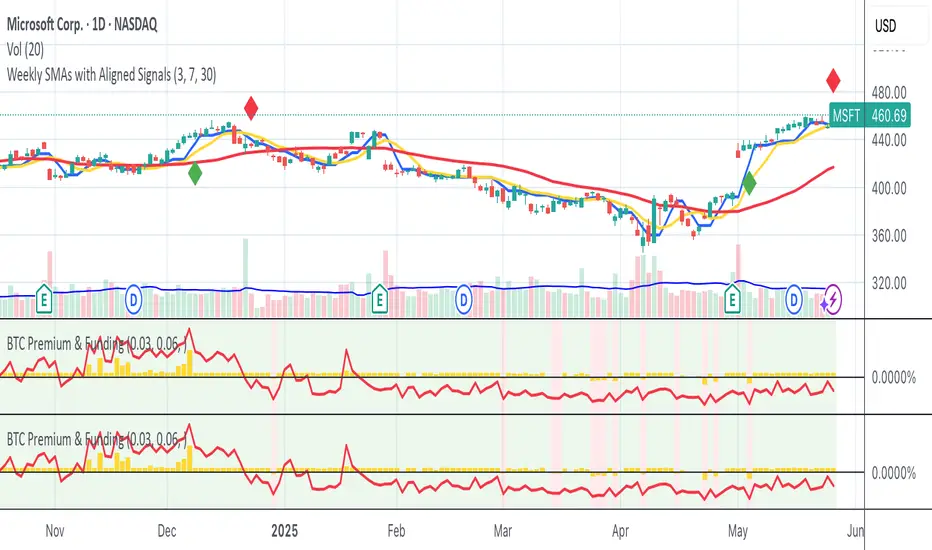
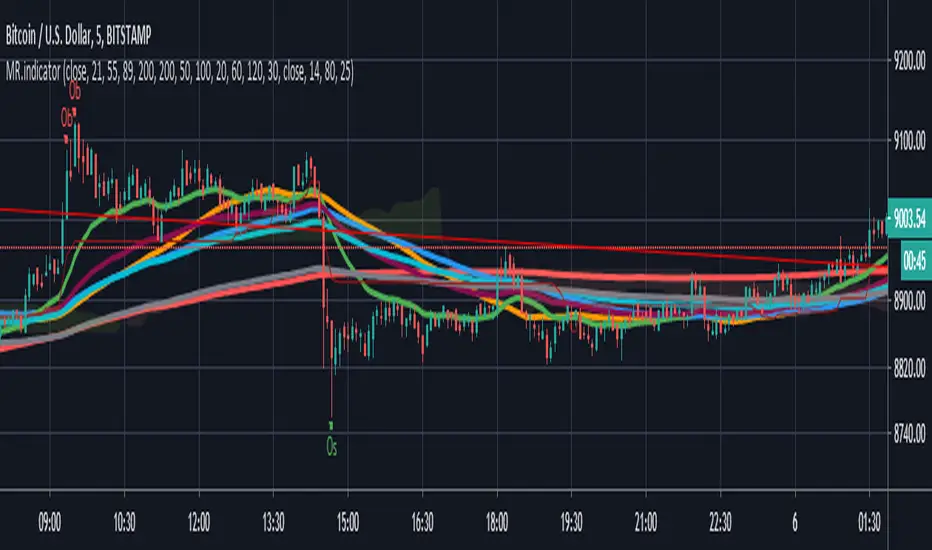
Moving Average With Ichimoku and Rsi hey guys
i post this indicator for who like Ma-Wma-Ichi-Rsi
i used most important Ma on it .
you can see overbuy or oversold on Rsi with a Ob-Os alarm on candel
ichimoku cloud is based on crypto setup
Enjoy
Dont forget to leave a like
~~~~~~~~~~~~~~~~~~~~~~~~~~~~~~~~~~~~~~~~~~~~~~~~~~~~~~~~~~~~~~~~~~~~~
RSi :
Rsi Signals its based on Rsi oscillator that mean you can see when market is overbuy or oversell
note : its not Buy or Sell Signal indicator (please dont use it for finding entry or exit )
~~~~~~~~~~~~~~~~~~~~~~~~~~~~~~~~~~~~~~~~~~~~~~~~~~~~~~~~~~~~~~~~~~~~
Ema-Sma-Wma :
An exponential moving average (EMA) is a type of moving average (MA) that places a greater weight and significance on the most recent data points. The exponential moving average is also referred to as the exponentially weighted moving average. An exponentially weighted moving average reacts more significantly to recent price changes than a simple moving average (SMA), which applies an equal weight to all observations in the period.
~~~~~~~~~~~~~~~~~~~~~~~~~~~~~~~~~~~~~~~~~~~~~~~~~~~~~~~~~~~~~~~~~~~~~~
ichimoku cloud :
My setup on this is different with default setup . which mean i used best setup for crypto to allow you take best result from it .
note : default setup is 9-26-52-26 and my setup is 20-60-120-30
dont forget to follow me and like this post !
Wick SniperThis indicator is free to all Oasis Trading Group members.
The Wick Sniper was created to catch volatile moves that are extended from the mean. It uses an advanced ATR formula to follow price like a band, with an upper deviation and a lower deviation. I have also added a 1 candle offset so that the moves are not in "hindsight". Feel free to experiment with the inputs to find what is best for your asset.
For Access or Questions: Private message us. Thank you.

Stochastic Pop and Drop Signals [Bitduke]It's a long/short signals for modified Stochastic Pop and Drop strategy.
About
It's the strategy of 2 indicators: Stochastic Oscillator to define the bias and Average Directional Index to confirm it.
Signals
Strategy flips long / short depending of indicator signals. There can be multiple signals of the same type, for example, 2 longs in a row, only the first of them matters, others you should handle in your websocket script or manually.
Testing
Tested on different sources for data, oscillator periods and different levels in relation to the crypto market.
So, it shows good results with two tight thresholds at 55 and 45 level.
The bar chart below the defining the bullish and bearish periods (green and red) and gives a signal to enter the trade (purple bars).
Backtesting
Backtested on XBTUSD , BTCPERP ( FTX ) pairs. You may notice it shows good results on 3h timeframe.
Relatively low drawdown
~ 10% (from 2019 to date) FTX
~ 22% (4 years from 2016) Bitmex
Bitmex 3h (2017 - 2020) :
i.imgur.com
FTX 3h (2019 - 2020):
i.imgur.com
Possible Improvements
- Regarding trading algorithm it would be good to check with strategy with ADX somehow. Maybe for the better entries
- As for Risk Management system, it can be improved by adding trailing stop to the strategy.
Link: school.stockcharts.com

XBT % ContangoSimilar to my other indicators, but measures XBTUSD Contango in terms of percent.
Also, built it so you could change the values that give the red and green signals. Default values are 0% or less (backwardation) indicates green. However, i found that a 0.5% setting worked will finding local bottoms for current contract of XBTH20 (March 2020). The upper value default is at 5%, and signals red when the next contract reaches over 5%.
My assumption is as BTC increases in value over time, measuring contango in terms of percent will be a better measure of the XBT futures curve.

XBT_Calc._TradersStreamLiqudity Calculator for XBTUSD. And Simplified SMA Cross Overs. If value is True than SMA 21 and 200 is active else SMA 30 and 40. Most of the Traders use this cross overs for Scalping purpose.

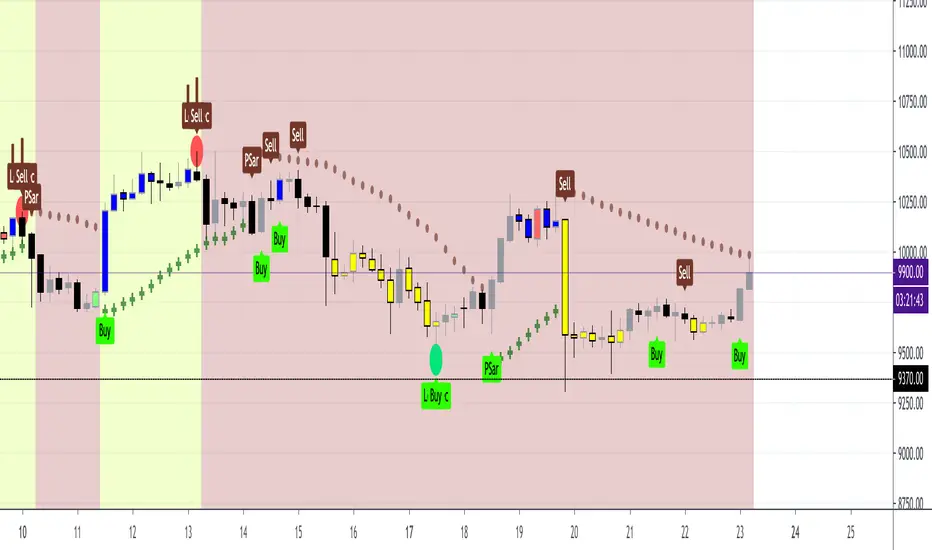
BTC Bullish or Bearish (Joy)Quite often we are faced with the question of whether Bitcoin is macro bullish or bearish.
I tried to take a punch at this.
There many ways to find that answer.
This is one crude way.
Whenever the background colour is light lime, it means it thinks the Bitcoin is macro bullish
Whenever the background colour is red lime, it means it thinks the Bitcoin is macro bearish
How would I use this information?
I can possibly use it in position sizing and hedging. If I see a sell in a lime background, I can potentially just hedge & vice versa.
Do note that it works best in the higher timeframes.
Do note that it is not supposed to be used to open any new trade or to close any trade.
I use it alongside other indicators for confirmation bias.
This can possibly be used for other instruments. As I only use it for trading BTCUSD, I have crudely tested for BTCUSD
For info on gaining access see the ⬇ link below ⬇ in our signature field & direct message me. I have a busy schedule at my own workplace. Trading is my hobby. Hence, please be kind to me if I am late in replying.