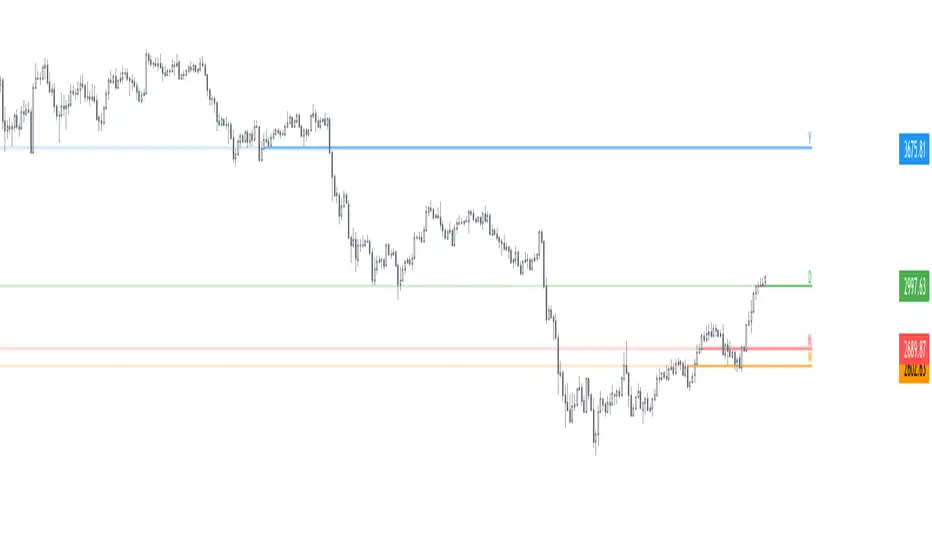
Dynamic Levels This indicator plots key price levels (Open, High, Low, Mid, Close) from multiple higher timeframes (Monday, Daily, Weekly, Monthly, Yearly).
It allows you to track how price interacts with important reference levels without switching timeframes.
🔑 Features
✅ Monday levels (MO, MH, MM)
By default: shows the last completed Monday (fixed values).
Option: “live mode” to update Monday High/Low/Mid while Monday’s candle is forming.
✅ Daily levels (DO, DH, DL, DM, DC)
Live: Daily High/Low/Mid update dynamically while today’s candle is forming.
Previous Daily Close (DC) is always fixed.
✅ Weekly levels (WO, WH, WL, WM)
Live: Weekly High/Low/Mid update dynamically while this week’s candle is forming.
Weekly Open is fixed.
✅ Monthly levels (MO(n), MH(n-1), ML(n-1), MM(n-1), MC(n-1))
Shows last completed month’s values (constant, never changing).
Current Monthly Open is also shown (naturally fixed).
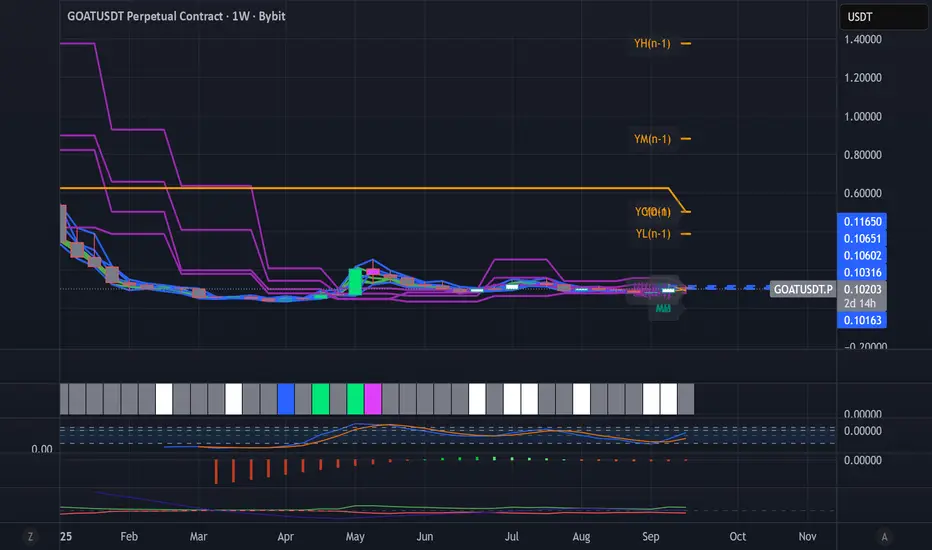
✅ Yearly levels (YO(n), YH(n-1), YL(n-1), YM(n-1), YC(n-1))
Shows last completed year’s values (constant, never changing).
Current Yearly Open is also shown (naturally fixed).
🎨 Customization
Toggle each level (on/off) in indicator settings.
Individual color settings for Monday, Daily, Weekly, Monthly, and Yearly.
Adjustable line width and transparency.
Optional short labels (MO, DO, WM, etc.) displayed on the right side of the chart.
🔄 Dynamic Logic
Daily and Weekly → update dynamically while their candle is forming.
Monday, Monthly, and Yearly → use fixed values from the last completed bar (do not “breathe”).
📌 Use cases
Quickly see where price stands relative to previous close, current open, or mid-levels.
Use Monday Open/High/Mid as strong intraday references.
Use Monthly/Yearly levels as long-term support/resistance zones.
Yearlyopen
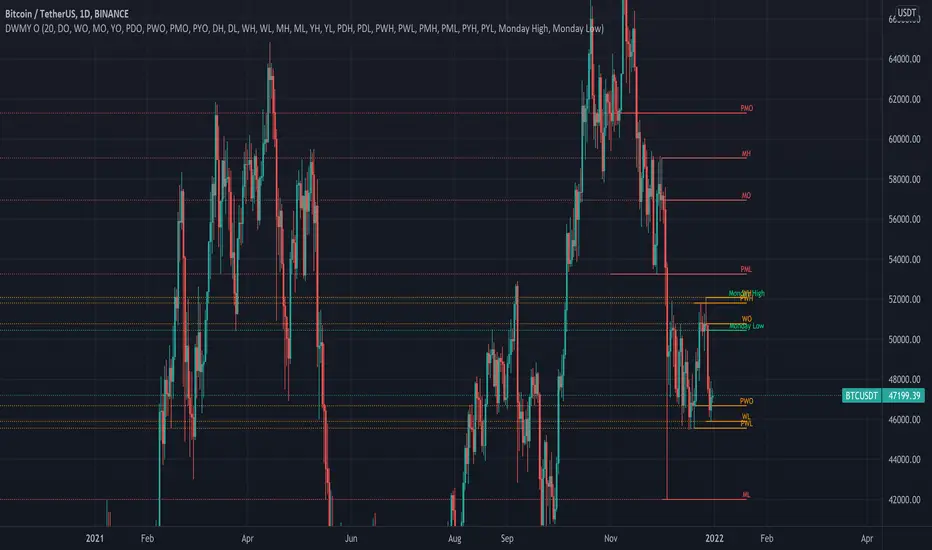
Daily Weekly Monthly Yearly OpensThis indicator draws key level lines such as daily open, weekly open, monthly open, yearly open, previous daily open, previous weekly open, previous monthly open, previous yearly open, monday daily high and monday daily low to chart. This lines can act either support or resistance but it is just possibility. This lines will help you to find buy and sell places.
Static + Dynamic LevelsShows static and dynamic levels which can act as support/resistance. These are important as there is a lot of users who are interested in buying/selling at these prices.
Static Levels include -
Daily/Weekly/Monthly/Yearly Open (changes color depending on if below or above price)
Previous Daily/Weekly/Monthly/Yearly Open
Previous day's High/Low
Dynamic Levels include -
100/200 Daily MA
100/200 Weekly MA

Daily Weekly Monthly Yearly OpensThis script plots the current daily, weekly and monthly opens (all enabled by default).
Here are some additional info about the drawing behavior:
Daily open is shown only on intraday timeframes
Weekly open is shown only on timeframes < weekly
Monthly open is shown only on timeframes < monthly